Free Statistics
of Irreproducible Research!
Description of Statistical Computation | |||||||||||||||||||||||||||||||||||||||||
|---|---|---|---|---|---|---|---|---|---|---|---|---|---|---|---|---|---|---|---|---|---|---|---|---|---|---|---|---|---|---|---|---|---|---|---|---|---|---|---|---|---|
| Author's title | |||||||||||||||||||||||||||||||||||||||||
| Author | *Unverified author* | ||||||||||||||||||||||||||||||||||||||||
| R Software Module | rwasp_univariatedataseries.wasp | ||||||||||||||||||||||||||||||||||||||||
| Title produced by software | Univariate Data Series | ||||||||||||||||||||||||||||||||||||||||
| Date of computation | Wed, 10 Feb 2010 04:20:59 -0700 | ||||||||||||||||||||||||||||||||||||||||
| Cite this page as follows | Statistical Computations at FreeStatistics.org, Office for Research Development and Education, URL https://freestatistics.org/blog/index.php?v=date/2010/Feb/10/t126580143436836f46u0rzpol.htm/, Retrieved Thu, 18 Apr 2024 09:45:12 +0000 | ||||||||||||||||||||||||||||||||||||||||
| Statistical Computations at FreeStatistics.org, Office for Research Development and Education, URL https://freestatistics.org/blog/index.php?pk=72940, Retrieved Thu, 18 Apr 2024 09:45:12 +0000 | |||||||||||||||||||||||||||||||||||||||||
| QR Codes: | |||||||||||||||||||||||||||||||||||||||||
|
| |||||||||||||||||||||||||||||||||||||||||
| Original text written by user: | paswoord was fout, maar het was: KDGP1W1 | ||||||||||||||||||||||||||||||||||||||||
| IsPrivate? | No (this computation is public) | ||||||||||||||||||||||||||||||||||||||||
| User-defined keywords | |||||||||||||||||||||||||||||||||||||||||
| Estimated Impact | 170 | ||||||||||||||||||||||||||||||||||||||||
Tree of Dependent Computations | |||||||||||||||||||||||||||||||||||||||||
| Family? (F = Feedback message, R = changed R code, M = changed R Module, P = changed Parameters, D = changed Data) | |||||||||||||||||||||||||||||||||||||||||
| - [Univariate Data Series] [Datareeks - Verha...] [2010-02-10 11:20:59] [5acc48f9ba7f16bb7cf06895aa242103] [Current] | |||||||||||||||||||||||||||||||||||||||||
| Feedback Forum | |||||||||||||||||||||||||||||||||||||||||
Post a new message | |||||||||||||||||||||||||||||||||||||||||
Dataset | |||||||||||||||||||||||||||||||||||||||||
| Dataseries X: | |||||||||||||||||||||||||||||||||||||||||
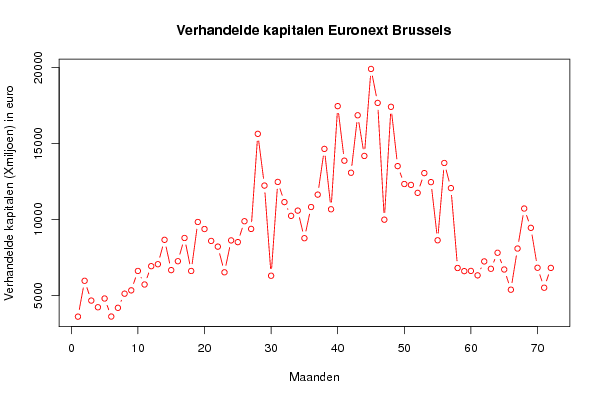
3592.209 5955.737 4652.245 4211.646 4787.85 3599.726 4174.27 5106.331 5325.748 6604.61 5711.903 6919.301 7048.762 8655.977 6658.531 7247.033 8779.571 6602.491 9832.484 9369.493 8582.763 8206.936 6515.833 8618.104 8505.387 9881.644 9375.294 15642.5 12232.729 6288.931 12473.941 11142.819 10236.315 10581.513 8763.71 10819.041 11636.247 14650.13 10671.384 17468.628 13873.187 13077.575 16866.811 14186.635 19919.865 17681.782 9984.276 17423.093 13514.449 12334.567 12274.561 11752.227 13054.001 12460.977 8626.675 13722.619 12066.218 6798.833 6593.818 6606.193 6315.275 7232.949 6747.437 7803.613 6700.314 5369.534 8081.188 10718.392 9447.21 6815.098 5497.801 6805.308 | |||||||||||||||||||||||||||||||||||||||||
Tables (Output of Computation) | |||||||||||||||||||||||||||||||||||||||||
| |||||||||||||||||||||||||||||||||||||||||
Figures (Output of Computation) | |||||||||||||||||||||||||||||||||||||||||
Input Parameters & R Code | |||||||||||||||||||||||||||||||||||||||||
| Parameters (Session): | |||||||||||||||||||||||||||||||||||||||||
| par1 = Euronext Brussels - verhandelde kapitalen ; par2 = http://www.nbb.be/belgostat/PresentationLinker?TableId=551000051&Lang=N ; par3 = Deze getallen geven de grootte van de verhandelde kapitalen op de Euronext Brussels per maand weer. ; | |||||||||||||||||||||||||||||||||||||||||
| Parameters (R input): | |||||||||||||||||||||||||||||||||||||||||
| par1 = Euronext Brussels - verhandelde kapitalen ; par2 = http://www.nbb.be/belgostat/PresentationLinker?TableId=551000051&Lang=N ; par3 = Deze getallen geven de grootte van de verhandelde kapitalen op de Euronext Brussels per maand weer. ; | |||||||||||||||||||||||||||||||||||||||||
| R code (references can be found in the software module): | |||||||||||||||||||||||||||||||||||||||||
bitmap(file='test1.png') | |||||||||||||||||||||||||||||||||||||||||