Free Statistics

of Irreproducible Research!

Author's title

Author*The author of this computation has been verified*
R Software Modulerwasp_autocorrelation.wasp
Title produced by software(Partial) Autocorrelation Function
Date of computationTue, 21 Dec 2010 16:37:24 +0000
Cite this page as followsStatistical Computations at FreeStatistics.org, Office for Research Development and Education, URL https://freestatistics.org/blog/index.php?v=date/2010/Dec/21/t12929493263dfbj8uyq7ilg6y.htm/, Retrieved Fri, 17 May 2024 04:17:39 +0000
Statistical Computations at FreeStatistics.org, Office for Research Development and Education, URL https://freestatistics.org/blog/index.php?pk=113736, Retrieved Fri, 17 May 2024 04:17:39 +0000
QR Codes:

Original text written by user:
IsPrivate?No (this computation is public)
User-defined keywords
Estimated Impact149
Family? (F = Feedback message, R = changed R code, M = changed R Module, P = changed Parameters, D = changed Data)
-     [Univariate Data Series] [data set] [2008-12-01 19:54:57] [b98453cac15ba1066b407e146608df68]
- RMP   [(Partial) Autocorrelation Function] [WS8 Autocorolation] [2010-12-01 09:55:45] [b84bdc9bd81e1f02ca0dcc4710c1b790]
- R PD      [(Partial) Autocorrelation Function] [ACF d=1, D=1] [2010-12-21 16:37:24] [a8abc7260f3c847aeac0a796e7895a2e] [Current]
Feedback Forum

Post a new message
Dataseries X:
143827
145191
146832
148577
149873
151847
153252
154292
155657
156523
156416
156693
160312
160438
160882
161668
164391
168556
169738
170387
171294
172202
172651
172770
178366
180014
181067
182586
184957
186417
188599
189490
190264
191221
191110
190674
195438
196393
197172
198760
200945
203845
204613
205487
206100
206315
206291
207801
211653
211325
211893
212056
214696
217455
218884
219816
219984
219062
218550
218179
222218
222196
223393
223292
226236
228831
228745
229140
229270
229359
230006
228810
232677
232961
234629
235660
240024
243554
244368
244356
245126
246321
246797
246735
251083
251786
252732
255051
259022
261698
263891
265247
262228
263429
264305
266371
273248
275472
278146
279506
283991
286794
288703
289285
288869
286942
285833
284095
289229
289389
290793
291454
294733
293853
294056
293982
293075
292391


Summary of computational transaction
Raw Inputview raw input (R code)
Raw Outputview raw output of R engine
Computing time2 seconds
R Server'Sir Ronald Aylmer Fisher' @ 193.190.124.24

\begin{tabular}{lllllllll}
\hline
Summary of computational transaction \tabularnewline
Raw Input & view raw input (R code)  \tabularnewline
Raw Output & view raw output of R engine  \tabularnewline
Computing time & 2 seconds \tabularnewline
R Server & 'Sir Ronald Aylmer Fisher' @ 193.190.124.24 \tabularnewline
\hline
\end{tabular}
%Source: https://freestatistics.org/blog/index.php?pk=113736&T=0

[TABLE]
[ROW][C]Summary of computational transaction[/C][/ROW]
[ROW][C]Raw Input[/C][C]view raw input (R code) [/C][/ROW]
[ROW][C]Raw Output[/C][C]view raw output of R engine [/C][/ROW]
[ROW][C]Computing time[/C][C]2 seconds[/C][/ROW]
[ROW][C]R Server[/C][C]'Sir Ronald Aylmer Fisher' @ 193.190.124.24[/C][/ROW]
[/TABLE]
Source: https://freestatistics.org/blog/index.php?pk=113736&T=0

Globally Unique Identifier (entire table): ba.freestatistics.org/blog/index.php?pk=113736&T=0

As an alternative you can also use a QR Code:  

The GUIDs for individual cells are displayed in the table below:

Summary of computational transaction
Raw Inputview raw input (R code)
Raw Outputview raw output of R engine
Computing time2 seconds
R Server'Sir Ronald Aylmer Fisher' @ 193.190.124.24


Autocorrelation Function
Time lag kACF(k)T-STATP-value
10.2786622.85540.00259
20.1780141.82410.035491
30.0758250.7770.219462
40.0236690.24250.40442
50.0141580.14510.442466
60.2472792.53390.006379
70.1961042.00950.023527
80.1652141.69290.046716
9-0.079709-0.81680.207953
10-0.143356-1.4690.072416
11-0.154889-1.58710.057744
12-0.353404-3.62130.000227
130.0770440.78950.215809
140.0701930.71930.236787
150.0374350.38360.351026
16-0.070323-0.72060.236381
17-0.028464-0.29170.385558
18-0.200787-2.05750.02106
19-0.057752-0.59180.277634
200.0504590.51710.303104
210.1678421.71990.044201
220.0509580.52220.301329
230.0177740.18210.427915
24-0.080334-0.82320.206135
25-0.141102-1.44590.075596
26-0.056035-0.57420.283535
27-0.055669-0.57040.284801
28-0.044423-0.45520.324951
29-0.057391-0.58810.278869
30-0.054935-0.56290.287345
31-0.108175-1.10850.135097
32-0.216271-2.21610.01442
33-0.12049-1.23470.109858
34-0.051025-0.52290.301089
35-0.047509-0.48680.3137
36-0.040424-0.41420.339776
37-0.052715-0.54020.295114
38-0.124523-1.2760.102389
39-0.098161-1.00580.1584
40-0.044152-0.45240.325949
41-0.051325-0.52590.300024
42-0.009429-0.09660.461607
430.0336250.34460.365559
440.0496330.50860.306056
45-0.112606-1.15390.125587
460.0060480.0620.47535
47-0.019084-0.19560.422669
480.0593210.60790.272298
490.0118610.12150.451748
500.1144461.17270.12178
510.0007260.00740.497038
520.0356860.36570.357673
530.0211160.21640.414558
540.0639490.65530.25686
550.0071280.0730.470957
560.0718160.73590.231717
570.1629471.66970.048977
580.0024770.02540.489901
590.0158250.16220.435746
600.0039480.04050.483903

\begin{tabular}{lllllllll}
\hline
Autocorrelation Function \tabularnewline
Time lag k & ACF(k) & T-STAT & P-value \tabularnewline
1 & 0.278662 & 2.8554 & 0.00259 \tabularnewline
2 & 0.178014 & 1.8241 & 0.035491 \tabularnewline
3 & 0.075825 & 0.777 & 0.219462 \tabularnewline
4 & 0.023669 & 0.2425 & 0.40442 \tabularnewline
5 & 0.014158 & 0.1451 & 0.442466 \tabularnewline
6 & 0.247279 & 2.5339 & 0.006379 \tabularnewline
7 & 0.196104 & 2.0095 & 0.023527 \tabularnewline
8 & 0.165214 & 1.6929 & 0.046716 \tabularnewline
9 & -0.079709 & -0.8168 & 0.207953 \tabularnewline
10 & -0.143356 & -1.469 & 0.072416 \tabularnewline
11 & -0.154889 & -1.5871 & 0.057744 \tabularnewline
12 & -0.353404 & -3.6213 & 0.000227 \tabularnewline
13 & 0.077044 & 0.7895 & 0.215809 \tabularnewline
14 & 0.070193 & 0.7193 & 0.236787 \tabularnewline
15 & 0.037435 & 0.3836 & 0.351026 \tabularnewline
16 & -0.070323 & -0.7206 & 0.236381 \tabularnewline
17 & -0.028464 & -0.2917 & 0.385558 \tabularnewline
18 & -0.200787 & -2.0575 & 0.02106 \tabularnewline
19 & -0.057752 & -0.5918 & 0.277634 \tabularnewline
20 & 0.050459 & 0.5171 & 0.303104 \tabularnewline
21 & 0.167842 & 1.7199 & 0.044201 \tabularnewline
22 & 0.050958 & 0.5222 & 0.301329 \tabularnewline
23 & 0.017774 & 0.1821 & 0.427915 \tabularnewline
24 & -0.080334 & -0.8232 & 0.206135 \tabularnewline
25 & -0.141102 & -1.4459 & 0.075596 \tabularnewline
26 & -0.056035 & -0.5742 & 0.283535 \tabularnewline
27 & -0.055669 & -0.5704 & 0.284801 \tabularnewline
28 & -0.044423 & -0.4552 & 0.324951 \tabularnewline
29 & -0.057391 & -0.5881 & 0.278869 \tabularnewline
30 & -0.054935 & -0.5629 & 0.287345 \tabularnewline
31 & -0.108175 & -1.1085 & 0.135097 \tabularnewline
32 & -0.216271 & -2.2161 & 0.01442 \tabularnewline
33 & -0.12049 & -1.2347 & 0.109858 \tabularnewline
34 & -0.051025 & -0.5229 & 0.301089 \tabularnewline
35 & -0.047509 & -0.4868 & 0.3137 \tabularnewline
36 & -0.040424 & -0.4142 & 0.339776 \tabularnewline
37 & -0.052715 & -0.5402 & 0.295114 \tabularnewline
38 & -0.124523 & -1.276 & 0.102389 \tabularnewline
39 & -0.098161 & -1.0058 & 0.1584 \tabularnewline
40 & -0.044152 & -0.4524 & 0.325949 \tabularnewline
41 & -0.051325 & -0.5259 & 0.300024 \tabularnewline
42 & -0.009429 & -0.0966 & 0.461607 \tabularnewline
43 & 0.033625 & 0.3446 & 0.365559 \tabularnewline
44 & 0.049633 & 0.5086 & 0.306056 \tabularnewline
45 & -0.112606 & -1.1539 & 0.125587 \tabularnewline
46 & 0.006048 & 0.062 & 0.47535 \tabularnewline
47 & -0.019084 & -0.1956 & 0.422669 \tabularnewline
48 & 0.059321 & 0.6079 & 0.272298 \tabularnewline
49 & 0.011861 & 0.1215 & 0.451748 \tabularnewline
50 & 0.114446 & 1.1727 & 0.12178 \tabularnewline
51 & 0.000726 & 0.0074 & 0.497038 \tabularnewline
52 & 0.035686 & 0.3657 & 0.357673 \tabularnewline
53 & 0.021116 & 0.2164 & 0.414558 \tabularnewline
54 & 0.063949 & 0.6553 & 0.25686 \tabularnewline
55 & 0.007128 & 0.073 & 0.470957 \tabularnewline
56 & 0.071816 & 0.7359 & 0.231717 \tabularnewline
57 & 0.162947 & 1.6697 & 0.048977 \tabularnewline
58 & 0.002477 & 0.0254 & 0.489901 \tabularnewline
59 & 0.015825 & 0.1622 & 0.435746 \tabularnewline
60 & 0.003948 & 0.0405 & 0.483903 \tabularnewline
\hline
\end{tabular}
%Source: https://freestatistics.org/blog/index.php?pk=113736&T=1

[TABLE]
[ROW][C]Autocorrelation Function[/C][/ROW]
[ROW][C]Time lag k[/C][C]ACF(k)[/C][C]T-STAT[/C][C]P-value[/C][/ROW]
[ROW][C]1[/C][C]0.278662[/C][C]2.8554[/C][C]0.00259[/C][/ROW]
[ROW][C]2[/C][C]0.178014[/C][C]1.8241[/C][C]0.035491[/C][/ROW]
[ROW][C]3[/C][C]0.075825[/C][C]0.777[/C][C]0.219462[/C][/ROW]
[ROW][C]4[/C][C]0.023669[/C][C]0.2425[/C][C]0.40442[/C][/ROW]
[ROW][C]5[/C][C]0.014158[/C][C]0.1451[/C][C]0.442466[/C][/ROW]
[ROW][C]6[/C][C]0.247279[/C][C]2.5339[/C][C]0.006379[/C][/ROW]
[ROW][C]7[/C][C]0.196104[/C][C]2.0095[/C][C]0.023527[/C][/ROW]
[ROW][C]8[/C][C]0.165214[/C][C]1.6929[/C][C]0.046716[/C][/ROW]
[ROW][C]9[/C][C]-0.079709[/C][C]-0.8168[/C][C]0.207953[/C][/ROW]
[ROW][C]10[/C][C]-0.143356[/C][C]-1.469[/C][C]0.072416[/C][/ROW]
[ROW][C]11[/C][C]-0.154889[/C][C]-1.5871[/C][C]0.057744[/C][/ROW]
[ROW][C]12[/C][C]-0.353404[/C][C]-3.6213[/C][C]0.000227[/C][/ROW]
[ROW][C]13[/C][C]0.077044[/C][C]0.7895[/C][C]0.215809[/C][/ROW]
[ROW][C]14[/C][C]0.070193[/C][C]0.7193[/C][C]0.236787[/C][/ROW]
[ROW][C]15[/C][C]0.037435[/C][C]0.3836[/C][C]0.351026[/C][/ROW]
[ROW][C]16[/C][C]-0.070323[/C][C]-0.7206[/C][C]0.236381[/C][/ROW]
[ROW][C]17[/C][C]-0.028464[/C][C]-0.2917[/C][C]0.385558[/C][/ROW]
[ROW][C]18[/C][C]-0.200787[/C][C]-2.0575[/C][C]0.02106[/C][/ROW]
[ROW][C]19[/C][C]-0.057752[/C][C]-0.5918[/C][C]0.277634[/C][/ROW]
[ROW][C]20[/C][C]0.050459[/C][C]0.5171[/C][C]0.303104[/C][/ROW]
[ROW][C]21[/C][C]0.167842[/C][C]1.7199[/C][C]0.044201[/C][/ROW]
[ROW][C]22[/C][C]0.050958[/C][C]0.5222[/C][C]0.301329[/C][/ROW]
[ROW][C]23[/C][C]0.017774[/C][C]0.1821[/C][C]0.427915[/C][/ROW]
[ROW][C]24[/C][C]-0.080334[/C][C]-0.8232[/C][C]0.206135[/C][/ROW]
[ROW][C]25[/C][C]-0.141102[/C][C]-1.4459[/C][C]0.075596[/C][/ROW]
[ROW][C]26[/C][C]-0.056035[/C][C]-0.5742[/C][C]0.283535[/C][/ROW]
[ROW][C]27[/C][C]-0.055669[/C][C]-0.5704[/C][C]0.284801[/C][/ROW]
[ROW][C]28[/C][C]-0.044423[/C][C]-0.4552[/C][C]0.324951[/C][/ROW]
[ROW][C]29[/C][C]-0.057391[/C][C]-0.5881[/C][C]0.278869[/C][/ROW]
[ROW][C]30[/C][C]-0.054935[/C][C]-0.5629[/C][C]0.287345[/C][/ROW]
[ROW][C]31[/C][C]-0.108175[/C][C]-1.1085[/C][C]0.135097[/C][/ROW]
[ROW][C]32[/C][C]-0.216271[/C][C]-2.2161[/C][C]0.01442[/C][/ROW]
[ROW][C]33[/C][C]-0.12049[/C][C]-1.2347[/C][C]0.109858[/C][/ROW]
[ROW][C]34[/C][C]-0.051025[/C][C]-0.5229[/C][C]0.301089[/C][/ROW]
[ROW][C]35[/C][C]-0.047509[/C][C]-0.4868[/C][C]0.3137[/C][/ROW]
[ROW][C]36[/C][C]-0.040424[/C][C]-0.4142[/C][C]0.339776[/C][/ROW]
[ROW][C]37[/C][C]-0.052715[/C][C]-0.5402[/C][C]0.295114[/C][/ROW]
[ROW][C]38[/C][C]-0.124523[/C][C]-1.276[/C][C]0.102389[/C][/ROW]
[ROW][C]39[/C][C]-0.098161[/C][C]-1.0058[/C][C]0.1584[/C][/ROW]
[ROW][C]40[/C][C]-0.044152[/C][C]-0.4524[/C][C]0.325949[/C][/ROW]
[ROW][C]41[/C][C]-0.051325[/C][C]-0.5259[/C][C]0.300024[/C][/ROW]
[ROW][C]42[/C][C]-0.009429[/C][C]-0.0966[/C][C]0.461607[/C][/ROW]
[ROW][C]43[/C][C]0.033625[/C][C]0.3446[/C][C]0.365559[/C][/ROW]
[ROW][C]44[/C][C]0.049633[/C][C]0.5086[/C][C]0.306056[/C][/ROW]
[ROW][C]45[/C][C]-0.112606[/C][C]-1.1539[/C][C]0.125587[/C][/ROW]
[ROW][C]46[/C][C]0.006048[/C][C]0.062[/C][C]0.47535[/C][/ROW]
[ROW][C]47[/C][C]-0.019084[/C][C]-0.1956[/C][C]0.422669[/C][/ROW]
[ROW][C]48[/C][C]0.059321[/C][C]0.6079[/C][C]0.272298[/C][/ROW]
[ROW][C]49[/C][C]0.011861[/C][C]0.1215[/C][C]0.451748[/C][/ROW]
[ROW][C]50[/C][C]0.114446[/C][C]1.1727[/C][C]0.12178[/C][/ROW]
[ROW][C]51[/C][C]0.000726[/C][C]0.0074[/C][C]0.497038[/C][/ROW]
[ROW][C]52[/C][C]0.035686[/C][C]0.3657[/C][C]0.357673[/C][/ROW]
[ROW][C]53[/C][C]0.021116[/C][C]0.2164[/C][C]0.414558[/C][/ROW]
[ROW][C]54[/C][C]0.063949[/C][C]0.6553[/C][C]0.25686[/C][/ROW]
[ROW][C]55[/C][C]0.007128[/C][C]0.073[/C][C]0.470957[/C][/ROW]
[ROW][C]56[/C][C]0.071816[/C][C]0.7359[/C][C]0.231717[/C][/ROW]
[ROW][C]57[/C][C]0.162947[/C][C]1.6697[/C][C]0.048977[/C][/ROW]
[ROW][C]58[/C][C]0.002477[/C][C]0.0254[/C][C]0.489901[/C][/ROW]
[ROW][C]59[/C][C]0.015825[/C][C]0.1622[/C][C]0.435746[/C][/ROW]
[ROW][C]60[/C][C]0.003948[/C][C]0.0405[/C][C]0.483903[/C][/ROW]
[/TABLE]
Source: https://freestatistics.org/blog/index.php?pk=113736&T=1

Globally Unique Identifier (entire table): ba.freestatistics.org/blog/index.php?pk=113736&T=1

As an alternative you can also use a QR Code:  

The GUIDs for individual cells are displayed in the table below:

Autocorrelation Function
Time lag kACF(k)T-STATP-value
10.2786622.85540.00259
20.1780141.82410.035491
30.0758250.7770.219462
40.0236690.24250.40442
50.0141580.14510.442466
60.2472792.53390.006379
70.1961042.00950.023527
80.1652141.69290.046716
9-0.079709-0.81680.207953
10-0.143356-1.4690.072416
11-0.154889-1.58710.057744
12-0.353404-3.62130.000227
130.0770440.78950.215809
140.0701930.71930.236787
150.0374350.38360.351026
16-0.070323-0.72060.236381
17-0.028464-0.29170.385558
18-0.200787-2.05750.02106
19-0.057752-0.59180.277634
200.0504590.51710.303104
210.1678421.71990.044201
220.0509580.52220.301329
230.0177740.18210.427915
24-0.080334-0.82320.206135
25-0.141102-1.44590.075596
26-0.056035-0.57420.283535
27-0.055669-0.57040.284801
28-0.044423-0.45520.324951
29-0.057391-0.58810.278869
30-0.054935-0.56290.287345
31-0.108175-1.10850.135097
32-0.216271-2.21610.01442
33-0.12049-1.23470.109858
34-0.051025-0.52290.301089
35-0.047509-0.48680.3137
36-0.040424-0.41420.339776
37-0.052715-0.54020.295114
38-0.124523-1.2760.102389
39-0.098161-1.00580.1584
40-0.044152-0.45240.325949
41-0.051325-0.52590.300024
42-0.009429-0.09660.461607
430.0336250.34460.365559
440.0496330.50860.306056
45-0.112606-1.15390.125587
460.0060480.0620.47535
47-0.019084-0.19560.422669
480.0593210.60790.272298
490.0118610.12150.451748
500.1144461.17270.12178
510.0007260.00740.497038
520.0356860.36570.357673
530.0211160.21640.414558
540.0639490.65530.25686
550.0071280.0730.470957
560.0718160.73590.231717
570.1629471.66970.048977
580.0024770.02540.489901
590.0158250.16220.435746
600.0039480.04050.483903


Partial Autocorrelation Function
Time lag kPACF(k)T-STATP-value
10.2786622.85540.00259
20.108811.1150.133703
30.0014210.01460.494205
4-0.016296-0.1670.433851
50.0038340.03930.48437
60.2664432.73020.003712
70.0869840.89130.187397
80.0359330.36820.356731
9-0.215225-2.20540.014803
10-0.138414-1.41830.079529
11-0.053146-0.54460.293597
12-0.369237-3.78360.000129
130.2776262.84480.002672
140.0213380.21860.413675
150.0730670.74870.227851
16-0.048982-0.50190.308389
170.0837710.85840.196314
180.0236170.2420.404625
19-0.046724-0.47880.316547
200.1355711.38920.083858
21-0.073484-0.7530.22657
22-0.043177-0.44240.329542
23-0.079011-0.80960.209993
24-0.194164-1.98960.024618
250.0950630.97410.166122
26-0.024861-0.25470.399709
27-0.092309-0.94590.173189
28-0.166977-1.7110.045017
290.0564350.57830.282154
300.0164420.16850.433266
310.0208620.21380.415571
32-0.082963-0.85010.198596
330.0656320.67250.251364
34-0.033599-0.34430.365659
35-0.007453-0.07640.469633
36-0.120501-1.23480.109836
37-0.050302-0.51540.303663
380.0028590.02930.488341
39-0.146701-1.50320.067889
40-0.003983-0.04080.483762
41-0.104081-1.06650.144319
420.0479650.49150.312051
430.0739830.75810.225044
44-0.014212-0.14560.442246
45-0.026714-0.27370.392413
460.0390190.39980.345048
470.0397180.4070.342422
480.0068370.07010.472141
49-0.037901-0.38840.349266
500.048970.50180.308431
51-0.130615-1.33840.091828
520.033580.34410.365731
530.0104210.10680.457581
54-0.014796-0.15160.43989
550.0004690.00480.498089
56-0.033561-0.34390.365807
570.1406391.44110.076263
58-0.042328-0.43370.332688
59-0.013796-0.14140.443926
60-0.003187-0.03270.487006

\begin{tabular}{lllllllll}
\hline
Partial Autocorrelation Function \tabularnewline
Time lag k & PACF(k) & T-STAT & P-value \tabularnewline
1 & 0.278662 & 2.8554 & 0.00259 \tabularnewline
2 & 0.10881 & 1.115 & 0.133703 \tabularnewline
3 & 0.001421 & 0.0146 & 0.494205 \tabularnewline
4 & -0.016296 & -0.167 & 0.433851 \tabularnewline
5 & 0.003834 & 0.0393 & 0.48437 \tabularnewline
6 & 0.266443 & 2.7302 & 0.003712 \tabularnewline
7 & 0.086984 & 0.8913 & 0.187397 \tabularnewline
8 & 0.035933 & 0.3682 & 0.356731 \tabularnewline
9 & -0.215225 & -2.2054 & 0.014803 \tabularnewline
10 & -0.138414 & -1.4183 & 0.079529 \tabularnewline
11 & -0.053146 & -0.5446 & 0.293597 \tabularnewline
12 & -0.369237 & -3.7836 & 0.000129 \tabularnewline
13 & 0.277626 & 2.8448 & 0.002672 \tabularnewline
14 & 0.021338 & 0.2186 & 0.413675 \tabularnewline
15 & 0.073067 & 0.7487 & 0.227851 \tabularnewline
16 & -0.048982 & -0.5019 & 0.308389 \tabularnewline
17 & 0.083771 & 0.8584 & 0.196314 \tabularnewline
18 & 0.023617 & 0.242 & 0.404625 \tabularnewline
19 & -0.046724 & -0.4788 & 0.316547 \tabularnewline
20 & 0.135571 & 1.3892 & 0.083858 \tabularnewline
21 & -0.073484 & -0.753 & 0.22657 \tabularnewline
22 & -0.043177 & -0.4424 & 0.329542 \tabularnewline
23 & -0.079011 & -0.8096 & 0.209993 \tabularnewline
24 & -0.194164 & -1.9896 & 0.024618 \tabularnewline
25 & 0.095063 & 0.9741 & 0.166122 \tabularnewline
26 & -0.024861 & -0.2547 & 0.399709 \tabularnewline
27 & -0.092309 & -0.9459 & 0.173189 \tabularnewline
28 & -0.166977 & -1.711 & 0.045017 \tabularnewline
29 & 0.056435 & 0.5783 & 0.282154 \tabularnewline
30 & 0.016442 & 0.1685 & 0.433266 \tabularnewline
31 & 0.020862 & 0.2138 & 0.415571 \tabularnewline
32 & -0.082963 & -0.8501 & 0.198596 \tabularnewline
33 & 0.065632 & 0.6725 & 0.251364 \tabularnewline
34 & -0.033599 & -0.3443 & 0.365659 \tabularnewline
35 & -0.007453 & -0.0764 & 0.469633 \tabularnewline
36 & -0.120501 & -1.2348 & 0.109836 \tabularnewline
37 & -0.050302 & -0.5154 & 0.303663 \tabularnewline
38 & 0.002859 & 0.0293 & 0.488341 \tabularnewline
39 & -0.146701 & -1.5032 & 0.067889 \tabularnewline
40 & -0.003983 & -0.0408 & 0.483762 \tabularnewline
41 & -0.104081 & -1.0665 & 0.144319 \tabularnewline
42 & 0.047965 & 0.4915 & 0.312051 \tabularnewline
43 & 0.073983 & 0.7581 & 0.225044 \tabularnewline
44 & -0.014212 & -0.1456 & 0.442246 \tabularnewline
45 & -0.026714 & -0.2737 & 0.392413 \tabularnewline
46 & 0.039019 & 0.3998 & 0.345048 \tabularnewline
47 & 0.039718 & 0.407 & 0.342422 \tabularnewline
48 & 0.006837 & 0.0701 & 0.472141 \tabularnewline
49 & -0.037901 & -0.3884 & 0.349266 \tabularnewline
50 & 0.04897 & 0.5018 & 0.308431 \tabularnewline
51 & -0.130615 & -1.3384 & 0.091828 \tabularnewline
52 & 0.03358 & 0.3441 & 0.365731 \tabularnewline
53 & 0.010421 & 0.1068 & 0.457581 \tabularnewline
54 & -0.014796 & -0.1516 & 0.43989 \tabularnewline
55 & 0.000469 & 0.0048 & 0.498089 \tabularnewline
56 & -0.033561 & -0.3439 & 0.365807 \tabularnewline
57 & 0.140639 & 1.4411 & 0.076263 \tabularnewline
58 & -0.042328 & -0.4337 & 0.332688 \tabularnewline
59 & -0.013796 & -0.1414 & 0.443926 \tabularnewline
60 & -0.003187 & -0.0327 & 0.487006 \tabularnewline
\hline
\end{tabular}
%Source: https://freestatistics.org/blog/index.php?pk=113736&T=2

[TABLE]
[ROW][C]Partial Autocorrelation Function[/C][/ROW]
[ROW][C]Time lag k[/C][C]PACF(k)[/C][C]T-STAT[/C][C]P-value[/C][/ROW]
[ROW][C]1[/C][C]0.278662[/C][C]2.8554[/C][C]0.00259[/C][/ROW]
[ROW][C]2[/C][C]0.10881[/C][C]1.115[/C][C]0.133703[/C][/ROW]
[ROW][C]3[/C][C]0.001421[/C][C]0.0146[/C][C]0.494205[/C][/ROW]
[ROW][C]4[/C][C]-0.016296[/C][C]-0.167[/C][C]0.433851[/C][/ROW]
[ROW][C]5[/C][C]0.003834[/C][C]0.0393[/C][C]0.48437[/C][/ROW]
[ROW][C]6[/C][C]0.266443[/C][C]2.7302[/C][C]0.003712[/C][/ROW]
[ROW][C]7[/C][C]0.086984[/C][C]0.8913[/C][C]0.187397[/C][/ROW]
[ROW][C]8[/C][C]0.035933[/C][C]0.3682[/C][C]0.356731[/C][/ROW]
[ROW][C]9[/C][C]-0.215225[/C][C]-2.2054[/C][C]0.014803[/C][/ROW]
[ROW][C]10[/C][C]-0.138414[/C][C]-1.4183[/C][C]0.079529[/C][/ROW]
[ROW][C]11[/C][C]-0.053146[/C][C]-0.5446[/C][C]0.293597[/C][/ROW]
[ROW][C]12[/C][C]-0.369237[/C][C]-3.7836[/C][C]0.000129[/C][/ROW]
[ROW][C]13[/C][C]0.277626[/C][C]2.8448[/C][C]0.002672[/C][/ROW]
[ROW][C]14[/C][C]0.021338[/C][C]0.2186[/C][C]0.413675[/C][/ROW]
[ROW][C]15[/C][C]0.073067[/C][C]0.7487[/C][C]0.227851[/C][/ROW]
[ROW][C]16[/C][C]-0.048982[/C][C]-0.5019[/C][C]0.308389[/C][/ROW]
[ROW][C]17[/C][C]0.083771[/C][C]0.8584[/C][C]0.196314[/C][/ROW]
[ROW][C]18[/C][C]0.023617[/C][C]0.242[/C][C]0.404625[/C][/ROW]
[ROW][C]19[/C][C]-0.046724[/C][C]-0.4788[/C][C]0.316547[/C][/ROW]
[ROW][C]20[/C][C]0.135571[/C][C]1.3892[/C][C]0.083858[/C][/ROW]
[ROW][C]21[/C][C]-0.073484[/C][C]-0.753[/C][C]0.22657[/C][/ROW]
[ROW][C]22[/C][C]-0.043177[/C][C]-0.4424[/C][C]0.329542[/C][/ROW]
[ROW][C]23[/C][C]-0.079011[/C][C]-0.8096[/C][C]0.209993[/C][/ROW]
[ROW][C]24[/C][C]-0.194164[/C][C]-1.9896[/C][C]0.024618[/C][/ROW]
[ROW][C]25[/C][C]0.095063[/C][C]0.9741[/C][C]0.166122[/C][/ROW]
[ROW][C]26[/C][C]-0.024861[/C][C]-0.2547[/C][C]0.399709[/C][/ROW]
[ROW][C]27[/C][C]-0.092309[/C][C]-0.9459[/C][C]0.173189[/C][/ROW]
[ROW][C]28[/C][C]-0.166977[/C][C]-1.711[/C][C]0.045017[/C][/ROW]
[ROW][C]29[/C][C]0.056435[/C][C]0.5783[/C][C]0.282154[/C][/ROW]
[ROW][C]30[/C][C]0.016442[/C][C]0.1685[/C][C]0.433266[/C][/ROW]
[ROW][C]31[/C][C]0.020862[/C][C]0.2138[/C][C]0.415571[/C][/ROW]
[ROW][C]32[/C][C]-0.082963[/C][C]-0.8501[/C][C]0.198596[/C][/ROW]
[ROW][C]33[/C][C]0.065632[/C][C]0.6725[/C][C]0.251364[/C][/ROW]
[ROW][C]34[/C][C]-0.033599[/C][C]-0.3443[/C][C]0.365659[/C][/ROW]
[ROW][C]35[/C][C]-0.007453[/C][C]-0.0764[/C][C]0.469633[/C][/ROW]
[ROW][C]36[/C][C]-0.120501[/C][C]-1.2348[/C][C]0.109836[/C][/ROW]
[ROW][C]37[/C][C]-0.050302[/C][C]-0.5154[/C][C]0.303663[/C][/ROW]
[ROW][C]38[/C][C]0.002859[/C][C]0.0293[/C][C]0.488341[/C][/ROW]
[ROW][C]39[/C][C]-0.146701[/C][C]-1.5032[/C][C]0.067889[/C][/ROW]
[ROW][C]40[/C][C]-0.003983[/C][C]-0.0408[/C][C]0.483762[/C][/ROW]
[ROW][C]41[/C][C]-0.104081[/C][C]-1.0665[/C][C]0.144319[/C][/ROW]
[ROW][C]42[/C][C]0.047965[/C][C]0.4915[/C][C]0.312051[/C][/ROW]
[ROW][C]43[/C][C]0.073983[/C][C]0.7581[/C][C]0.225044[/C][/ROW]
[ROW][C]44[/C][C]-0.014212[/C][C]-0.1456[/C][C]0.442246[/C][/ROW]
[ROW][C]45[/C][C]-0.026714[/C][C]-0.2737[/C][C]0.392413[/C][/ROW]
[ROW][C]46[/C][C]0.039019[/C][C]0.3998[/C][C]0.345048[/C][/ROW]
[ROW][C]47[/C][C]0.039718[/C][C]0.407[/C][C]0.342422[/C][/ROW]
[ROW][C]48[/C][C]0.006837[/C][C]0.0701[/C][C]0.472141[/C][/ROW]
[ROW][C]49[/C][C]-0.037901[/C][C]-0.3884[/C][C]0.349266[/C][/ROW]
[ROW][C]50[/C][C]0.04897[/C][C]0.5018[/C][C]0.308431[/C][/ROW]
[ROW][C]51[/C][C]-0.130615[/C][C]-1.3384[/C][C]0.091828[/C][/ROW]
[ROW][C]52[/C][C]0.03358[/C][C]0.3441[/C][C]0.365731[/C][/ROW]
[ROW][C]53[/C][C]0.010421[/C][C]0.1068[/C][C]0.457581[/C][/ROW]
[ROW][C]54[/C][C]-0.014796[/C][C]-0.1516[/C][C]0.43989[/C][/ROW]
[ROW][C]55[/C][C]0.000469[/C][C]0.0048[/C][C]0.498089[/C][/ROW]
[ROW][C]56[/C][C]-0.033561[/C][C]-0.3439[/C][C]0.365807[/C][/ROW]
[ROW][C]57[/C][C]0.140639[/C][C]1.4411[/C][C]0.076263[/C][/ROW]
[ROW][C]58[/C][C]-0.042328[/C][C]-0.4337[/C][C]0.332688[/C][/ROW]
[ROW][C]59[/C][C]-0.013796[/C][C]-0.1414[/C][C]0.443926[/C][/ROW]
[ROW][C]60[/C][C]-0.003187[/C][C]-0.0327[/C][C]0.487006[/C][/ROW]
[/TABLE]
Source: https://freestatistics.org/blog/index.php?pk=113736&T=2

Globally Unique Identifier (entire table): ba.freestatistics.org/blog/index.php?pk=113736&T=2

As an alternative you can also use a QR Code:  

The GUIDs for individual cells are displayed in the table below:

Partial Autocorrelation Function
Time lag kPACF(k)T-STATP-value
10.2786622.85540.00259
20.108811.1150.133703
30.0014210.01460.494205
4-0.016296-0.1670.433851
50.0038340.03930.48437
60.2664432.73020.003712
70.0869840.89130.187397
80.0359330.36820.356731
9-0.215225-2.20540.014803
10-0.138414-1.41830.079529
11-0.053146-0.54460.293597
12-0.369237-3.78360.000129
130.2776262.84480.002672
140.0213380.21860.413675
150.0730670.74870.227851
16-0.048982-0.50190.308389
170.0837710.85840.196314
180.0236170.2420.404625
19-0.046724-0.47880.316547
200.1355711.38920.083858
21-0.073484-0.7530.22657
22-0.043177-0.44240.329542
23-0.079011-0.80960.209993
24-0.194164-1.98960.024618
250.0950630.97410.166122
26-0.024861-0.25470.399709
27-0.092309-0.94590.173189
28-0.166977-1.7110.045017
290.0564350.57830.282154
300.0164420.16850.433266
310.0208620.21380.415571
32-0.082963-0.85010.198596
330.0656320.67250.251364
34-0.033599-0.34430.365659
35-0.007453-0.07640.469633
36-0.120501-1.23480.109836
37-0.050302-0.51540.303663
380.0028590.02930.488341
39-0.146701-1.50320.067889
40-0.003983-0.04080.483762
41-0.104081-1.06650.144319
420.0479650.49150.312051
430.0739830.75810.225044
44-0.014212-0.14560.442246
45-0.026714-0.27370.392413
460.0390190.39980.345048
470.0397180.4070.342422
480.0068370.07010.472141
49-0.037901-0.38840.349266
500.048970.50180.308431
51-0.130615-1.33840.091828
520.033580.34410.365731
530.0104210.10680.457581
54-0.014796-0.15160.43989
550.0004690.00480.498089
56-0.033561-0.34390.365807
570.1406391.44110.076263
58-0.042328-0.43370.332688
59-0.013796-0.14140.443926
60-0.003187-0.03270.487006


Parameters (Session):
par1 = 1 ; par2 = Do not include Seasonal Dummies ; par3 = No Linear Trend ;
Parameters (R input):
par1 = 60 ; par2 = 1 ; par3 = 1 ; par4 = 1 ; par5 = 12 ; par6 = White Noise ; par7 = 0.95 ; par8 = ;
R code (references can be found in the software module):
if (par1 == 'Default') {
par1 = 10*log10(length(x))
} else {
par1 <- as.numeric(par1)
}
par2 <- as.numeric(par2)
par3 <- as.numeric(par3)
par4 <- as.numeric(par4)
par5 <- as.numeric(par5)
if (par6 == 'White Noise') par6 <- 'white' else par6 <- 'ma'
par7 <- as.numeric(par7)
if (par8 != '') par8 <- as.numeric(par8)
ox <- x
if (par8 == '') {
if (par2 == 0) {
x <- log(x)
} else {
x <- (x ^ par2 - 1) / par2
}
} else {
x <- log(x,base=par8)
}
if (par3 > 0) x <- diff(x,lag=1,difference=par3)
if (par4 > 0) x <- diff(x,lag=par5,difference=par4)
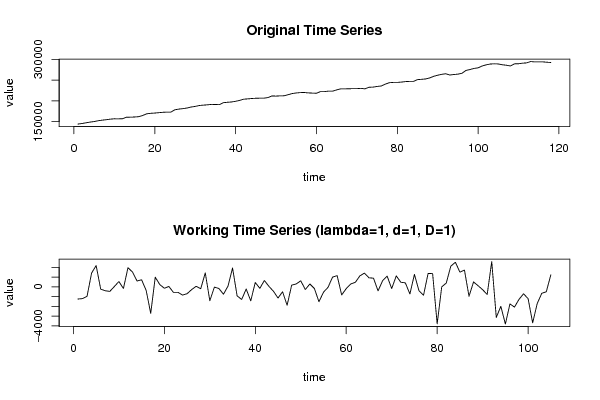
bitmap(file='picts.png')
op <- par(mfrow=c(2,1))
plot(ox,type='l',main='Original Time Series',xlab='time',ylab='value')
if (par8=='') {
mytitle <- paste('Working Time Series (lambda=',par2,', d=',par3,', D=',par4,')',sep='')
mysub <- paste('(lambda=',par2,', d=',par3,', D=',par4,', CI=', par7, ', CI type=',par6,')',sep='')
} else {
mytitle <- paste('Working Time Series (base=',par8,', d=',par3,', D=',par4,')',sep='')
mysub <- paste('(base=',par8,', d=',par3,', D=',par4,', CI=', par7, ', CI type=',par6,')',sep='')
}
plot(x,type='l', main=mytitle,xlab='time',ylab='value')
par(op)
dev.off()
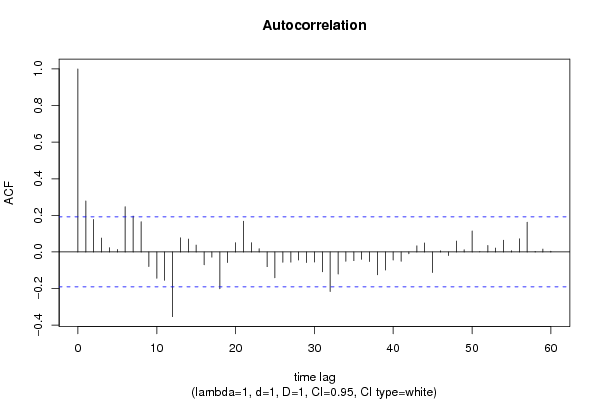
bitmap(file='pic1.png')
racf <- acf(x, par1, main='Autocorrelation', xlab='time lag', ylab='ACF', ci.type=par6, ci=par7, sub=mysub)
dev.off()
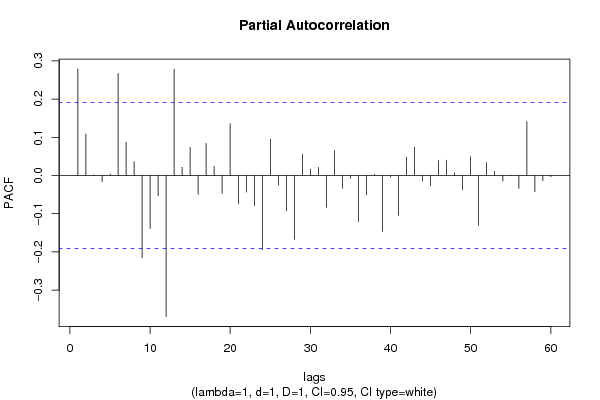
bitmap(file='pic2.png')
rpacf <- pacf(x,par1,main='Partial Autocorrelation',xlab='lags',ylab='PACF',sub=mysub)
dev.off()
(myacf <- c(racf$acf))
(mypacf <- c(rpacf$acf))
lengthx <- length(x)
sqrtn <- sqrt(lengthx)
load(file='createtable')
a<-table.start()
a<-table.row.start(a)
a<-table.element(a,'Autocorrelation Function',4,TRUE)
a<-table.row.end(a)
a<-table.row.start(a)
a<-table.element(a,'Time lag k',header=TRUE)
a<-table.element(a,hyperlink('basics.htm','ACF(k)','click here for more information about the Autocorrelation Function'),header=TRUE)
a<-table.element(a,'T-STAT',header=TRUE)
a<-table.element(a,'P-value',header=TRUE)
a<-table.row.end(a)
for (i in 2:(par1+1)) {
a<-table.row.start(a)
a<-table.element(a,i-1,header=TRUE)
a<-table.element(a,round(myacf[i],6))
mytstat <- myacf[i]*sqrtn
a<-table.element(a,round(mytstat,4))
a<-table.element(a,round(1-pt(abs(mytstat),lengthx),6))
a<-table.row.end(a)
}
a<-table.end(a)
table.save(a,file='mytable.tab')
a<-table.start()
a<-table.row.start(a)
a<-table.element(a,'Partial Autocorrelation Function',4,TRUE)
a<-table.row.end(a)
a<-table.row.start(a)
a<-table.element(a,'Time lag k',header=TRUE)
a<-table.element(a,hyperlink('basics.htm','PACF(k)','click here for more information about the Partial Autocorrelation Function'),header=TRUE)
a<-table.element(a,'T-STAT',header=TRUE)
a<-table.element(a,'P-value',header=TRUE)
a<-table.row.end(a)
for (i in 1:par1) {
a<-table.row.start(a)
a<-table.element(a,i,header=TRUE)
a<-table.element(a,round(mypacf[i],6))
mytstat <- mypacf[i]*sqrtn
a<-table.element(a,round(mytstat,4))
a<-table.element(a,round(1-pt(abs(mytstat),lengthx),6))
a<-table.row.end(a)
}
a<-table.end(a)
table.save(a,file='mytable1.tab')