Free Statistics

of Irreproducible Research!

Author's title

Author*The author of this computation has been verified*
R Software Modulerwasp_multipleregression.wasp
Title produced by softwareMultiple Regression
Date of computationTue, 21 Dec 2010 15:29:01 +0000
Cite this page as followsStatistical Computations at FreeStatistics.org, Office for Research Development and Education, URL https://freestatistics.org/blog/index.php?v=date/2010/Dec/21/t129294524594fbbik8c4o5ul4.htm/, Retrieved Fri, 17 May 2024 04:42:53 +0000
Statistical Computations at FreeStatistics.org, Office for Research Development and Education, URL https://freestatistics.org/blog/index.php?pk=113674, Retrieved Fri, 17 May 2024 04:42:53 +0000
QR Codes:

Original text written by user:
IsPrivate?No (this computation is public)
User-defined keywords
Estimated Impact92
Family? (F = Feedback message, R = changed R code, M = changed R Module, P = changed Parameters, D = changed Data)
-     [Multiple Regression] [HPC Retail Sales] [2008-03-08 13:40:54] [1c0f2c85e8a48e42648374b3bcceca26]
-  MPD    [Multiple Regression] [] [2010-12-21 15:29:01] [7b390cc0228d34e5578246b07143e3df] [Current]
Feedback Forum

Post a new message
Dataseries X:
3010
2910
3840
3580
3140
3550
3250
2820
2260
2060
2120
2210
2190
2180
2350
2440
2370
2440
2610
3040
3190
3120
3170
3600
3420
3650
4180
2960
2710
2950
3030
3770
4740
4450
5550
5580
5890
7480
10450
6360
6710
6200
4490
3480
2520
1920
2010
1950
2240
2370
2840
2700
2980
3290
3300
3000
2330
2190
1970
2170
2830
3190
3550
3240
3450
3570
3230
3260
2700


Summary of computational transaction
Raw Inputview raw input (R code)
Raw Outputview raw output of R engine
Computing time10 seconds
R Server'Gwilym Jenkins' @ 72.249.127.135

\begin{tabular}{lllllllll}
\hline
Summary of computational transaction \tabularnewline
Raw Input & view raw input (R code)  \tabularnewline
Raw Output & view raw output of R engine  \tabularnewline
Computing time & 10 seconds \tabularnewline
R Server & 'Gwilym Jenkins' @ 72.249.127.135 \tabularnewline
\hline
\end{tabular}
%Source: https://freestatistics.org/blog/index.php?pk=113674&T=0

[TABLE]
[ROW][C]Summary of computational transaction[/C][/ROW]
[ROW][C]Raw Input[/C][C]view raw input (R code) [/C][/ROW]
[ROW][C]Raw Output[/C][C]view raw output of R engine [/C][/ROW]
[ROW][C]Computing time[/C][C]10 seconds[/C][/ROW]
[ROW][C]R Server[/C][C]'Gwilym Jenkins' @ 72.249.127.135[/C][/ROW]
[/TABLE]
Source: https://freestatistics.org/blog/index.php?pk=113674&T=0

Globally Unique Identifier (entire table): ba.freestatistics.org/blog/index.php?pk=113674&T=0

As an alternative you can also use a QR Code:  

The GUIDs for individual cells are displayed in the table below:

Summary of computational transaction
Raw Inputview raw input (R code)
Raw Outputview raw output of R engine
Computing time10 seconds
R Server'Gwilym Jenkins' @ 72.249.127.135


Multiple Linear Regression - Estimated Regression Equation
Garnalen[t] = + 3102 + 161.333333333333M1[t] + 528.000000000001M2[t] + 1433.00000000000M3[t] + 444.666666666666M4[t] + 458M5[t] + 564.666666666667M6[t] + 216.333333333334M7[t] + 126.333333333334M8[t] -145.333333333333M9[t] -354M10[t] -138M11[t] + e[t]

\begin{tabular}{lllllllll}
\hline
Multiple Linear Regression - Estimated Regression Equation \tabularnewline
Garnalen[t] =  +  3102 +  161.333333333333M1[t] +  528.000000000001M2[t] +  1433.00000000000M3[t] +  444.666666666666M4[t] +  458M5[t] +  564.666666666667M6[t] +  216.333333333334M7[t] +  126.333333333334M8[t] -145.333333333333M9[t] -354M10[t] -138M11[t]  + e[t] \tabularnewline
\hline
\end{tabular}
%Source: https://freestatistics.org/blog/index.php?pk=113674&T=1

[TABLE]
[ROW][C]Multiple Linear Regression - Estimated Regression Equation[/C][/ROW]
[ROW][C]Garnalen[t] =  +  3102 +  161.333333333333M1[t] +  528.000000000001M2[t] +  1433.00000000000M3[t] +  444.666666666666M4[t] +  458M5[t] +  564.666666666667M6[t] +  216.333333333334M7[t] +  126.333333333334M8[t] -145.333333333333M9[t] -354M10[t] -138M11[t]  + e[t][/C][/ROW]
[/TABLE]
Source: https://freestatistics.org/blog/index.php?pk=113674&T=1

Globally Unique Identifier (entire table): ba.freestatistics.org/blog/index.php?pk=113674&T=1

As an alternative you can also use a QR Code:  

The GUIDs for individual cells are displayed in the table below:

Multiple Linear Regression - Estimated Regression Equation
Garnalen[t] = + 3102 + 161.333333333333M1[t] + 528.000000000001M2[t] + 1433.00000000000M3[t] + 444.666666666666M4[t] + 458M5[t] + 564.666666666667M6[t] + 216.333333333334M7[t] + 126.333333333334M8[t] -145.333333333333M9[t] -354M10[t] -138M11[t] + e[t]


Multiple Linear Regression - Ordinary Least Squares
VariableParameterS.D.T-STATH0: parameter = 02-tail p-value1-tail p-value
(Intercept)3102686.9054184.51593.2e-051.6e-05
M1161.333333333333930.0743320.17350.8629020.431451
M2528.000000000001930.0743320.56770.572470.286235
M31433.00000000000930.0743321.54070.1289140.064457
M4444.666666666666930.0743320.47810.6344090.317205
M5458930.0743320.49240.6243040.312152
M6564.666666666667930.0743320.60710.5461820.273091
M7216.333333333334930.0743320.23260.8169070.408453
M8126.333333333334930.0743320.13580.8924330.446217
M9-145.333333333333930.074332-0.15630.876380.43819
M10-354971.430958-0.36440.71690.35845
M11-138971.430958-0.14210.8875350.443767

\begin{tabular}{lllllllll}
\hline
Multiple Linear Regression - Ordinary Least Squares \tabularnewline
Variable & Parameter & S.D. & T-STATH0: parameter = 0 & 2-tail p-value & 1-tail p-value \tabularnewline
(Intercept) & 3102 & 686.905418 & 4.5159 & 3.2e-05 & 1.6e-05 \tabularnewline
M1 & 161.333333333333 & 930.074332 & 0.1735 & 0.862902 & 0.431451 \tabularnewline
M2 & 528.000000000001 & 930.074332 & 0.5677 & 0.57247 & 0.286235 \tabularnewline
M3 & 1433.00000000000 & 930.074332 & 1.5407 & 0.128914 & 0.064457 \tabularnewline
M4 & 444.666666666666 & 930.074332 & 0.4781 & 0.634409 & 0.317205 \tabularnewline
M5 & 458 & 930.074332 & 0.4924 & 0.624304 & 0.312152 \tabularnewline
M6 & 564.666666666667 & 930.074332 & 0.6071 & 0.546182 & 0.273091 \tabularnewline
M7 & 216.333333333334 & 930.074332 & 0.2326 & 0.816907 & 0.408453 \tabularnewline
M8 & 126.333333333334 & 930.074332 & 0.1358 & 0.892433 & 0.446217 \tabularnewline
M9 & -145.333333333333 & 930.074332 & -0.1563 & 0.87638 & 0.43819 \tabularnewline
M10 & -354 & 971.430958 & -0.3644 & 0.7169 & 0.35845 \tabularnewline
M11 & -138 & 971.430958 & -0.1421 & 0.887535 & 0.443767 \tabularnewline
\hline
\end{tabular}
%Source: https://freestatistics.org/blog/index.php?pk=113674&T=2

[TABLE]
[ROW][C]Multiple Linear Regression - Ordinary Least Squares[/C][/ROW]
[ROW][C]Variable[/C][C]Parameter[/C][C]S.D.[/C][C]T-STATH0: parameter = 0[/C][C]2-tail p-value[/C][C]1-tail p-value[/C][/ROW]
[ROW][C](Intercept)[/C][C]3102[/C][C]686.905418[/C][C]4.5159[/C][C]3.2e-05[/C][C]1.6e-05[/C][/ROW]
[ROW][C]M1[/C][C]161.333333333333[/C][C]930.074332[/C][C]0.1735[/C][C]0.862902[/C][C]0.431451[/C][/ROW]
[ROW][C]M2[/C][C]528.000000000001[/C][C]930.074332[/C][C]0.5677[/C][C]0.57247[/C][C]0.286235[/C][/ROW]
[ROW][C]M3[/C][C]1433.00000000000[/C][C]930.074332[/C][C]1.5407[/C][C]0.128914[/C][C]0.064457[/C][/ROW]
[ROW][C]M4[/C][C]444.666666666666[/C][C]930.074332[/C][C]0.4781[/C][C]0.634409[/C][C]0.317205[/C][/ROW]
[ROW][C]M5[/C][C]458[/C][C]930.074332[/C][C]0.4924[/C][C]0.624304[/C][C]0.312152[/C][/ROW]
[ROW][C]M6[/C][C]564.666666666667[/C][C]930.074332[/C][C]0.6071[/C][C]0.546182[/C][C]0.273091[/C][/ROW]
[ROW][C]M7[/C][C]216.333333333334[/C][C]930.074332[/C][C]0.2326[/C][C]0.816907[/C][C]0.408453[/C][/ROW]
[ROW][C]M8[/C][C]126.333333333334[/C][C]930.074332[/C][C]0.1358[/C][C]0.892433[/C][C]0.446217[/C][/ROW]
[ROW][C]M9[/C][C]-145.333333333333[/C][C]930.074332[/C][C]-0.1563[/C][C]0.87638[/C][C]0.43819[/C][/ROW]
[ROW][C]M10[/C][C]-354[/C][C]971.430958[/C][C]-0.3644[/C][C]0.7169[/C][C]0.35845[/C][/ROW]
[ROW][C]M11[/C][C]-138[/C][C]971.430958[/C][C]-0.1421[/C][C]0.887535[/C][C]0.443767[/C][/ROW]
[/TABLE]
Source: https://freestatistics.org/blog/index.php?pk=113674&T=2

Globally Unique Identifier (entire table): ba.freestatistics.org/blog/index.php?pk=113674&T=2

As an alternative you can also use a QR Code:  

The GUIDs for individual cells are displayed in the table below:

Multiple Linear Regression - Ordinary Least Squares
VariableParameterS.D.T-STATH0: parameter = 02-tail p-value1-tail p-value
(Intercept)3102686.9054184.51593.2e-051.6e-05
M1161.333333333333930.0743320.17350.8629020.431451
M2528.000000000001930.0743320.56770.572470.286235
M31433.00000000000930.0743321.54070.1289140.064457
M4444.666666666666930.0743320.47810.6344090.317205
M5458930.0743320.49240.6243040.312152
M6564.666666666667930.0743320.60710.5461820.273091
M7216.333333333334930.0743320.23260.8169070.408453
M8126.333333333334930.0743320.13580.8924330.446217
M9-145.333333333333930.074332-0.15630.876380.43819
M10-354971.430958-0.36440.71690.35845
M11-138971.430958-0.14210.8875350.443767


Multiple Linear Regression - Regression Statistics
Multiple R0.304904330702794
R-squared0.0929666508813186
Adjusted R-squared-0.0820748726328129
F-TEST (value)0.531111984259056
F-TEST (DF numerator)11
F-TEST (DF denominator)57
p-value0.874056566975166
Multiple Linear Regression - Residual Statistics
Residual Standard Deviation1535.96720770917
Sum Squared Residuals134474130

\begin{tabular}{lllllllll}
\hline
Multiple Linear Regression - Regression Statistics \tabularnewline
Multiple R & 0.304904330702794 \tabularnewline
R-squared & 0.0929666508813186 \tabularnewline
Adjusted R-squared & -0.0820748726328129 \tabularnewline
F-TEST (value) & 0.531111984259056 \tabularnewline
F-TEST (DF numerator) & 11 \tabularnewline
F-TEST (DF denominator) & 57 \tabularnewline
p-value & 0.874056566975166 \tabularnewline
Multiple Linear Regression - Residual Statistics \tabularnewline
Residual Standard Deviation & 1535.96720770917 \tabularnewline
Sum Squared Residuals & 134474130 \tabularnewline
\hline
\end{tabular}
%Source: https://freestatistics.org/blog/index.php?pk=113674&T=3

[TABLE]
[ROW][C]Multiple Linear Regression - Regression Statistics[/C][/ROW]
[ROW][C]Multiple R[/C][C]0.304904330702794[/C][/ROW]
[ROW][C]R-squared[/C][C]0.0929666508813186[/C][/ROW]
[ROW][C]Adjusted R-squared[/C][C]-0.0820748726328129[/C][/ROW]
[ROW][C]F-TEST (value)[/C][C]0.531111984259056[/C][/ROW]
[ROW][C]F-TEST (DF numerator)[/C][C]11[/C][/ROW]
[ROW][C]F-TEST (DF denominator)[/C][C]57[/C][/ROW]
[ROW][C]p-value[/C][C]0.874056566975166[/C][/ROW]
[ROW][C]Multiple Linear Regression - Residual Statistics[/C][/ROW]
[ROW][C]Residual Standard Deviation[/C][C]1535.96720770917[/C][/ROW]
[ROW][C]Sum Squared Residuals[/C][C]134474130[/C][/ROW]
[/TABLE]
Source: https://freestatistics.org/blog/index.php?pk=113674&T=3

Globally Unique Identifier (entire table): ba.freestatistics.org/blog/index.php?pk=113674&T=3

As an alternative you can also use a QR Code:  

The GUIDs for individual cells are displayed in the table below:

Multiple Linear Regression - Regression Statistics
Multiple R0.304904330702794
R-squared0.0929666508813186
Adjusted R-squared-0.0820748726328129
F-TEST (value)0.531111984259056
F-TEST (DF numerator)11
F-TEST (DF denominator)57
p-value0.874056566975166
Multiple Linear Regression - Residual Statistics
Residual Standard Deviation1535.96720770917
Sum Squared Residuals134474130


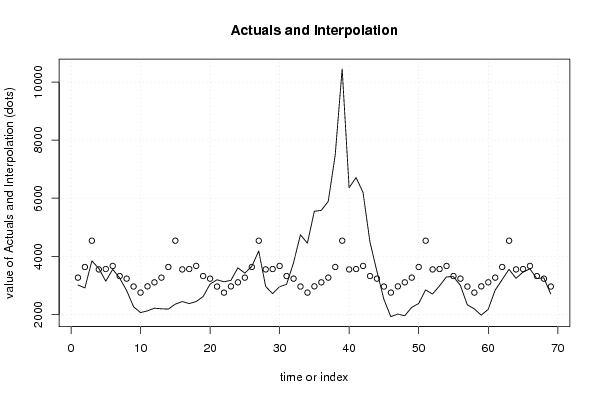
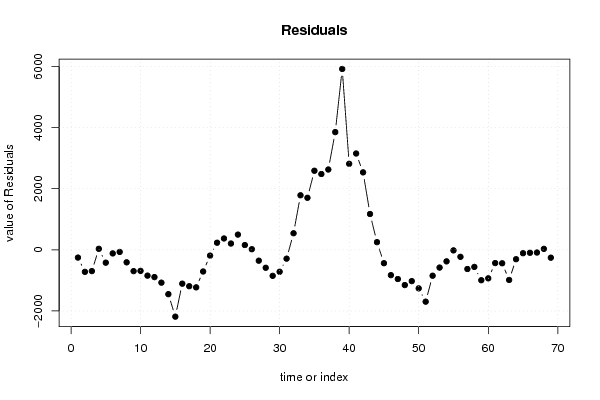
Multiple Linear Regression - Actuals, Interpolation, and Residuals
Time or IndexActualsInterpolationForecastResidualsPrediction Error
130103263.33333333333-253.333333333332
229103630-719.999999999999
338404535-695
435803546.6666666666733.333333333331
531403560-420
635503666.66666666667-116.666666666666
732503318.33333333333-68.333333333333
828203228.33333333333-408.333333333334
922602956.66666666667-696.666666666667
1020602748-688
1121202964-844
1222103102-892
1321903263.33333333333-1073.33333333333
1421803630-1450
1523504535-2185
1624403546.66666666667-1106.66666666667
1723703560-1190
1824403666.66666666667-1226.66666666667
1926103318.33333333333-708.333333333333
2030403228.33333333333-188.333333333333
2131902956.66666666667233.333333333333
2231202748372
2331702964206.000000000000
2436003102498
2534203263.33333333333156.666666666666
263650363019.9999999999999
2741804535-355
2829603546.66666666667-586.666666666666
2927103560-850
3029503666.66666666667-716.666666666667
3130303318.33333333333-288.333333333333
3237703228.33333333333541.666666666667
3347402956.666666666671783.33333333333
34445027481702
35555029642586
36558031022478
3758903263.333333333332626.66666666667
38748036303850
391045045355915
4063603546.666666666672813.33333333333
41671035603150
4262003666.666666666672533.33333333333
4344903318.333333333331171.66666666667
4434803228.33333333333251.666666666667
4525202956.66666666667-436.666666666667
4619202748-828
4720102964-954
4819503102-1152
4922403263.33333333333-1023.33333333333
5023703630-1260
5128404535-1695
5227003546.66666666667-846.666666666666
5329803560-580
5432903666.66666666667-376.666666666667
5533003318.33333333333-18.3333333333332
5630003228.33333333333-228.333333333333
5723302956.66666666667-626.666666666667
5821902748-558
5919702964-994
6021703102-932
6128303263.33333333333-433.333333333334
6231903630-440
6335504535-985
6432403546.66666666667-306.666666666666
6534503560-110.000000000000
6635703666.66666666667-96.6666666666667
6732303318.33333333333-88.3333333333332
6832603228.3333333333331.6666666666668
6927002956.66666666667-256.666666666667

\begin{tabular}{lllllllll}
\hline
Multiple Linear Regression - Actuals, Interpolation, and Residuals \tabularnewline
Time or Index & Actuals & InterpolationForecast & ResidualsPrediction Error \tabularnewline
1 & 3010 & 3263.33333333333 & -253.333333333332 \tabularnewline
2 & 2910 & 3630 & -719.999999999999 \tabularnewline
3 & 3840 & 4535 & -695 \tabularnewline
4 & 3580 & 3546.66666666667 & 33.333333333331 \tabularnewline
5 & 3140 & 3560 & -420 \tabularnewline
6 & 3550 & 3666.66666666667 & -116.666666666666 \tabularnewline
7 & 3250 & 3318.33333333333 & -68.333333333333 \tabularnewline
8 & 2820 & 3228.33333333333 & -408.333333333334 \tabularnewline
9 & 2260 & 2956.66666666667 & -696.666666666667 \tabularnewline
10 & 2060 & 2748 & -688 \tabularnewline
11 & 2120 & 2964 & -844 \tabularnewline
12 & 2210 & 3102 & -892 \tabularnewline
13 & 2190 & 3263.33333333333 & -1073.33333333333 \tabularnewline
14 & 2180 & 3630 & -1450 \tabularnewline
15 & 2350 & 4535 & -2185 \tabularnewline
16 & 2440 & 3546.66666666667 & -1106.66666666667 \tabularnewline
17 & 2370 & 3560 & -1190 \tabularnewline
18 & 2440 & 3666.66666666667 & -1226.66666666667 \tabularnewline
19 & 2610 & 3318.33333333333 & -708.333333333333 \tabularnewline
20 & 3040 & 3228.33333333333 & -188.333333333333 \tabularnewline
21 & 3190 & 2956.66666666667 & 233.333333333333 \tabularnewline
22 & 3120 & 2748 & 372 \tabularnewline
23 & 3170 & 2964 & 206.000000000000 \tabularnewline
24 & 3600 & 3102 & 498 \tabularnewline
25 & 3420 & 3263.33333333333 & 156.666666666666 \tabularnewline
26 & 3650 & 3630 & 19.9999999999999 \tabularnewline
27 & 4180 & 4535 & -355 \tabularnewline
28 & 2960 & 3546.66666666667 & -586.666666666666 \tabularnewline
29 & 2710 & 3560 & -850 \tabularnewline
30 & 2950 & 3666.66666666667 & -716.666666666667 \tabularnewline
31 & 3030 & 3318.33333333333 & -288.333333333333 \tabularnewline
32 & 3770 & 3228.33333333333 & 541.666666666667 \tabularnewline
33 & 4740 & 2956.66666666667 & 1783.33333333333 \tabularnewline
34 & 4450 & 2748 & 1702 \tabularnewline
35 & 5550 & 2964 & 2586 \tabularnewline
36 & 5580 & 3102 & 2478 \tabularnewline
37 & 5890 & 3263.33333333333 & 2626.66666666667 \tabularnewline
38 & 7480 & 3630 & 3850 \tabularnewline
39 & 10450 & 4535 & 5915 \tabularnewline
40 & 6360 & 3546.66666666667 & 2813.33333333333 \tabularnewline
41 & 6710 & 3560 & 3150 \tabularnewline
42 & 6200 & 3666.66666666667 & 2533.33333333333 \tabularnewline
43 & 4490 & 3318.33333333333 & 1171.66666666667 \tabularnewline
44 & 3480 & 3228.33333333333 & 251.666666666667 \tabularnewline
45 & 2520 & 2956.66666666667 & -436.666666666667 \tabularnewline
46 & 1920 & 2748 & -828 \tabularnewline
47 & 2010 & 2964 & -954 \tabularnewline
48 & 1950 & 3102 & -1152 \tabularnewline
49 & 2240 & 3263.33333333333 & -1023.33333333333 \tabularnewline
50 & 2370 & 3630 & -1260 \tabularnewline
51 & 2840 & 4535 & -1695 \tabularnewline
52 & 2700 & 3546.66666666667 & -846.666666666666 \tabularnewline
53 & 2980 & 3560 & -580 \tabularnewline
54 & 3290 & 3666.66666666667 & -376.666666666667 \tabularnewline
55 & 3300 & 3318.33333333333 & -18.3333333333332 \tabularnewline
56 & 3000 & 3228.33333333333 & -228.333333333333 \tabularnewline
57 & 2330 & 2956.66666666667 & -626.666666666667 \tabularnewline
58 & 2190 & 2748 & -558 \tabularnewline
59 & 1970 & 2964 & -994 \tabularnewline
60 & 2170 & 3102 & -932 \tabularnewline
61 & 2830 & 3263.33333333333 & -433.333333333334 \tabularnewline
62 & 3190 & 3630 & -440 \tabularnewline
63 & 3550 & 4535 & -985 \tabularnewline
64 & 3240 & 3546.66666666667 & -306.666666666666 \tabularnewline
65 & 3450 & 3560 & -110.000000000000 \tabularnewline
66 & 3570 & 3666.66666666667 & -96.6666666666667 \tabularnewline
67 & 3230 & 3318.33333333333 & -88.3333333333332 \tabularnewline
68 & 3260 & 3228.33333333333 & 31.6666666666668 \tabularnewline
69 & 2700 & 2956.66666666667 & -256.666666666667 \tabularnewline
\hline
\end{tabular}
%Source: https://freestatistics.org/blog/index.php?pk=113674&T=4

[TABLE]
[ROW][C]Multiple Linear Regression - Actuals, Interpolation, and Residuals[/C][/ROW]
[ROW][C]Time or Index[/C][C]Actuals[/C][C]InterpolationForecast[/C][C]ResidualsPrediction Error[/C][/ROW]
[ROW][C]1[/C][C]3010[/C][C]3263.33333333333[/C][C]-253.333333333332[/C][/ROW]
[ROW][C]2[/C][C]2910[/C][C]3630[/C][C]-719.999999999999[/C][/ROW]
[ROW][C]3[/C][C]3840[/C][C]4535[/C][C]-695[/C][/ROW]
[ROW][C]4[/C][C]3580[/C][C]3546.66666666667[/C][C]33.333333333331[/C][/ROW]
[ROW][C]5[/C][C]3140[/C][C]3560[/C][C]-420[/C][/ROW]
[ROW][C]6[/C][C]3550[/C][C]3666.66666666667[/C][C]-116.666666666666[/C][/ROW]
[ROW][C]7[/C][C]3250[/C][C]3318.33333333333[/C][C]-68.333333333333[/C][/ROW]
[ROW][C]8[/C][C]2820[/C][C]3228.33333333333[/C][C]-408.333333333334[/C][/ROW]
[ROW][C]9[/C][C]2260[/C][C]2956.66666666667[/C][C]-696.666666666667[/C][/ROW]
[ROW][C]10[/C][C]2060[/C][C]2748[/C][C]-688[/C][/ROW]
[ROW][C]11[/C][C]2120[/C][C]2964[/C][C]-844[/C][/ROW]
[ROW][C]12[/C][C]2210[/C][C]3102[/C][C]-892[/C][/ROW]
[ROW][C]13[/C][C]2190[/C][C]3263.33333333333[/C][C]-1073.33333333333[/C][/ROW]
[ROW][C]14[/C][C]2180[/C][C]3630[/C][C]-1450[/C][/ROW]
[ROW][C]15[/C][C]2350[/C][C]4535[/C][C]-2185[/C][/ROW]
[ROW][C]16[/C][C]2440[/C][C]3546.66666666667[/C][C]-1106.66666666667[/C][/ROW]
[ROW][C]17[/C][C]2370[/C][C]3560[/C][C]-1190[/C][/ROW]
[ROW][C]18[/C][C]2440[/C][C]3666.66666666667[/C][C]-1226.66666666667[/C][/ROW]
[ROW][C]19[/C][C]2610[/C][C]3318.33333333333[/C][C]-708.333333333333[/C][/ROW]
[ROW][C]20[/C][C]3040[/C][C]3228.33333333333[/C][C]-188.333333333333[/C][/ROW]
[ROW][C]21[/C][C]3190[/C][C]2956.66666666667[/C][C]233.333333333333[/C][/ROW]
[ROW][C]22[/C][C]3120[/C][C]2748[/C][C]372[/C][/ROW]
[ROW][C]23[/C][C]3170[/C][C]2964[/C][C]206.000000000000[/C][/ROW]
[ROW][C]24[/C][C]3600[/C][C]3102[/C][C]498[/C][/ROW]
[ROW][C]25[/C][C]3420[/C][C]3263.33333333333[/C][C]156.666666666666[/C][/ROW]
[ROW][C]26[/C][C]3650[/C][C]3630[/C][C]19.9999999999999[/C][/ROW]
[ROW][C]27[/C][C]4180[/C][C]4535[/C][C]-355[/C][/ROW]
[ROW][C]28[/C][C]2960[/C][C]3546.66666666667[/C][C]-586.666666666666[/C][/ROW]
[ROW][C]29[/C][C]2710[/C][C]3560[/C][C]-850[/C][/ROW]
[ROW][C]30[/C][C]2950[/C][C]3666.66666666667[/C][C]-716.666666666667[/C][/ROW]
[ROW][C]31[/C][C]3030[/C][C]3318.33333333333[/C][C]-288.333333333333[/C][/ROW]
[ROW][C]32[/C][C]3770[/C][C]3228.33333333333[/C][C]541.666666666667[/C][/ROW]
[ROW][C]33[/C][C]4740[/C][C]2956.66666666667[/C][C]1783.33333333333[/C][/ROW]
[ROW][C]34[/C][C]4450[/C][C]2748[/C][C]1702[/C][/ROW]
[ROW][C]35[/C][C]5550[/C][C]2964[/C][C]2586[/C][/ROW]
[ROW][C]36[/C][C]5580[/C][C]3102[/C][C]2478[/C][/ROW]
[ROW][C]37[/C][C]5890[/C][C]3263.33333333333[/C][C]2626.66666666667[/C][/ROW]
[ROW][C]38[/C][C]7480[/C][C]3630[/C][C]3850[/C][/ROW]
[ROW][C]39[/C][C]10450[/C][C]4535[/C][C]5915[/C][/ROW]
[ROW][C]40[/C][C]6360[/C][C]3546.66666666667[/C][C]2813.33333333333[/C][/ROW]
[ROW][C]41[/C][C]6710[/C][C]3560[/C][C]3150[/C][/ROW]
[ROW][C]42[/C][C]6200[/C][C]3666.66666666667[/C][C]2533.33333333333[/C][/ROW]
[ROW][C]43[/C][C]4490[/C][C]3318.33333333333[/C][C]1171.66666666667[/C][/ROW]
[ROW][C]44[/C][C]3480[/C][C]3228.33333333333[/C][C]251.666666666667[/C][/ROW]
[ROW][C]45[/C][C]2520[/C][C]2956.66666666667[/C][C]-436.666666666667[/C][/ROW]
[ROW][C]46[/C][C]1920[/C][C]2748[/C][C]-828[/C][/ROW]
[ROW][C]47[/C][C]2010[/C][C]2964[/C][C]-954[/C][/ROW]
[ROW][C]48[/C][C]1950[/C][C]3102[/C][C]-1152[/C][/ROW]
[ROW][C]49[/C][C]2240[/C][C]3263.33333333333[/C][C]-1023.33333333333[/C][/ROW]
[ROW][C]50[/C][C]2370[/C][C]3630[/C][C]-1260[/C][/ROW]
[ROW][C]51[/C][C]2840[/C][C]4535[/C][C]-1695[/C][/ROW]
[ROW][C]52[/C][C]2700[/C][C]3546.66666666667[/C][C]-846.666666666666[/C][/ROW]
[ROW][C]53[/C][C]2980[/C][C]3560[/C][C]-580[/C][/ROW]
[ROW][C]54[/C][C]3290[/C][C]3666.66666666667[/C][C]-376.666666666667[/C][/ROW]
[ROW][C]55[/C][C]3300[/C][C]3318.33333333333[/C][C]-18.3333333333332[/C][/ROW]
[ROW][C]56[/C][C]3000[/C][C]3228.33333333333[/C][C]-228.333333333333[/C][/ROW]
[ROW][C]57[/C][C]2330[/C][C]2956.66666666667[/C][C]-626.666666666667[/C][/ROW]
[ROW][C]58[/C][C]2190[/C][C]2748[/C][C]-558[/C][/ROW]
[ROW][C]59[/C][C]1970[/C][C]2964[/C][C]-994[/C][/ROW]
[ROW][C]60[/C][C]2170[/C][C]3102[/C][C]-932[/C][/ROW]
[ROW][C]61[/C][C]2830[/C][C]3263.33333333333[/C][C]-433.333333333334[/C][/ROW]
[ROW][C]62[/C][C]3190[/C][C]3630[/C][C]-440[/C][/ROW]
[ROW][C]63[/C][C]3550[/C][C]4535[/C][C]-985[/C][/ROW]
[ROW][C]64[/C][C]3240[/C][C]3546.66666666667[/C][C]-306.666666666666[/C][/ROW]
[ROW][C]65[/C][C]3450[/C][C]3560[/C][C]-110.000000000000[/C][/ROW]
[ROW][C]66[/C][C]3570[/C][C]3666.66666666667[/C][C]-96.6666666666667[/C][/ROW]
[ROW][C]67[/C][C]3230[/C][C]3318.33333333333[/C][C]-88.3333333333332[/C][/ROW]
[ROW][C]68[/C][C]3260[/C][C]3228.33333333333[/C][C]31.6666666666668[/C][/ROW]
[ROW][C]69[/C][C]2700[/C][C]2956.66666666667[/C][C]-256.666666666667[/C][/ROW]
[/TABLE]
Source: https://freestatistics.org/blog/index.php?pk=113674&T=4

Globally Unique Identifier (entire table): ba.freestatistics.org/blog/index.php?pk=113674&T=4

As an alternative you can also use a QR Code:  

The GUIDs for individual cells are displayed in the table below:

Multiple Linear Regression - Actuals, Interpolation, and Residuals
Time or IndexActualsInterpolationForecastResidualsPrediction Error
130103263.33333333333-253.333333333332
229103630-719.999999999999
338404535-695
435803546.6666666666733.333333333331
531403560-420
635503666.66666666667-116.666666666666
732503318.33333333333-68.333333333333
828203228.33333333333-408.333333333334
922602956.66666666667-696.666666666667
1020602748-688
1121202964-844
1222103102-892
1321903263.33333333333-1073.33333333333
1421803630-1450
1523504535-2185
1624403546.66666666667-1106.66666666667
1723703560-1190
1824403666.66666666667-1226.66666666667
1926103318.33333333333-708.333333333333
2030403228.33333333333-188.333333333333
2131902956.66666666667233.333333333333
2231202748372
2331702964206.000000000000
2436003102498
2534203263.33333333333156.666666666666
263650363019.9999999999999
2741804535-355
2829603546.66666666667-586.666666666666
2927103560-850
3029503666.66666666667-716.666666666667
3130303318.33333333333-288.333333333333
3237703228.33333333333541.666666666667
3347402956.666666666671783.33333333333
34445027481702
35555029642586
36558031022478
3758903263.333333333332626.66666666667
38748036303850
391045045355915
4063603546.666666666672813.33333333333
41671035603150
4262003666.666666666672533.33333333333
4344903318.333333333331171.66666666667
4434803228.33333333333251.666666666667
4525202956.66666666667-436.666666666667
4619202748-828
4720102964-954
4819503102-1152
4922403263.33333333333-1023.33333333333
5023703630-1260
5128404535-1695
5227003546.66666666667-846.666666666666
5329803560-580
5432903666.66666666667-376.666666666667
5533003318.33333333333-18.3333333333332
5630003228.33333333333-228.333333333333
5723302956.66666666667-626.666666666667
5821902748-558
5919702964-994
6021703102-932
6128303263.33333333333-433.333333333334
6231903630-440
6335504535-985
6432403546.66666666667-306.666666666666
6534503560-110.000000000000
6635703666.66666666667-96.6666666666667
6732303318.33333333333-88.3333333333332
6832603228.3333333333331.6666666666668
6927002956.66666666667-256.666666666667


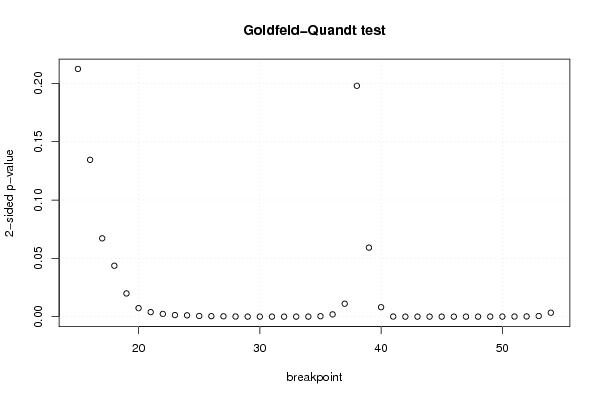
Goldfeld-Quandt test for Heteroskedasticity
p-valuesAlternative Hypothesis
breakpoint indexgreater2-sidedless
150.1061701505332320.2123403010664640.893829849466768
160.06721708601647410.1344341720329480.932782913983526
170.03357157715469410.06714315430938820.966428422845306
180.02182096301566060.04364192603132120.97817903698434
190.00995073571924190.01990147143848380.990049264280758
200.003669108820494930.007338217640989860.996330891179505
210.001952734642086840.003905469284173690.998047265357913
220.001169761782867770.002339523565735550.998830238217132
230.0006831370742049050.001366274148409810.999316862925795
240.0005677253225036420.001135450645007280.999432274677496
250.0002952007999175450.0005904015998350910.999704799200082
260.0002082010935246200.0004164021870492410.999791798906475
270.0001497832600012230.0002995665200024450.999850216739999
285.59996729415587e-050.0001119993458831170.999944000327058
292.17278885222635e-054.34557770445271e-050.999978272111478
307.87689177179518e-061.57537835435904e-050.999992123108228
312.5477086634943e-065.0954173269886e-060.999997452291337
321.26146726199123e-062.52293452398245e-060.999998738532738
335.64143185876742e-061.12828637175348e-050.99999435856814
341.33016038686965e-052.66032077373929e-050.999986698396131
350.0001909661611788370.0003819323223576750.999809033838821
360.0009834910842082960.001966982168416590.999016508915792
370.005535586928558450.01107117385711690.994464413071442
380.09894544470931920.1978908894186380.901054555290681
390.9704041003243270.05919179935134520.0295958996756726
400.9959525934822850.008094813035429080.00404740651771454
410.9999546649978849.06700042326692e-054.53350021163346e-05
420.9999999691992476.16015055246975e-083.08007527623488e-08
430.9999999968939076.21218563017334e-093.10609281508667e-09
440.9999999867349532.65300938295595e-081.32650469147797e-08
450.999999918775161.62449678629251e-078.12248393146255e-08
460.999999608695287.82609441062796e-073.91304720531398e-07
470.9999979186212924.16275741672268e-062.08137870836134e-06
480.9999904730068451.90539863104926e-059.5269931552463e-06
490.9999743905122965.12189754082503e-052.56094877041252e-05
500.9999684364702246.31270595521697e-053.15635297760849e-05
510.9999580903981688.3819203664554e-054.1909601832277e-05
520.9999007127904170.0001985744191658149.92872095829069e-05
530.99973065217820.0005386956435999510.000269347821799975
540.998320316526680.00335936694663890.00167968347331945

\begin{tabular}{lllllllll}
\hline
Goldfeld-Quandt test for Heteroskedasticity \tabularnewline
p-values & Alternative Hypothesis \tabularnewline
breakpoint index & greater & 2-sided & less \tabularnewline
15 & 0.106170150533232 & 0.212340301066464 & 0.893829849466768 \tabularnewline
16 & 0.0672170860164741 & 0.134434172032948 & 0.932782913983526 \tabularnewline
17 & 0.0335715771546941 & 0.0671431543093882 & 0.966428422845306 \tabularnewline
18 & 0.0218209630156606 & 0.0436419260313212 & 0.97817903698434 \tabularnewline
19 & 0.0099507357192419 & 0.0199014714384838 & 0.990049264280758 \tabularnewline
20 & 0.00366910882049493 & 0.00733821764098986 & 0.996330891179505 \tabularnewline
21 & 0.00195273464208684 & 0.00390546928417369 & 0.998047265357913 \tabularnewline
22 & 0.00116976178286777 & 0.00233952356573555 & 0.998830238217132 \tabularnewline
23 & 0.000683137074204905 & 0.00136627414840981 & 0.999316862925795 \tabularnewline
24 & 0.000567725322503642 & 0.00113545064500728 & 0.999432274677496 \tabularnewline
25 & 0.000295200799917545 & 0.000590401599835091 & 0.999704799200082 \tabularnewline
26 & 0.000208201093524620 & 0.000416402187049241 & 0.999791798906475 \tabularnewline
27 & 0.000149783260001223 & 0.000299566520002445 & 0.999850216739999 \tabularnewline
28 & 5.59996729415587e-05 & 0.000111999345883117 & 0.999944000327058 \tabularnewline
29 & 2.17278885222635e-05 & 4.34557770445271e-05 & 0.999978272111478 \tabularnewline
30 & 7.87689177179518e-06 & 1.57537835435904e-05 & 0.999992123108228 \tabularnewline
31 & 2.5477086634943e-06 & 5.0954173269886e-06 & 0.999997452291337 \tabularnewline
32 & 1.26146726199123e-06 & 2.52293452398245e-06 & 0.999998738532738 \tabularnewline
33 & 5.64143185876742e-06 & 1.12828637175348e-05 & 0.99999435856814 \tabularnewline
34 & 1.33016038686965e-05 & 2.66032077373929e-05 & 0.999986698396131 \tabularnewline
35 & 0.000190966161178837 & 0.000381932322357675 & 0.999809033838821 \tabularnewline
36 & 0.000983491084208296 & 0.00196698216841659 & 0.999016508915792 \tabularnewline
37 & 0.00553558692855845 & 0.0110711738571169 & 0.994464413071442 \tabularnewline
38 & 0.0989454447093192 & 0.197890889418638 & 0.901054555290681 \tabularnewline
39 & 0.970404100324327 & 0.0591917993513452 & 0.0295958996756726 \tabularnewline
40 & 0.995952593482285 & 0.00809481303542908 & 0.00404740651771454 \tabularnewline
41 & 0.999954664997884 & 9.06700042326692e-05 & 4.53350021163346e-05 \tabularnewline
42 & 0.999999969199247 & 6.16015055246975e-08 & 3.08007527623488e-08 \tabularnewline
43 & 0.999999996893907 & 6.21218563017334e-09 & 3.10609281508667e-09 \tabularnewline
44 & 0.999999986734953 & 2.65300938295595e-08 & 1.32650469147797e-08 \tabularnewline
45 & 0.99999991877516 & 1.62449678629251e-07 & 8.12248393146255e-08 \tabularnewline
46 & 0.99999960869528 & 7.82609441062796e-07 & 3.91304720531398e-07 \tabularnewline
47 & 0.999997918621292 & 4.16275741672268e-06 & 2.08137870836134e-06 \tabularnewline
48 & 0.999990473006845 & 1.90539863104926e-05 & 9.5269931552463e-06 \tabularnewline
49 & 0.999974390512296 & 5.12189754082503e-05 & 2.56094877041252e-05 \tabularnewline
50 & 0.999968436470224 & 6.31270595521697e-05 & 3.15635297760849e-05 \tabularnewline
51 & 0.999958090398168 & 8.3819203664554e-05 & 4.1909601832277e-05 \tabularnewline
52 & 0.999900712790417 & 0.000198574419165814 & 9.92872095829069e-05 \tabularnewline
53 & 0.9997306521782 & 0.000538695643599951 & 0.000269347821799975 \tabularnewline
54 & 0.99832031652668 & 0.0033593669466389 & 0.00167968347331945 \tabularnewline
\hline
\end{tabular}
%Source: https://freestatistics.org/blog/index.php?pk=113674&T=5

[TABLE]
[ROW][C]Goldfeld-Quandt test for Heteroskedasticity[/C][/ROW]
[ROW][C]p-values[/C][C]Alternative Hypothesis[/C][/ROW]
[ROW][C]breakpoint index[/C][C]greater[/C][C]2-sided[/C][C]less[/C][/ROW]
[ROW][C]15[/C][C]0.106170150533232[/C][C]0.212340301066464[/C][C]0.893829849466768[/C][/ROW]
[ROW][C]16[/C][C]0.0672170860164741[/C][C]0.134434172032948[/C][C]0.932782913983526[/C][/ROW]
[ROW][C]17[/C][C]0.0335715771546941[/C][C]0.0671431543093882[/C][C]0.966428422845306[/C][/ROW]
[ROW][C]18[/C][C]0.0218209630156606[/C][C]0.0436419260313212[/C][C]0.97817903698434[/C][/ROW]
[ROW][C]19[/C][C]0.0099507357192419[/C][C]0.0199014714384838[/C][C]0.990049264280758[/C][/ROW]
[ROW][C]20[/C][C]0.00366910882049493[/C][C]0.00733821764098986[/C][C]0.996330891179505[/C][/ROW]
[ROW][C]21[/C][C]0.00195273464208684[/C][C]0.00390546928417369[/C][C]0.998047265357913[/C][/ROW]
[ROW][C]22[/C][C]0.00116976178286777[/C][C]0.00233952356573555[/C][C]0.998830238217132[/C][/ROW]
[ROW][C]23[/C][C]0.000683137074204905[/C][C]0.00136627414840981[/C][C]0.999316862925795[/C][/ROW]
[ROW][C]24[/C][C]0.000567725322503642[/C][C]0.00113545064500728[/C][C]0.999432274677496[/C][/ROW]
[ROW][C]25[/C][C]0.000295200799917545[/C][C]0.000590401599835091[/C][C]0.999704799200082[/C][/ROW]
[ROW][C]26[/C][C]0.000208201093524620[/C][C]0.000416402187049241[/C][C]0.999791798906475[/C][/ROW]
[ROW][C]27[/C][C]0.000149783260001223[/C][C]0.000299566520002445[/C][C]0.999850216739999[/C][/ROW]
[ROW][C]28[/C][C]5.59996729415587e-05[/C][C]0.000111999345883117[/C][C]0.999944000327058[/C][/ROW]
[ROW][C]29[/C][C]2.17278885222635e-05[/C][C]4.34557770445271e-05[/C][C]0.999978272111478[/C][/ROW]
[ROW][C]30[/C][C]7.87689177179518e-06[/C][C]1.57537835435904e-05[/C][C]0.999992123108228[/C][/ROW]
[ROW][C]31[/C][C]2.5477086634943e-06[/C][C]5.0954173269886e-06[/C][C]0.999997452291337[/C][/ROW]
[ROW][C]32[/C][C]1.26146726199123e-06[/C][C]2.52293452398245e-06[/C][C]0.999998738532738[/C][/ROW]
[ROW][C]33[/C][C]5.64143185876742e-06[/C][C]1.12828637175348e-05[/C][C]0.99999435856814[/C][/ROW]
[ROW][C]34[/C][C]1.33016038686965e-05[/C][C]2.66032077373929e-05[/C][C]0.999986698396131[/C][/ROW]
[ROW][C]35[/C][C]0.000190966161178837[/C][C]0.000381932322357675[/C][C]0.999809033838821[/C][/ROW]
[ROW][C]36[/C][C]0.000983491084208296[/C][C]0.00196698216841659[/C][C]0.999016508915792[/C][/ROW]
[ROW][C]37[/C][C]0.00553558692855845[/C][C]0.0110711738571169[/C][C]0.994464413071442[/C][/ROW]
[ROW][C]38[/C][C]0.0989454447093192[/C][C]0.197890889418638[/C][C]0.901054555290681[/C][/ROW]
[ROW][C]39[/C][C]0.970404100324327[/C][C]0.0591917993513452[/C][C]0.0295958996756726[/C][/ROW]
[ROW][C]40[/C][C]0.995952593482285[/C][C]0.00809481303542908[/C][C]0.00404740651771454[/C][/ROW]
[ROW][C]41[/C][C]0.999954664997884[/C][C]9.06700042326692e-05[/C][C]4.53350021163346e-05[/C][/ROW]
[ROW][C]42[/C][C]0.999999969199247[/C][C]6.16015055246975e-08[/C][C]3.08007527623488e-08[/C][/ROW]
[ROW][C]43[/C][C]0.999999996893907[/C][C]6.21218563017334e-09[/C][C]3.10609281508667e-09[/C][/ROW]
[ROW][C]44[/C][C]0.999999986734953[/C][C]2.65300938295595e-08[/C][C]1.32650469147797e-08[/C][/ROW]
[ROW][C]45[/C][C]0.99999991877516[/C][C]1.62449678629251e-07[/C][C]8.12248393146255e-08[/C][/ROW]
[ROW][C]46[/C][C]0.99999960869528[/C][C]7.82609441062796e-07[/C][C]3.91304720531398e-07[/C][/ROW]
[ROW][C]47[/C][C]0.999997918621292[/C][C]4.16275741672268e-06[/C][C]2.08137870836134e-06[/C][/ROW]
[ROW][C]48[/C][C]0.999990473006845[/C][C]1.90539863104926e-05[/C][C]9.5269931552463e-06[/C][/ROW]
[ROW][C]49[/C][C]0.999974390512296[/C][C]5.12189754082503e-05[/C][C]2.56094877041252e-05[/C][/ROW]
[ROW][C]50[/C][C]0.999968436470224[/C][C]6.31270595521697e-05[/C][C]3.15635297760849e-05[/C][/ROW]
[ROW][C]51[/C][C]0.999958090398168[/C][C]8.3819203664554e-05[/C][C]4.1909601832277e-05[/C][/ROW]
[ROW][C]52[/C][C]0.999900712790417[/C][C]0.000198574419165814[/C][C]9.92872095829069e-05[/C][/ROW]
[ROW][C]53[/C][C]0.9997306521782[/C][C]0.000538695643599951[/C][C]0.000269347821799975[/C][/ROW]
[ROW][C]54[/C][C]0.99832031652668[/C][C]0.0033593669466389[/C][C]0.00167968347331945[/C][/ROW]
[/TABLE]
Source: https://freestatistics.org/blog/index.php?pk=113674&T=5

Globally Unique Identifier (entire table): ba.freestatistics.org/blog/index.php?pk=113674&T=5

As an alternative you can also use a QR Code:  

The GUIDs for individual cells are displayed in the table below:

Goldfeld-Quandt test for Heteroskedasticity
p-valuesAlternative Hypothesis
breakpoint indexgreater2-sidedless
150.1061701505332320.2123403010664640.893829849466768
160.06721708601647410.1344341720329480.932782913983526
170.03357157715469410.06714315430938820.966428422845306
180.02182096301566060.04364192603132120.97817903698434
190.00995073571924190.01990147143848380.990049264280758
200.003669108820494930.007338217640989860.996330891179505
210.001952734642086840.003905469284173690.998047265357913
220.001169761782867770.002339523565735550.998830238217132
230.0006831370742049050.001366274148409810.999316862925795
240.0005677253225036420.001135450645007280.999432274677496
250.0002952007999175450.0005904015998350910.999704799200082
260.0002082010935246200.0004164021870492410.999791798906475
270.0001497832600012230.0002995665200024450.999850216739999
285.59996729415587e-050.0001119993458831170.999944000327058
292.17278885222635e-054.34557770445271e-050.999978272111478
307.87689177179518e-061.57537835435904e-050.999992123108228
312.5477086634943e-065.0954173269886e-060.999997452291337
321.26146726199123e-062.52293452398245e-060.999998738532738
335.64143185876742e-061.12828637175348e-050.99999435856814
341.33016038686965e-052.66032077373929e-050.999986698396131
350.0001909661611788370.0003819323223576750.999809033838821
360.0009834910842082960.001966982168416590.999016508915792
370.005535586928558450.01107117385711690.994464413071442
380.09894544470931920.1978908894186380.901054555290681
390.9704041003243270.05919179935134520.0295958996756726
400.9959525934822850.008094813035429080.00404740651771454
410.9999546649978849.06700042326692e-054.53350021163346e-05
420.9999999691992476.16015055246975e-083.08007527623488e-08
430.9999999968939076.21218563017334e-093.10609281508667e-09
440.9999999867349532.65300938295595e-081.32650469147797e-08
450.999999918775161.62449678629251e-078.12248393146255e-08
460.999999608695287.82609441062796e-073.91304720531398e-07
470.9999979186212924.16275741672268e-062.08137870836134e-06
480.9999904730068451.90539863104926e-059.5269931552463e-06
490.9999743905122965.12189754082503e-052.56094877041252e-05
500.9999684364702246.31270595521697e-053.15635297760849e-05
510.9999580903981688.3819203664554e-054.1909601832277e-05
520.9999007127904170.0001985744191658149.92872095829069e-05
530.99973065217820.0005386956435999510.000269347821799975
540.998320316526680.00335936694663890.00167968347331945


Meta Analysis of Goldfeld-Quandt test for Heteroskedasticity
Description# significant tests% significant testsOK/NOK
1% type I error level320.8NOK
5% type I error level350.875NOK
10% type I error level370.925NOK

\begin{tabular}{lllllllll}
\hline
Meta Analysis of Goldfeld-Quandt test for Heteroskedasticity \tabularnewline
Description & # significant tests & % significant tests & OK/NOK \tabularnewline
1% type I error level & 32 & 0.8 & NOK \tabularnewline
5% type I error level & 35 & 0.875 & NOK \tabularnewline
10% type I error level & 37 & 0.925 & NOK \tabularnewline
\hline
\end{tabular}
%Source: https://freestatistics.org/blog/index.php?pk=113674&T=6

[TABLE]
[ROW][C]Meta Analysis of Goldfeld-Quandt test for Heteroskedasticity[/C][/ROW]
[ROW][C]Description[/C][C]# significant tests[/C][C]% significant tests[/C][C]OK/NOK[/C][/ROW]
[ROW][C]1% type I error level[/C][C]32[/C][C]0.8[/C][C]NOK[/C][/ROW]
[ROW][C]5% type I error level[/C][C]35[/C][C]0.875[/C][C]NOK[/C][/ROW]
[ROW][C]10% type I error level[/C][C]37[/C][C]0.925[/C][C]NOK[/C][/ROW]
[/TABLE]
Source: https://freestatistics.org/blog/index.php?pk=113674&T=6

Globally Unique Identifier (entire table): ba.freestatistics.org/blog/index.php?pk=113674&T=6

As an alternative you can also use a QR Code:  

The GUIDs for individual cells are displayed in the table below:

Meta Analysis of Goldfeld-Quandt test for Heteroskedasticity
Description# significant tests% significant testsOK/NOK
1% type I error level320.8NOK
5% type I error level350.875NOK
10% type I error level370.925NOK


Parameters (Session):
par1 = 1 ; par2 = Include Monthly Dummies ; par3 = No Linear Trend ;
Parameters (R input):
par1 = 1 ; par2 = Include Monthly Dummies ; par3 = No Linear Trend ;
R code (references can be found in the software module):
library(lattice)
library(lmtest)
n25 <- 25 #minimum number of obs. for Goldfeld-Quandt test
par1 <- as.numeric(par1)
x <- t(y)
k <- length(x[1,])
n <- length(x[,1])
x1 <- cbind(x[,par1], x[,1:k!=par1])
mycolnames <- c(colnames(x)[par1], colnames(x)[1:k!=par1])
colnames(x1) <- mycolnames #colnames(x)[par1]
x <- x1
if (par3 == 'First Differences'){
x2 <- array(0, dim=c(n-1,k), dimnames=list(1:(n-1), paste('(1-B)',colnames(x),sep='')))
for (i in 1:n-1) {
for (j in 1:k) {
x2[i,j] <- x[i+1,j] - x[i,j]
}
}
x <- x2
}
if (par2 == 'Include Monthly Dummies'){
x2 <- array(0, dim=c(n,11), dimnames=list(1:n, paste('M', seq(1:11), sep ='')))
for (i in 1:11){
x2[seq(i,n,12),i] <- 1
}
x <- cbind(x, x2)
}
if (par2 == 'Include Quarterly Dummies'){
x2 <- array(0, dim=c(n,3), dimnames=list(1:n, paste('Q', seq(1:3), sep ='')))
for (i in 1:3){
x2[seq(i,n,4),i] <- 1
}
x <- cbind(x, x2)
}
k <- length(x[1,])
if (par3 == 'Linear Trend'){
x <- cbind(x, c(1:n))
colnames(x)[k+1] <- 't'
}
x
k <- length(x[1,])
df <- as.data.frame(x)
(mylm <- lm(df))
(mysum <- summary(mylm))
if (n > n25) {
kp3 <- k + 3
nmkm3 <- n - k - 3
gqarr <- array(NA, dim=c(nmkm3-kp3+1,3))
numgqtests <- 0
numsignificant1 <- 0
numsignificant5 <- 0
numsignificant10 <- 0
for (mypoint in kp3:nmkm3) {
j <- 0
numgqtests <- numgqtests + 1
for (myalt in c('greater', 'two.sided', 'less')) {
j <- j + 1
gqarr[mypoint-kp3+1,j] <- gqtest(mylm, point=mypoint, alternative=myalt)$p.value
}
if (gqarr[mypoint-kp3+1,2] < 0.01) numsignificant1 <- numsignificant1 + 1
if (gqarr[mypoint-kp3+1,2] < 0.05) numsignificant5 <- numsignificant5 + 1
if (gqarr[mypoint-kp3+1,2] < 0.10) numsignificant10 <- numsignificant10 + 1
}
gqarr
}
bitmap(file='test0.png')
plot(x[,1], type='l', main='Actuals and Interpolation', ylab='value of Actuals and Interpolation (dots)', xlab='time or index')
points(x[,1]-mysum$resid)
grid()
dev.off()
bitmap(file='test1.png')
plot(mysum$resid, type='b', pch=19, main='Residuals', ylab='value of Residuals', xlab='time or index')
grid()
dev.off()
bitmap(file='test2.png')
hist(mysum$resid, main='Residual Histogram', xlab='values of Residuals')
grid()
dev.off()
bitmap(file='test3.png')
densityplot(~mysum$resid,col='black',main='Residual Density Plot', xlab='values of Residuals')
dev.off()
bitmap(file='test4.png')
qqnorm(mysum$resid, main='Residual Normal Q-Q Plot')
qqline(mysum$resid)
grid()
dev.off()
(myerror <- as.ts(mysum$resid))
bitmap(file='test5.png')
dum <- cbind(lag(myerror,k=1),myerror)
dum
dum1 <- dum[2:length(myerror),]
dum1
z <- as.data.frame(dum1)
z
plot(z,main=paste('Residual Lag plot, lowess, and regression line'), ylab='values of Residuals', xlab='lagged values of Residuals')
lines(lowess(z))
abline(lm(z))
grid()
dev.off()
bitmap(file='test6.png')
acf(mysum$resid, lag.max=length(mysum$resid)/2, main='Residual Autocorrelation Function')
grid()
dev.off()
bitmap(file='test7.png')
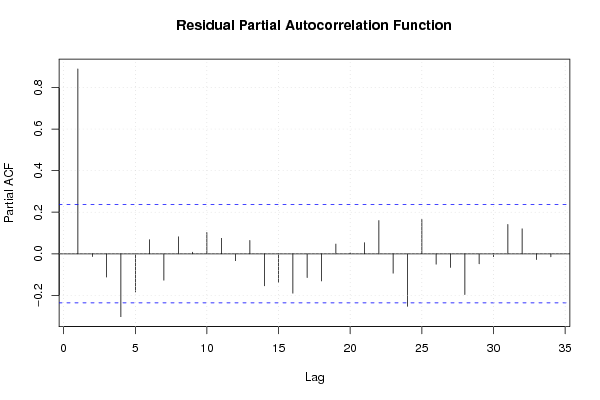
pacf(mysum$resid, lag.max=length(mysum$resid)/2, main='Residual Partial Autocorrelation Function')
grid()
dev.off()
bitmap(file='test8.png')
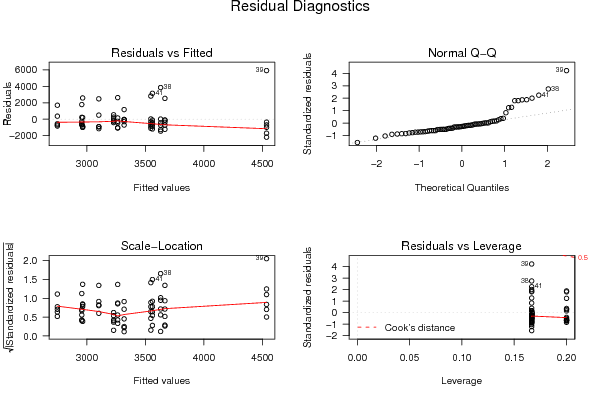
opar <- par(mfrow = c(2,2), oma = c(0, 0, 1.1, 0))
plot(mylm, las = 1, sub='Residual Diagnostics')
par(opar)
dev.off()
if (n > n25) {
bitmap(file='test9.png')
plot(kp3:nmkm3,gqarr[,2], main='Goldfeld-Quandt test',ylab='2-sided p-value',xlab='breakpoint')
grid()
dev.off()
}
load(file='createtable')
a<-table.start()
a<-table.row.start(a)
a<-table.element(a, 'Multiple Linear Regression - Estimated Regression Equation', 1, TRUE)
a<-table.row.end(a)
myeq <- colnames(x)[1]
myeq <- paste(myeq, '[t] = ', sep='')
for (i in 1:k){
if (mysum$coefficients[i,1] > 0) myeq <- paste(myeq, '+', '')
myeq <- paste(myeq, mysum$coefficients[i,1], sep=' ')
if (rownames(mysum$coefficients)[i] != '(Intercept)') {
myeq <- paste(myeq, rownames(mysum$coefficients)[i], sep='')
if (rownames(mysum$coefficients)[i] != 't') myeq <- paste(myeq, '[t]', sep='')
}
}
myeq <- paste(myeq, ' + e[t]')
a<-table.row.start(a)
a<-table.element(a, myeq)
a<-table.row.end(a)
a<-table.end(a)
table.save(a,file='mytable1.tab')
a<-table.start()
a<-table.row.start(a)
a<-table.element(a,hyperlink('ols1.htm','Multiple Linear Regression - Ordinary Least Squares',''), 6, TRUE)
a<-table.row.end(a)
a<-table.row.start(a)
a<-table.element(a,'Variable',header=TRUE)
a<-table.element(a,'Parameter',header=TRUE)
a<-table.element(a,'S.D.',header=TRUE)
a<-table.element(a,'T-STAT
H0: parameter = 0',header=TRUE)
a<-table.element(a,'2-tail p-value',header=TRUE)
a<-table.element(a,'1-tail p-value',header=TRUE)
a<-table.row.end(a)
for (i in 1:k){
a<-table.row.start(a)
a<-table.element(a,rownames(mysum$coefficients)[i],header=TRUE)
a<-table.element(a,mysum$coefficients[i,1])
a<-table.element(a, round(mysum$coefficients[i,2],6))
a<-table.element(a, round(mysum$coefficients[i,3],4))
a<-table.element(a, round(mysum$coefficients[i,4],6))
a<-table.element(a, round(mysum$coefficients[i,4]/2,6))
a<-table.row.end(a)
}
a<-table.end(a)
table.save(a,file='mytable2.tab')
a<-table.start()
a<-table.row.start(a)
a<-table.element(a, 'Multiple Linear Regression - Regression Statistics', 2, TRUE)
a<-table.row.end(a)
a<-table.row.start(a)
a<-table.element(a, 'Multiple R',1,TRUE)
a<-table.element(a, sqrt(mysum$r.squared))
a<-table.row.end(a)
a<-table.row.start(a)
a<-table.element(a, 'R-squared',1,TRUE)
a<-table.element(a, mysum$r.squared)
a<-table.row.end(a)
a<-table.row.start(a)
a<-table.element(a, 'Adjusted R-squared',1,TRUE)
a<-table.element(a, mysum$adj.r.squared)
a<-table.row.end(a)
a<-table.row.start(a)
a<-table.element(a, 'F-TEST (value)',1,TRUE)
a<-table.element(a, mysum$fstatistic[1])
a<-table.row.end(a)
a<-table.row.start(a)
a<-table.element(a, 'F-TEST (DF numerator)',1,TRUE)
a<-table.element(a, mysum$fstatistic[2])
a<-table.row.end(a)
a<-table.row.start(a)
a<-table.element(a, 'F-TEST (DF denominator)',1,TRUE)
a<-table.element(a, mysum$fstatistic[3])
a<-table.row.end(a)
a<-table.row.start(a)
a<-table.element(a, 'p-value',1,TRUE)
a<-table.element(a, 1-pf(mysum$fstatistic[1],mysum$fstatistic[2],mysum$fstatistic[3]))
a<-table.row.end(a)
a<-table.row.start(a)
a<-table.element(a, 'Multiple Linear Regression - Residual Statistics', 2, TRUE)
a<-table.row.end(a)
a<-table.row.start(a)
a<-table.element(a, 'Residual Standard Deviation',1,TRUE)
a<-table.element(a, mysum$sigma)
a<-table.row.end(a)
a<-table.row.start(a)
a<-table.element(a, 'Sum Squared Residuals',1,TRUE)
a<-table.element(a, sum(myerror*myerror))
a<-table.row.end(a)
a<-table.end(a)
table.save(a,file='mytable3.tab')
a<-table.start()
a<-table.row.start(a)
a<-table.element(a, 'Multiple Linear Regression - Actuals, Interpolation, and Residuals', 4, TRUE)
a<-table.row.end(a)
a<-table.row.start(a)
a<-table.element(a, 'Time or Index', 1, TRUE)
a<-table.element(a, 'Actuals', 1, TRUE)
a<-table.element(a, 'Interpolation
Forecast', 1, TRUE)
a<-table.element(a, 'Residuals
Prediction Error', 1, TRUE)
a<-table.row.end(a)
for (i in 1:n) {
a<-table.row.start(a)
a<-table.element(a,i, 1, TRUE)
a<-table.element(a,x[i])
a<-table.element(a,x[i]-mysum$resid[i])
a<-table.element(a,mysum$resid[i])
a<-table.row.end(a)
}
a<-table.end(a)
table.save(a,file='mytable4.tab')
if (n > n25) {
a<-table.start()
a<-table.row.start(a)
a<-table.element(a,'Goldfeld-Quandt test for Heteroskedasticity',4,TRUE)
a<-table.row.end(a)
a<-table.row.start(a)
a<-table.element(a,'p-values',header=TRUE)
a<-table.element(a,'Alternative Hypothesis',3,header=TRUE)
a<-table.row.end(a)
a<-table.row.start(a)
a<-table.element(a,'breakpoint index',header=TRUE)
a<-table.element(a,'greater',header=TRUE)
a<-table.element(a,'2-sided',header=TRUE)
a<-table.element(a,'less',header=TRUE)
a<-table.row.end(a)
for (mypoint in kp3:nmkm3) {
a<-table.row.start(a)
a<-table.element(a,mypoint,header=TRUE)
a<-table.element(a,gqarr[mypoint-kp3+1,1])
a<-table.element(a,gqarr[mypoint-kp3+1,2])
a<-table.element(a,gqarr[mypoint-kp3+1,3])
a<-table.row.end(a)
}
a<-table.end(a)
table.save(a,file='mytable5.tab')
a<-table.start()
a<-table.row.start(a)
a<-table.element(a,'Meta Analysis of Goldfeld-Quandt test for Heteroskedasticity',4,TRUE)
a<-table.row.end(a)
a<-table.row.start(a)
a<-table.element(a,'Description',header=TRUE)
a<-table.element(a,'# significant tests',header=TRUE)
a<-table.element(a,'% significant tests',header=TRUE)
a<-table.element(a,'OK/NOK',header=TRUE)
a<-table.row.end(a)
a<-table.row.start(a)
a<-table.element(a,'1% type I error level',header=TRUE)
a<-table.element(a,numsignificant1)
a<-table.element(a,numsignificant1/numgqtests)
if (numsignificant1/numgqtests < 0.01) dum <- 'OK' else dum <- 'NOK'
a<-table.element(a,dum)
a<-table.row.end(a)
a<-table.row.start(a)
a<-table.element(a,'5% type I error level',header=TRUE)
a<-table.element(a,numsignificant5)
a<-table.element(a,numsignificant5/numgqtests)
if (numsignificant5/numgqtests < 0.05) dum <- 'OK' else dum <- 'NOK'
a<-table.element(a,dum)
a<-table.row.end(a)
a<-table.row.start(a)
a<-table.element(a,'10% type I error level',header=TRUE)
a<-table.element(a,numsignificant10)
a<-table.element(a,numsignificant10/numgqtests)
if (numsignificant10/numgqtests < 0.1) dum <- 'OK' else dum <- 'NOK'
a<-table.element(a,dum)
a<-table.row.end(a)
a<-table.end(a)
table.save(a,file='mytable6.tab')
}