| Multiple Linear Regression - Estimated Regression Equation |
| wealth [t] = -289294.338884457 + 15.765558710734costs[t] + 3132.12605876057orders[t] + 3.41235292761755dividends[t] + e[t] |
| Multiple Linear Regression - Ordinary Least Squares | |||||
| Variable | Parameter | S.D. | T-STAT H0: parameter = 0 | 2-tail p-value | 1-tail p-value |
| (Intercept) | -289294.338884457 | 218626.454153 | -1.3232 | 0.192297 | 0.096148 |
| costs | 15.765558710734 | 6.746793 | 2.3367 | 0.023862 | 0.011931 |
| orders | 3132.12605876057 | 1263.927035 | 2.4781 | 0.01694 | 0.00847 |
| dividends | 3.41235292761755 | 1.427373 | 2.3907 | 0.020968 | 0.010484 |
| Multiple Linear Regression - Regression Statistics | |
| Multiple R | 0.814831228336522 |
| R-squared | 0.663949930672405 |
| Adjusted R-squared | 0.642033621803214 |
| F-TEST (value) | 30.2947879880337 |
| F-TEST (DF numerator) | 3 |
| F-TEST (DF denominator) | 46 |
| p-value | 5.79654102494942e-11 |
| Multiple Linear Regression - Residual Statistics | |
| Residual Standard Deviation | 665289.84892443 |
| Sum Squared Residuals | 20360086821767 |
| Multiple Linear Regression - Actuals, Interpolation, and Residuals | |||
| Time or Index | Actuals | Interpolation Forecast | Residuals Prediction Error |
| 1 | 6282154 | 5528351.3835454 | 753802.616454605 |
| 2 | 4321023 | 1850043.48703051 | 2470979.51296949 |
| 3 | 4111912 | 2904181.90625481 | 1207730.09374519 |
| 4 | 223193 | 2298452.46570670 | -2075259.46570670 |
| 5 | 1491348 | 1992241.71409147 | -500893.71409147 |
| 6 | 1629616 | 1445521.32222322 | 184094.677776783 |
| 7 | 1398893 | 1621433.35410860 | -222540.354108605 |
| 8 | 1926517 | 2060660.09767092 | -134143.097670922 |
| 9 | 983660 | 1225524.93791109 | -241864.937911093 |
| 10 | 1443586 | 534506.283005668 | 909079.716994332 |
| 11 | 1073089 | 1281560.76468968 | -208471.764689679 |
| 12 | 984885 | 456577.746761923 | 528307.253238077 |
| 13 | 1405225 | 1219796.85331738 | 185428.146682616 |
| 14 | 227132 | 1103900.78586564 | -876768.785865639 |
| 15 | 929118 | 1304228.08638886 | -375110.086388857 |
| 16 | 1071292 | 528154.591641306 | 543137.408358694 |
| 17 | 638830 | 1125818.33695723 | -486988.336957228 |
| 18 | 856956 | 1276931.27707271 | -419975.277072713 |
| 19 | 992426 | 1165634.44802285 | -173208.448022846 |
| 20 | 444477 | 1278449.68421646 | -833972.684216462 |
| 21 | 857217 | 425087.080000106 | 432129.919999894 |
| 22 | 711969 | 544912.209039999 | 167056.790960001 |
| 23 | 702380 | 808314.683008352 | -105934.683008352 |
| 24 | 358589 | 1271394.13125202 | -912805.131252022 |
| 25 | 297978 | 540683.6447223 | -242705.6447223 |
| 26 | 585715 | 353416.707638038 | 232298.292361962 |
| 27 | 657954 | 1141938.64731639 | -483984.647316388 |
| 28 | 209458 | 233332.252227367 | -23874.2522273671 |
| 29 | 786690 | 62045.8231225722 | 724644.176877428 |
| 30 | 439798 | 543477.157569432 | -103679.157569432 |
| 31 | 688779 | 142679.199463853 | 546099.800536147 |
| 32 | 574339 | 478382.629839228 | 95956.3701607715 |
| 33 | 741409 | 221030.640879877 | 520378.359120123 |
| 34 | 597793 | 261999.707541946 | 335793.292458054 |
| 35 | 644190 | 812695.221832884 | -168505.221832884 |
| 36 | 377934 | 1013352.62538600 | -635418.625386002 |
| 37 | 640273 | 407549.899539154 | 232723.100460846 |
| 38 | 697458 | 429211.987336504 | 268246.012663496 |
| 39 | 550608 | 662371.890096194 | -111763.890096194 |
| 40 | 207393 | 457483.646242745 | -250090.646242745 |
| 41 | 301607 | 920463.022565603 | -618856.022565603 |
| 42 | 345783 | 431491.269962841 | -85708.2699628407 |
| 43 | 501749 | 380920.274004035 | 120828.725995965 |
| 44 | 379983 | 495646.093124119 | -115663.093124119 |
| 45 | 387475 | 141816.499241584 | 245658.500758416 |
| 46 | 377305 | 194518.1878765 | 182786.8121235 |
| 47 | 370837 | 659821.516911582 | -288984.516911582 |
| 48 | 430866 | 762939.414727448 | -332073.414727448 |
| 49 | 469107 | 385670.044700094 | 83436.9552999055 |
| 50 | 194493 | 135845.366348806 | 58647.633651194 |
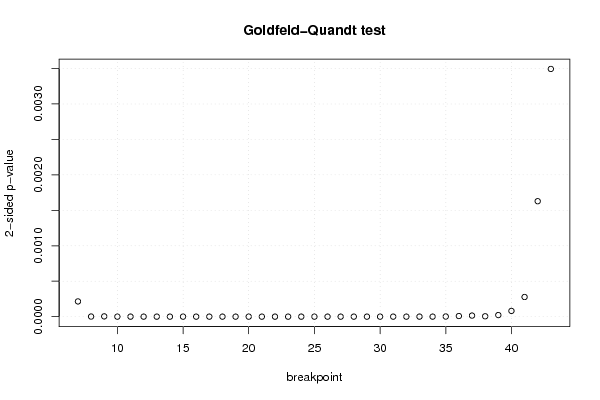
| Goldfeld-Quandt test for Heteroskedasticity | |||
| p-values | Alternative Hypothesis | ||
| breakpoint index | greater | 2-sided | less |
| 7 | 0.999892548816968 | 0.000214902366063994 | 0.000107451183031997 |
| 8 | 0.999999262338462 | 1.47532307560704e-06 | 7.37661537803519e-07 |
| 9 | 0.999997919201577 | 4.16159684558364e-06 | 2.08079842279182e-06 |
| 10 | 0.999999981651937 | 3.66961251508855e-08 | 1.83480625754428e-08 |
| 11 | 0.999999980653149 | 3.86937028312172e-08 | 1.93468514156086e-08 |
| 12 | 0.99999998232264 | 3.53547217667679e-08 | 1.76773608833840e-08 |
| 13 | 0.999999999859575 | 2.80849614782837e-10 | 1.40424807391418e-10 |
| 14 | 0.999999999990038 | 1.99230623435424e-11 | 9.9615311717712e-12 |
| 15 | 0.999999999995776 | 8.44840946101723e-12 | 4.22420473050861e-12 |
| 16 | 0.99999999999955 | 8.97956655539194e-13 | 4.48978327769597e-13 |
| 17 | 0.9999999999997 | 6.01054469167839e-13 | 3.00527234583919e-13 |
| 18 | 0.999999999999839 | 3.22642173661611e-13 | 1.61321086830805e-13 |
| 19 | 0.99999999999952 | 9.6226720985326e-13 | 4.8113360492663e-13 |
| 20 | 0.999999999999441 | 1.11732441216481e-12 | 5.58662206082403e-13 |
| 21 | 0.999999999999532 | 9.35175383564155e-13 | 4.67587691782077e-13 |
| 22 | 0.999999999997807 | 4.38618377581493e-12 | 2.19309188790746e-12 |
| 23 | 0.999999999990964 | 1.80711660581779e-11 | 9.03558302908897e-12 |
| 24 | 0.999999999981653 | 3.66935159608415e-11 | 1.83467579804207e-11 |
| 25 | 0.99999999994219 | 1.15619721469750e-10 | 5.78098607348752e-11 |
| 26 | 0.999999999732404 | 5.35191559120733e-10 | 2.67595779560366e-10 |
| 27 | 0.999999999309747 | 1.38050620334204e-09 | 6.90253101671021e-10 |
| 28 | 0.99999999922798 | 1.54404084132423e-09 | 7.72020420662115e-10 |
| 29 | 0.999999999096654 | 1.80669234488757e-09 | 9.03346172443785e-10 |
| 30 | 0.999999994899249 | 1.02015026411145e-08 | 5.10075132055723e-09 |
| 31 | 0.999999988735357 | 2.25292864254602e-08 | 1.12646432127301e-08 |
| 32 | 0.999999942681987 | 1.14636026414715e-07 | 5.73180132073575e-08 |
| 33 | 0.999999941292763 | 1.17414473943641e-07 | 5.87072369718203e-08 |
| 34 | 0.999999822964808 | 3.54070384046758e-07 | 1.77035192023379e-07 |
| 35 | 0.999999042261578 | 1.91547684332016e-06 | 9.5773842166008e-07 |
| 36 | 0.999995618327432 | 8.76334513620044e-06 | 4.38167256810022e-06 |
| 37 | 0.999992433348578 | 1.51333028432779e-05 | 7.56665142163897e-06 |
| 38 | 0.999997391108212 | 5.21778357694502e-06 | 2.60889178847251e-06 |
| 39 | 0.999988931047503 | 2.21379049934618e-05 | 1.10689524967309e-05 |
| 40 | 0.999959445206658 | 8.1109586682929e-05 | 4.05547933414645e-05 |
| 41 | 0.999861355711629 | 0.000277288576742345 | 0.000138644288371172 |
| 42 | 0.999185739292564 | 0.00162852141487181 | 0.000814260707435903 |
| 43 | 0.998252978249915 | 0.00349404350017069 | 0.00174702175008535 |
| Meta Analysis of Goldfeld-Quandt test for Heteroskedasticity | |||
| Description | # significant tests | % significant tests | OK/NOK |
| 1% type I error level | 37 | 1 | NOK |
| 5% type I error level | 37 | 1 | NOK |
| 10% type I error level | 37 | 1 | NOK |