Free Statistics

of Irreproducible Research!

Author's title

Author*The author of this computation has been verified*
R Software Modulerwasp_multipleregression.wasp
Title produced by softwareMultiple Regression
Date of computationWed, 01 Dec 2010 14:26:43 +0000
Cite this page as followsStatistical Computations at FreeStatistics.org, Office for Research Development and Education, URL https://freestatistics.org/blog/index.php?v=date/2010/Dec/01/t1291213548lh54hx16tqilrje.htm/, Retrieved Sun, 05 May 2024 13:07:54 +0000
Statistical Computations at FreeStatistics.org, Office for Research Development and Education, URL https://freestatistics.org/blog/index.php?pk=104029, Retrieved Sun, 05 May 2024 13:07:54 +0000
QR Codes:

Original text written by user:
IsPrivate?No (this computation is public)
User-defined keywordsLinear Trend
Estimated Impact161
Family? (F = Feedback message, R = changed R code, M = changed R Module, P = changed Parameters, D = changed Data)
-     [Multiple Regression] [] [2009-11-24 11:23:58] [f57b281e621ed7dff28b90886f5aa97c]
-    D  [Multiple Regression] [Multiple Linear R...] [2010-12-01 09:52:46] [0ed8ad64bdfc801eaa95d5097964fc04]
-   P     [Multiple Regression] [Multiple Linear R...] [2010-12-01 14:01:44] [0ed8ad64bdfc801eaa95d5097964fc04]
-   P         [Multiple Regression] [Multiple Linear R...] [2010-12-01 14:26:43] [19046f4a6967f3fb6f5f17d42e7d38f2] [Current]
Feedback Forum

Post a new message
Dataseries X:
94.6	116.1
95.9	107.5
104.7	116.7
102.8	112.5
98.1	113
113.9	126.4
80.9	114.1
95.7	112.5
113.2	112.4
105.9	113.1
108.8	116.3
102.3	111.7
99	118.8
100.7	116.5
115.5	125.1
100.7	113.1
109.9	119.6
114.6	114.4
85.4	114
100.5	117.8
114.8	117
116.5	120.9
112.9	115
102	117.3
106	119.4
105.3	114.9
118.8	125.8
106.1	117.6
109.3	117.6
117.2	114.9
92.5	121.9
104.2	117
112.5	106.4
122.4	110.5
113.3	113.6
100	114.2
110.7	125.4
112.8	124.6
109.8	120.2
117.3	120.8
109.1	111.4
115.9	124.1
96	120.2
99.8	125.5
116.8	116
115.7	117
99.4	105.7
94.3	102
91	106.4
93.2	96.9
103.1	107.6
94.1	98.8
91.8	101.1
102.7	105.7
82.6	104.6
89.1	103.2
104.5	101.6
105.1	106.7
95.1	99.5
88.7	101


Summary of computational transaction
Raw Inputview raw input (R code)
Raw Outputview raw output of R engine
Computing time7 seconds
R Server'George Udny Yule' @ 72.249.76.132

\begin{tabular}{lllllllll}
\hline
Summary of computational transaction \tabularnewline
Raw Input & view raw input (R code)  \tabularnewline
Raw Output & view raw output of R engine  \tabularnewline
Computing time & 7 seconds \tabularnewline
R Server & 'George Udny Yule' @ 72.249.76.132 \tabularnewline
\hline
\end{tabular}
%Source: https://freestatistics.org/blog/index.php?pk=104029&T=0

[TABLE]
[ROW][C]Summary of computational transaction[/C][/ROW]
[ROW][C]Raw Input[/C][C]view raw input (R code) [/C][/ROW]
[ROW][C]Raw Output[/C][C]view raw output of R engine [/C][/ROW]
[ROW][C]Computing time[/C][C]7 seconds[/C][/ROW]
[ROW][C]R Server[/C][C]'George Udny Yule' @ 72.249.76.132[/C][/ROW]
[/TABLE]
Source: https://freestatistics.org/blog/index.php?pk=104029&T=0

Globally Unique Identifier (entire table): ba.freestatistics.org/blog/index.php?pk=104029&T=0

As an alternative you can also use a QR Code:  

The GUIDs for individual cells are displayed in the table below:

Summary of computational transaction
Raw Inputview raw input (R code)
Raw Outputview raw output of R engine
Computing time7 seconds
R Server'George Udny Yule' @ 72.249.76.132


Multiple Linear Regression - Estimated Regression Equation
I.P.C.N.[t] = + 35.3607050481266 + 0.80254709385946T.I.P.[t] + 4.40769055462786M1[t] -1.67120091994249M2[t] -1.61314465658158M3[t] -3.05293292720597M4[t] -2.50303586532052M5[t] -5.22204938138058M6[t] + 13.1270665500966M7[t] + 5.15709840515961M8[t] -10.8793637664784M9[t] -8.40882886848744M10[t] -6.11396816149799M11[t] -0.120470689324152t + e[t]

\begin{tabular}{lllllllll}
\hline
Multiple Linear Regression - Estimated Regression Equation \tabularnewline
I.P.C.N.[t] =  +  35.3607050481266 +  0.80254709385946T.I.P.[t] +  4.40769055462786M1[t] -1.67120091994249M2[t] -1.61314465658158M3[t] -3.05293292720597M4[t] -2.50303586532052M5[t] -5.22204938138058M6[t] +  13.1270665500966M7[t] +  5.15709840515961M8[t] -10.8793637664784M9[t] -8.40882886848744M10[t] -6.11396816149799M11[t] -0.120470689324152t  + e[t] \tabularnewline
\hline
\end{tabular}
%Source: https://freestatistics.org/blog/index.php?pk=104029&T=1

[TABLE]
[ROW][C]Multiple Linear Regression - Estimated Regression Equation[/C][/ROW]
[ROW][C]I.P.C.N.[t] =  +  35.3607050481266 +  0.80254709385946T.I.P.[t] +  4.40769055462786M1[t] -1.67120091994249M2[t] -1.61314465658158M3[t] -3.05293292720597M4[t] -2.50303586532052M5[t] -5.22204938138058M6[t] +  13.1270665500966M7[t] +  5.15709840515961M8[t] -10.8793637664784M9[t] -8.40882886848744M10[t] -6.11396816149799M11[t] -0.120470689324152t  + e[t][/C][/ROW]
[/TABLE]
Source: https://freestatistics.org/blog/index.php?pk=104029&T=1

Globally Unique Identifier (entire table): ba.freestatistics.org/blog/index.php?pk=104029&T=1

As an alternative you can also use a QR Code:  

The GUIDs for individual cells are displayed in the table below:

Multiple Linear Regression - Estimated Regression Equation
I.P.C.N.[t] = + 35.3607050481266 + 0.80254709385946T.I.P.[t] + 4.40769055462786M1[t] -1.67120091994249M2[t] -1.61314465658158M3[t] -3.05293292720597M4[t] -2.50303586532052M5[t] -5.22204938138058M6[t] + 13.1270665500966M7[t] + 5.15709840515961M8[t] -10.8793637664784M9[t] -8.40882886848744M10[t] -6.11396816149799M11[t] -0.120470689324152t + e[t]


Multiple Linear Regression - Ordinary Least Squares
VariableParameterS.D.T-STATH0: parameter = 02-tail p-value1-tail p-value
(Intercept)35.36070504812668.4395464.18990.0001256.3e-05
T.I.P.0.802547093859460.08149.859300
M14.407690554627862.4792981.77780.0820480.041024
M2-1.671200919942492.48515-0.67250.5046460.252323
M3-1.613144656581582.657938-0.60690.5468910.273445
M4-3.052932927205972.513266-1.21470.2306690.115334
M5-2.503035865320522.503426-0.99980.3226170.161308
M6-5.222049381380582.74159-1.90480.0630760.031538
M713.12706655009662.6000695.04877e-064e-06
M85.157098405159612.456262.09960.0412810.020641
M9-10.87936376647842.72884-3.98680.0002370.000119
M10-8.408828868487442.758882-3.04790.0038120.001906
M11-6.113968161497992.546047-2.40140.0204330.010216
t-0.1204706893241520.030364-3.96750.0002520.000126

\begin{tabular}{lllllllll}
\hline
Multiple Linear Regression - Ordinary Least Squares \tabularnewline
Variable & Parameter & S.D. & T-STATH0: parameter = 0 & 2-tail p-value & 1-tail p-value \tabularnewline
(Intercept) & 35.3607050481266 & 8.439546 & 4.1899 & 0.000125 & 6.3e-05 \tabularnewline
T.I.P. & 0.80254709385946 & 0.0814 & 9.8593 & 0 & 0 \tabularnewline
M1 & 4.40769055462786 & 2.479298 & 1.7778 & 0.082048 & 0.041024 \tabularnewline
M2 & -1.67120091994249 & 2.48515 & -0.6725 & 0.504646 & 0.252323 \tabularnewline
M3 & -1.61314465658158 & 2.657938 & -0.6069 & 0.546891 & 0.273445 \tabularnewline
M4 & -3.05293292720597 & 2.513266 & -1.2147 & 0.230669 & 0.115334 \tabularnewline
M5 & -2.50303586532052 & 2.503426 & -0.9998 & 0.322617 & 0.161308 \tabularnewline
M6 & -5.22204938138058 & 2.74159 & -1.9048 & 0.063076 & 0.031538 \tabularnewline
M7 & 13.1270665500966 & 2.600069 & 5.0487 & 7e-06 & 4e-06 \tabularnewline
M8 & 5.15709840515961 & 2.45626 & 2.0996 & 0.041281 & 0.020641 \tabularnewline
M9 & -10.8793637664784 & 2.72884 & -3.9868 & 0.000237 & 0.000119 \tabularnewline
M10 & -8.40882886848744 & 2.758882 & -3.0479 & 0.003812 & 0.001906 \tabularnewline
M11 & -6.11396816149799 & 2.546047 & -2.4014 & 0.020433 & 0.010216 \tabularnewline
t & -0.120470689324152 & 0.030364 & -3.9675 & 0.000252 & 0.000126 \tabularnewline
\hline
\end{tabular}
%Source: https://freestatistics.org/blog/index.php?pk=104029&T=2

[TABLE]
[ROW][C]Multiple Linear Regression - Ordinary Least Squares[/C][/ROW]
[ROW][C]Variable[/C][C]Parameter[/C][C]S.D.[/C][C]T-STATH0: parameter = 0[/C][C]2-tail p-value[/C][C]1-tail p-value[/C][/ROW]
[ROW][C](Intercept)[/C][C]35.3607050481266[/C][C]8.439546[/C][C]4.1899[/C][C]0.000125[/C][C]6.3e-05[/C][/ROW]
[ROW][C]T.I.P.[/C][C]0.80254709385946[/C][C]0.0814[/C][C]9.8593[/C][C]0[/C][C]0[/C][/ROW]
[ROW][C]M1[/C][C]4.40769055462786[/C][C]2.479298[/C][C]1.7778[/C][C]0.082048[/C][C]0.041024[/C][/ROW]
[ROW][C]M2[/C][C]-1.67120091994249[/C][C]2.48515[/C][C]-0.6725[/C][C]0.504646[/C][C]0.252323[/C][/ROW]
[ROW][C]M3[/C][C]-1.61314465658158[/C][C]2.657938[/C][C]-0.6069[/C][C]0.546891[/C][C]0.273445[/C][/ROW]
[ROW][C]M4[/C][C]-3.05293292720597[/C][C]2.513266[/C][C]-1.2147[/C][C]0.230669[/C][C]0.115334[/C][/ROW]
[ROW][C]M5[/C][C]-2.50303586532052[/C][C]2.503426[/C][C]-0.9998[/C][C]0.322617[/C][C]0.161308[/C][/ROW]
[ROW][C]M6[/C][C]-5.22204938138058[/C][C]2.74159[/C][C]-1.9048[/C][C]0.063076[/C][C]0.031538[/C][/ROW]
[ROW][C]M7[/C][C]13.1270665500966[/C][C]2.600069[/C][C]5.0487[/C][C]7e-06[/C][C]4e-06[/C][/ROW]
[ROW][C]M8[/C][C]5.15709840515961[/C][C]2.45626[/C][C]2.0996[/C][C]0.041281[/C][C]0.020641[/C][/ROW]
[ROW][C]M9[/C][C]-10.8793637664784[/C][C]2.72884[/C][C]-3.9868[/C][C]0.000237[/C][C]0.000119[/C][/ROW]
[ROW][C]M10[/C][C]-8.40882886848744[/C][C]2.758882[/C][C]-3.0479[/C][C]0.003812[/C][C]0.001906[/C][/ROW]
[ROW][C]M11[/C][C]-6.11396816149799[/C][C]2.546047[/C][C]-2.4014[/C][C]0.020433[/C][C]0.010216[/C][/ROW]
[ROW][C]t[/C][C]-0.120470689324152[/C][C]0.030364[/C][C]-3.9675[/C][C]0.000252[/C][C]0.000126[/C][/ROW]
[/TABLE]
Source: https://freestatistics.org/blog/index.php?pk=104029&T=2

Globally Unique Identifier (entire table): ba.freestatistics.org/blog/index.php?pk=104029&T=2

As an alternative you can also use a QR Code:  

The GUIDs for individual cells are displayed in the table below:

Multiple Linear Regression - Ordinary Least Squares
VariableParameterS.D.T-STATH0: parameter = 02-tail p-value1-tail p-value
(Intercept)35.36070504812668.4395464.18990.0001256.3e-05
T.I.P.0.802547093859460.08149.859300
M14.407690554627862.4792981.77780.0820480.041024
M2-1.671200919942492.48515-0.67250.5046460.252323
M3-1.613144656581582.657938-0.60690.5468910.273445
M4-3.052932927205972.513266-1.21470.2306690.115334
M5-2.503035865320522.503426-0.99980.3226170.161308
M6-5.222049381380582.74159-1.90480.0630760.031538
M713.12706655009662.6000695.04877e-064e-06
M85.157098405159612.456262.09960.0412810.020641
M9-10.87936376647842.72884-3.98680.0002370.000119
M10-8.408828868487442.758882-3.04790.0038120.001906
M11-6.113968161497992.546047-2.40140.0204330.010216
t-0.1204706893241520.030364-3.96750.0002520.000126


Multiple Linear Regression - Regression Statistics
Multiple R0.889237640042933
R-squared0.790743580469125
Adjusted R-squared0.731605896688661
F-TEST (value)13.3712301517351
F-TEST (DF numerator)13
F-TEST (DF denominator)46
p-value1.52531320907201e-11
Multiple Linear Regression - Residual Statistics
Residual Standard Deviation3.87919616466738
Sum Squared Residuals692.215492662624

\begin{tabular}{lllllllll}
\hline
Multiple Linear Regression - Regression Statistics \tabularnewline
Multiple R & 0.889237640042933 \tabularnewline
R-squared & 0.790743580469125 \tabularnewline
Adjusted R-squared & 0.731605896688661 \tabularnewline
F-TEST (value) & 13.3712301517351 \tabularnewline
F-TEST (DF numerator) & 13 \tabularnewline
F-TEST (DF denominator) & 46 \tabularnewline
p-value & 1.52531320907201e-11 \tabularnewline
Multiple Linear Regression - Residual Statistics \tabularnewline
Residual Standard Deviation & 3.87919616466738 \tabularnewline
Sum Squared Residuals & 692.215492662624 \tabularnewline
\hline
\end{tabular}
%Source: https://freestatistics.org/blog/index.php?pk=104029&T=3

[TABLE]
[ROW][C]Multiple Linear Regression - Regression Statistics[/C][/ROW]
[ROW][C]Multiple R[/C][C]0.889237640042933[/C][/ROW]
[ROW][C]R-squared[/C][C]0.790743580469125[/C][/ROW]
[ROW][C]Adjusted R-squared[/C][C]0.731605896688661[/C][/ROW]
[ROW][C]F-TEST (value)[/C][C]13.3712301517351[/C][/ROW]
[ROW][C]F-TEST (DF numerator)[/C][C]13[/C][/ROW]
[ROW][C]F-TEST (DF denominator)[/C][C]46[/C][/ROW]
[ROW][C]p-value[/C][C]1.52531320907201e-11[/C][/ROW]
[ROW][C]Multiple Linear Regression - Residual Statistics[/C][/ROW]
[ROW][C]Residual Standard Deviation[/C][C]3.87919616466738[/C][/ROW]
[ROW][C]Sum Squared Residuals[/C][C]692.215492662624[/C][/ROW]
[/TABLE]
Source: https://freestatistics.org/blog/index.php?pk=104029&T=3

Globally Unique Identifier (entire table): ba.freestatistics.org/blog/index.php?pk=104029&T=3

As an alternative you can also use a QR Code:  

The GUIDs for individual cells are displayed in the table below:

Multiple Linear Regression - Regression Statistics
Multiple R0.889237640042933
R-squared0.790743580469125
Adjusted R-squared0.731605896688661
F-TEST (value)13.3712301517351
F-TEST (DF numerator)13
F-TEST (DF denominator)46
p-value1.52531320907201e-11
Multiple Linear Regression - Residual Statistics
Residual Standard Deviation3.87919616466738
Sum Squared Residuals692.215492662624


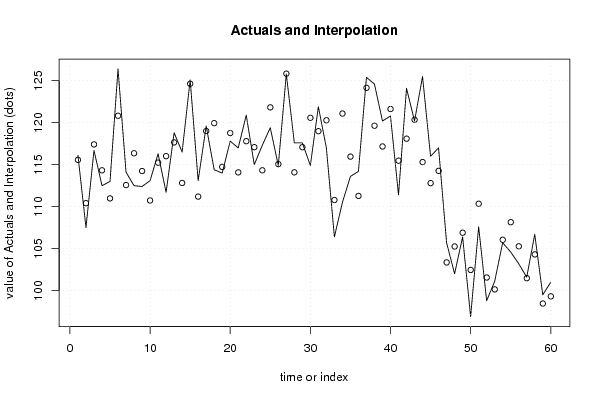
Multiple Linear Regression - Actuals, Interpolation, and Residuals
Time or IndexActualsInterpolationForecastResidualsPrediction Error
1116.1115.5688799925350.531120007464972
2107.5110.412829050658-2.91282905065792
3116.7117.412829050658-0.71282905065791
4112.5114.327730612376-1.82773061237640
5113110.9851856437982.01481435620177
6126.4120.8259455213935.57405447860652
7114.1112.5705366661841.52946333381559
8112.5116.357794821043-3.85779482104322
9112.4114.245436102622-1.84543610262157
10113.1110.7369065261142.36309347388565
11116.3115.2386831159721.06131688402794
12111.7116.015624478059-4.31562447805942
13118.8117.6544389336271.14556106637307
14116.5112.8194068292933.6805931707065
15125.1124.6346893924500.465310607549739
16113.1111.1967334433821.90326655661828
17119.6119.009593079450.590406920549954
18114.4119.942080215205-5.54208021520527
19114114.736350316662-0.73635031666215
20117.8118.764372599679-0.964372599678796
21117114.0838631809072.91613681909310
22120.9117.7982574491353.10174255086521
23115117.083477928906-2.08347792890604
24117.3114.3292120780122.97078792198823
25119.4121.826620318753-2.42662031875331
26114.9115.065475189157-0.165475189157182
27125.8125.837446530297-0.0374465302966489
28117.6114.0848394783333.51516052166703
29117.6117.0824165512450.517583448755456
30114.9120.58305438735-5.68305438735005
31121.9118.9887864111742.91121358882552
32117120.288148575069-3.28814857506897
33106.4110.792356593140-4.39235659314032
34110.5121.087637031016-10.5876370310158
35113.6115.95884849456-2.35884849456000
36114.2111.2784696184032.92153038159698
37125.4124.1529433880031.24705661199705
38124.6119.6389301212134.96106987878668
39120.2117.1688744136723.03112558632831
40120.8121.627718657669-0.827718657669097
41111.4115.476258860583-4.07625886058282
42124.1118.0940948934436.00590510655705
43120.2120.352052967793-0.152052967792771
44125.5115.31129309019810.1887069098025
45116112.7976608248463.20233917515382
46117114.2649232302682.73507676973241
47105.7103.3577956180242.34220438197630
48102105.258302911514-3.25830291151428
49106.4106.897117367082-0.497117367081779
5096.9102.463358809678-5.56335880967808
51107.6110.346160612923-2.74616061292350
5298.8101.562977808240-2.76297780823982
53101.1100.1465458649240.95345413507564
54105.7106.054824982608-0.354824982608252
55104.6108.152273638186-3.55227363818620
56103.2105.278390914011-2.07839091401149
57101.6101.4806832984850.119316701514982
58106.7104.3122757634672.38772423653252
5999.598.46119484253821.03880515746181
6010199.31839091401151.68160908598851

\begin{tabular}{lllllllll}
\hline
Multiple Linear Regression - Actuals, Interpolation, and Residuals \tabularnewline
Time or Index & Actuals & InterpolationForecast & ResidualsPrediction Error \tabularnewline
1 & 116.1 & 115.568879992535 & 0.531120007464972 \tabularnewline
2 & 107.5 & 110.412829050658 & -2.91282905065792 \tabularnewline
3 & 116.7 & 117.412829050658 & -0.71282905065791 \tabularnewline
4 & 112.5 & 114.327730612376 & -1.82773061237640 \tabularnewline
5 & 113 & 110.985185643798 & 2.01481435620177 \tabularnewline
6 & 126.4 & 120.825945521393 & 5.57405447860652 \tabularnewline
7 & 114.1 & 112.570536666184 & 1.52946333381559 \tabularnewline
8 & 112.5 & 116.357794821043 & -3.85779482104322 \tabularnewline
9 & 112.4 & 114.245436102622 & -1.84543610262157 \tabularnewline
10 & 113.1 & 110.736906526114 & 2.36309347388565 \tabularnewline
11 & 116.3 & 115.238683115972 & 1.06131688402794 \tabularnewline
12 & 111.7 & 116.015624478059 & -4.31562447805942 \tabularnewline
13 & 118.8 & 117.654438933627 & 1.14556106637307 \tabularnewline
14 & 116.5 & 112.819406829293 & 3.6805931707065 \tabularnewline
15 & 125.1 & 124.634689392450 & 0.465310607549739 \tabularnewline
16 & 113.1 & 111.196733443382 & 1.90326655661828 \tabularnewline
17 & 119.6 & 119.00959307945 & 0.590406920549954 \tabularnewline
18 & 114.4 & 119.942080215205 & -5.54208021520527 \tabularnewline
19 & 114 & 114.736350316662 & -0.73635031666215 \tabularnewline
20 & 117.8 & 118.764372599679 & -0.964372599678796 \tabularnewline
21 & 117 & 114.083863180907 & 2.91613681909310 \tabularnewline
22 & 120.9 & 117.798257449135 & 3.10174255086521 \tabularnewline
23 & 115 & 117.083477928906 & -2.08347792890604 \tabularnewline
24 & 117.3 & 114.329212078012 & 2.97078792198823 \tabularnewline
25 & 119.4 & 121.826620318753 & -2.42662031875331 \tabularnewline
26 & 114.9 & 115.065475189157 & -0.165475189157182 \tabularnewline
27 & 125.8 & 125.837446530297 & -0.0374465302966489 \tabularnewline
28 & 117.6 & 114.084839478333 & 3.51516052166703 \tabularnewline
29 & 117.6 & 117.082416551245 & 0.517583448755456 \tabularnewline
30 & 114.9 & 120.58305438735 & -5.68305438735005 \tabularnewline
31 & 121.9 & 118.988786411174 & 2.91121358882552 \tabularnewline
32 & 117 & 120.288148575069 & -3.28814857506897 \tabularnewline
33 & 106.4 & 110.792356593140 & -4.39235659314032 \tabularnewline
34 & 110.5 & 121.087637031016 & -10.5876370310158 \tabularnewline
35 & 113.6 & 115.95884849456 & -2.35884849456000 \tabularnewline
36 & 114.2 & 111.278469618403 & 2.92153038159698 \tabularnewline
37 & 125.4 & 124.152943388003 & 1.24705661199705 \tabularnewline
38 & 124.6 & 119.638930121213 & 4.96106987878668 \tabularnewline
39 & 120.2 & 117.168874413672 & 3.03112558632831 \tabularnewline
40 & 120.8 & 121.627718657669 & -0.827718657669097 \tabularnewline
41 & 111.4 & 115.476258860583 & -4.07625886058282 \tabularnewline
42 & 124.1 & 118.094094893443 & 6.00590510655705 \tabularnewline
43 & 120.2 & 120.352052967793 & -0.152052967792771 \tabularnewline
44 & 125.5 & 115.311293090198 & 10.1887069098025 \tabularnewline
45 & 116 & 112.797660824846 & 3.20233917515382 \tabularnewline
46 & 117 & 114.264923230268 & 2.73507676973241 \tabularnewline
47 & 105.7 & 103.357795618024 & 2.34220438197630 \tabularnewline
48 & 102 & 105.258302911514 & -3.25830291151428 \tabularnewline
49 & 106.4 & 106.897117367082 & -0.497117367081779 \tabularnewline
50 & 96.9 & 102.463358809678 & -5.56335880967808 \tabularnewline
51 & 107.6 & 110.346160612923 & -2.74616061292350 \tabularnewline
52 & 98.8 & 101.562977808240 & -2.76297780823982 \tabularnewline
53 & 101.1 & 100.146545864924 & 0.95345413507564 \tabularnewline
54 & 105.7 & 106.054824982608 & -0.354824982608252 \tabularnewline
55 & 104.6 & 108.152273638186 & -3.55227363818620 \tabularnewline
56 & 103.2 & 105.278390914011 & -2.07839091401149 \tabularnewline
57 & 101.6 & 101.480683298485 & 0.119316701514982 \tabularnewline
58 & 106.7 & 104.312275763467 & 2.38772423653252 \tabularnewline
59 & 99.5 & 98.4611948425382 & 1.03880515746181 \tabularnewline
60 & 101 & 99.3183909140115 & 1.68160908598851 \tabularnewline
\hline
\end{tabular}
%Source: https://freestatistics.org/blog/index.php?pk=104029&T=4

[TABLE]
[ROW][C]Multiple Linear Regression - Actuals, Interpolation, and Residuals[/C][/ROW]
[ROW][C]Time or Index[/C][C]Actuals[/C][C]InterpolationForecast[/C][C]ResidualsPrediction Error[/C][/ROW]
[ROW][C]1[/C][C]116.1[/C][C]115.568879992535[/C][C]0.531120007464972[/C][/ROW]
[ROW][C]2[/C][C]107.5[/C][C]110.412829050658[/C][C]-2.91282905065792[/C][/ROW]
[ROW][C]3[/C][C]116.7[/C][C]117.412829050658[/C][C]-0.71282905065791[/C][/ROW]
[ROW][C]4[/C][C]112.5[/C][C]114.327730612376[/C][C]-1.82773061237640[/C][/ROW]
[ROW][C]5[/C][C]113[/C][C]110.985185643798[/C][C]2.01481435620177[/C][/ROW]
[ROW][C]6[/C][C]126.4[/C][C]120.825945521393[/C][C]5.57405447860652[/C][/ROW]
[ROW][C]7[/C][C]114.1[/C][C]112.570536666184[/C][C]1.52946333381559[/C][/ROW]
[ROW][C]8[/C][C]112.5[/C][C]116.357794821043[/C][C]-3.85779482104322[/C][/ROW]
[ROW][C]9[/C][C]112.4[/C][C]114.245436102622[/C][C]-1.84543610262157[/C][/ROW]
[ROW][C]10[/C][C]113.1[/C][C]110.736906526114[/C][C]2.36309347388565[/C][/ROW]
[ROW][C]11[/C][C]116.3[/C][C]115.238683115972[/C][C]1.06131688402794[/C][/ROW]
[ROW][C]12[/C][C]111.7[/C][C]116.015624478059[/C][C]-4.31562447805942[/C][/ROW]
[ROW][C]13[/C][C]118.8[/C][C]117.654438933627[/C][C]1.14556106637307[/C][/ROW]
[ROW][C]14[/C][C]116.5[/C][C]112.819406829293[/C][C]3.6805931707065[/C][/ROW]
[ROW][C]15[/C][C]125.1[/C][C]124.634689392450[/C][C]0.465310607549739[/C][/ROW]
[ROW][C]16[/C][C]113.1[/C][C]111.196733443382[/C][C]1.90326655661828[/C][/ROW]
[ROW][C]17[/C][C]119.6[/C][C]119.00959307945[/C][C]0.590406920549954[/C][/ROW]
[ROW][C]18[/C][C]114.4[/C][C]119.942080215205[/C][C]-5.54208021520527[/C][/ROW]
[ROW][C]19[/C][C]114[/C][C]114.736350316662[/C][C]-0.73635031666215[/C][/ROW]
[ROW][C]20[/C][C]117.8[/C][C]118.764372599679[/C][C]-0.964372599678796[/C][/ROW]
[ROW][C]21[/C][C]117[/C][C]114.083863180907[/C][C]2.91613681909310[/C][/ROW]
[ROW][C]22[/C][C]120.9[/C][C]117.798257449135[/C][C]3.10174255086521[/C][/ROW]
[ROW][C]23[/C][C]115[/C][C]117.083477928906[/C][C]-2.08347792890604[/C][/ROW]
[ROW][C]24[/C][C]117.3[/C][C]114.329212078012[/C][C]2.97078792198823[/C][/ROW]
[ROW][C]25[/C][C]119.4[/C][C]121.826620318753[/C][C]-2.42662031875331[/C][/ROW]
[ROW][C]26[/C][C]114.9[/C][C]115.065475189157[/C][C]-0.165475189157182[/C][/ROW]
[ROW][C]27[/C][C]125.8[/C][C]125.837446530297[/C][C]-0.0374465302966489[/C][/ROW]
[ROW][C]28[/C][C]117.6[/C][C]114.084839478333[/C][C]3.51516052166703[/C][/ROW]
[ROW][C]29[/C][C]117.6[/C][C]117.082416551245[/C][C]0.517583448755456[/C][/ROW]
[ROW][C]30[/C][C]114.9[/C][C]120.58305438735[/C][C]-5.68305438735005[/C][/ROW]
[ROW][C]31[/C][C]121.9[/C][C]118.988786411174[/C][C]2.91121358882552[/C][/ROW]
[ROW][C]32[/C][C]117[/C][C]120.288148575069[/C][C]-3.28814857506897[/C][/ROW]
[ROW][C]33[/C][C]106.4[/C][C]110.792356593140[/C][C]-4.39235659314032[/C][/ROW]
[ROW][C]34[/C][C]110.5[/C][C]121.087637031016[/C][C]-10.5876370310158[/C][/ROW]
[ROW][C]35[/C][C]113.6[/C][C]115.95884849456[/C][C]-2.35884849456000[/C][/ROW]
[ROW][C]36[/C][C]114.2[/C][C]111.278469618403[/C][C]2.92153038159698[/C][/ROW]
[ROW][C]37[/C][C]125.4[/C][C]124.152943388003[/C][C]1.24705661199705[/C][/ROW]
[ROW][C]38[/C][C]124.6[/C][C]119.638930121213[/C][C]4.96106987878668[/C][/ROW]
[ROW][C]39[/C][C]120.2[/C][C]117.168874413672[/C][C]3.03112558632831[/C][/ROW]
[ROW][C]40[/C][C]120.8[/C][C]121.627718657669[/C][C]-0.827718657669097[/C][/ROW]
[ROW][C]41[/C][C]111.4[/C][C]115.476258860583[/C][C]-4.07625886058282[/C][/ROW]
[ROW][C]42[/C][C]124.1[/C][C]118.094094893443[/C][C]6.00590510655705[/C][/ROW]
[ROW][C]43[/C][C]120.2[/C][C]120.352052967793[/C][C]-0.152052967792771[/C][/ROW]
[ROW][C]44[/C][C]125.5[/C][C]115.311293090198[/C][C]10.1887069098025[/C][/ROW]
[ROW][C]45[/C][C]116[/C][C]112.797660824846[/C][C]3.20233917515382[/C][/ROW]
[ROW][C]46[/C][C]117[/C][C]114.264923230268[/C][C]2.73507676973241[/C][/ROW]
[ROW][C]47[/C][C]105.7[/C][C]103.357795618024[/C][C]2.34220438197630[/C][/ROW]
[ROW][C]48[/C][C]102[/C][C]105.258302911514[/C][C]-3.25830291151428[/C][/ROW]
[ROW][C]49[/C][C]106.4[/C][C]106.897117367082[/C][C]-0.497117367081779[/C][/ROW]
[ROW][C]50[/C][C]96.9[/C][C]102.463358809678[/C][C]-5.56335880967808[/C][/ROW]
[ROW][C]51[/C][C]107.6[/C][C]110.346160612923[/C][C]-2.74616061292350[/C][/ROW]
[ROW][C]52[/C][C]98.8[/C][C]101.562977808240[/C][C]-2.76297780823982[/C][/ROW]
[ROW][C]53[/C][C]101.1[/C][C]100.146545864924[/C][C]0.95345413507564[/C][/ROW]
[ROW][C]54[/C][C]105.7[/C][C]106.054824982608[/C][C]-0.354824982608252[/C][/ROW]
[ROW][C]55[/C][C]104.6[/C][C]108.152273638186[/C][C]-3.55227363818620[/C][/ROW]
[ROW][C]56[/C][C]103.2[/C][C]105.278390914011[/C][C]-2.07839091401149[/C][/ROW]
[ROW][C]57[/C][C]101.6[/C][C]101.480683298485[/C][C]0.119316701514982[/C][/ROW]
[ROW][C]58[/C][C]106.7[/C][C]104.312275763467[/C][C]2.38772423653252[/C][/ROW]
[ROW][C]59[/C][C]99.5[/C][C]98.4611948425382[/C][C]1.03880515746181[/C][/ROW]
[ROW][C]60[/C][C]101[/C][C]99.3183909140115[/C][C]1.68160908598851[/C][/ROW]
[/TABLE]
Source: https://freestatistics.org/blog/index.php?pk=104029&T=4

Globally Unique Identifier (entire table): ba.freestatistics.org/blog/index.php?pk=104029&T=4

As an alternative you can also use a QR Code:  

The GUIDs for individual cells are displayed in the table below:

Multiple Linear Regression - Actuals, Interpolation, and Residuals
Time or IndexActualsInterpolationForecastResidualsPrediction Error
1116.1115.5688799925350.531120007464972
2107.5110.412829050658-2.91282905065792
3116.7117.412829050658-0.71282905065791
4112.5114.327730612376-1.82773061237640
5113110.9851856437982.01481435620177
6126.4120.8259455213935.57405447860652
7114.1112.5705366661841.52946333381559
8112.5116.357794821043-3.85779482104322
9112.4114.245436102622-1.84543610262157
10113.1110.7369065261142.36309347388565
11116.3115.2386831159721.06131688402794
12111.7116.015624478059-4.31562447805942
13118.8117.6544389336271.14556106637307
14116.5112.8194068292933.6805931707065
15125.1124.6346893924500.465310607549739
16113.1111.1967334433821.90326655661828
17119.6119.009593079450.590406920549954
18114.4119.942080215205-5.54208021520527
19114114.736350316662-0.73635031666215
20117.8118.764372599679-0.964372599678796
21117114.0838631809072.91613681909310
22120.9117.7982574491353.10174255086521
23115117.083477928906-2.08347792890604
24117.3114.3292120780122.97078792198823
25119.4121.826620318753-2.42662031875331
26114.9115.065475189157-0.165475189157182
27125.8125.837446530297-0.0374465302966489
28117.6114.0848394783333.51516052166703
29117.6117.0824165512450.517583448755456
30114.9120.58305438735-5.68305438735005
31121.9118.9887864111742.91121358882552
32117120.288148575069-3.28814857506897
33106.4110.792356593140-4.39235659314032
34110.5121.087637031016-10.5876370310158
35113.6115.95884849456-2.35884849456000
36114.2111.2784696184032.92153038159698
37125.4124.1529433880031.24705661199705
38124.6119.6389301212134.96106987878668
39120.2117.1688744136723.03112558632831
40120.8121.627718657669-0.827718657669097
41111.4115.476258860583-4.07625886058282
42124.1118.0940948934436.00590510655705
43120.2120.352052967793-0.152052967792771
44125.5115.31129309019810.1887069098025
45116112.7976608248463.20233917515382
46117114.2649232302682.73507676973241
47105.7103.3577956180242.34220438197630
48102105.258302911514-3.25830291151428
49106.4106.897117367082-0.497117367081779
5096.9102.463358809678-5.56335880967808
51107.6110.346160612923-2.74616061292350
5298.8101.562977808240-2.76297780823982
53101.1100.1465458649240.95345413507564
54105.7106.054824982608-0.354824982608252
55104.6108.152273638186-3.55227363818620
56103.2105.278390914011-2.07839091401149
57101.6101.4806832984850.119316701514982
58106.7104.3122757634672.38772423653252
5999.598.46119484253821.03880515746181
6010199.31839091401151.68160908598851


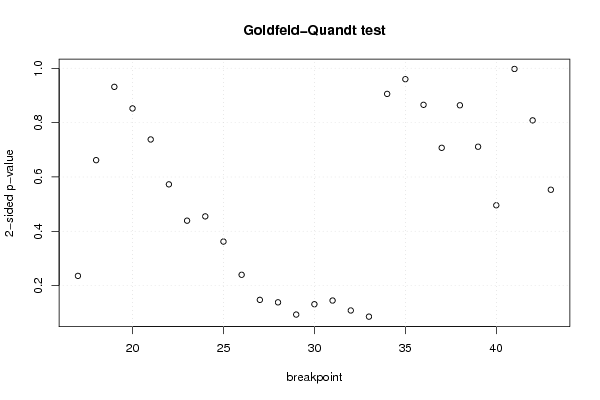
Goldfeld-Quandt test for Heteroskedasticity
p-valuesAlternative Hypothesis
breakpoint indexgreater2-sidedless
170.1179151188326200.2358302376652400.88208488116738
180.6691198976420920.6617602047158160.330880102357908
190.5342016413461250.931596717307750.465798358653875
200.4260921236038870.8521842472077750.573907876396113
210.3689880387652550.7379760775305090.631011961234745
220.2863666608347930.5727333216695850.713633339165207
230.2195438571563160.4390877143126320.780456142843684
240.2274552304156680.4549104608313370.772544769584332
250.1811127306155970.3622254612311940.818887269384403
260.1199806922829680.2399613845659350.880019307717032
270.07379943890738820.1475988778147760.926200561092612
280.06930296134015540.1386059226803110.930697038659845
290.04676866646871260.09353733293742530.953231333531287
300.06579192133493630.1315838426698730.934208078665064
310.07258375433933670.1451675086786730.927416245660663
320.05430346510692530.1086069302138510.945696534893075
330.04292490785455720.08584981570911450.957075092145443
340.4528415184339140.9056830368678280.547158481566086
350.5200894850421610.9598210299156780.479910514957839
360.4327611689904910.8655223379809820.567238831009509
370.3536145868070360.7072291736140720.646385413192964
380.4319119014683520.8638238029367040.568088098531648
390.3556217360839640.7112434721679290.644378263916036
400.2478863741439540.4957727482879080.752113625856046
410.4987515803396380.9975031606792760.501248419660362
420.4041517305782810.8083034611565630.595848269421719
430.2764462297300040.5528924594600080.723553770269996

\begin{tabular}{lllllllll}
\hline
Goldfeld-Quandt test for Heteroskedasticity \tabularnewline
p-values & Alternative Hypothesis \tabularnewline
breakpoint index & greater & 2-sided & less \tabularnewline
17 & 0.117915118832620 & 0.235830237665240 & 0.88208488116738 \tabularnewline
18 & 0.669119897642092 & 0.661760204715816 & 0.330880102357908 \tabularnewline
19 & 0.534201641346125 & 0.93159671730775 & 0.465798358653875 \tabularnewline
20 & 0.426092123603887 & 0.852184247207775 & 0.573907876396113 \tabularnewline
21 & 0.368988038765255 & 0.737976077530509 & 0.631011961234745 \tabularnewline
22 & 0.286366660834793 & 0.572733321669585 & 0.713633339165207 \tabularnewline
23 & 0.219543857156316 & 0.439087714312632 & 0.780456142843684 \tabularnewline
24 & 0.227455230415668 & 0.454910460831337 & 0.772544769584332 \tabularnewline
25 & 0.181112730615597 & 0.362225461231194 & 0.818887269384403 \tabularnewline
26 & 0.119980692282968 & 0.239961384565935 & 0.880019307717032 \tabularnewline
27 & 0.0737994389073882 & 0.147598877814776 & 0.926200561092612 \tabularnewline
28 & 0.0693029613401554 & 0.138605922680311 & 0.930697038659845 \tabularnewline
29 & 0.0467686664687126 & 0.0935373329374253 & 0.953231333531287 \tabularnewline
30 & 0.0657919213349363 & 0.131583842669873 & 0.934208078665064 \tabularnewline
31 & 0.0725837543393367 & 0.145167508678673 & 0.927416245660663 \tabularnewline
32 & 0.0543034651069253 & 0.108606930213851 & 0.945696534893075 \tabularnewline
33 & 0.0429249078545572 & 0.0858498157091145 & 0.957075092145443 \tabularnewline
34 & 0.452841518433914 & 0.905683036867828 & 0.547158481566086 \tabularnewline
35 & 0.520089485042161 & 0.959821029915678 & 0.479910514957839 \tabularnewline
36 & 0.432761168990491 & 0.865522337980982 & 0.567238831009509 \tabularnewline
37 & 0.353614586807036 & 0.707229173614072 & 0.646385413192964 \tabularnewline
38 & 0.431911901468352 & 0.863823802936704 & 0.568088098531648 \tabularnewline
39 & 0.355621736083964 & 0.711243472167929 & 0.644378263916036 \tabularnewline
40 & 0.247886374143954 & 0.495772748287908 & 0.752113625856046 \tabularnewline
41 & 0.498751580339638 & 0.997503160679276 & 0.501248419660362 \tabularnewline
42 & 0.404151730578281 & 0.808303461156563 & 0.595848269421719 \tabularnewline
43 & 0.276446229730004 & 0.552892459460008 & 0.723553770269996 \tabularnewline
\hline
\end{tabular}
%Source: https://freestatistics.org/blog/index.php?pk=104029&T=5

[TABLE]
[ROW][C]Goldfeld-Quandt test for Heteroskedasticity[/C][/ROW]
[ROW][C]p-values[/C][C]Alternative Hypothesis[/C][/ROW]
[ROW][C]breakpoint index[/C][C]greater[/C][C]2-sided[/C][C]less[/C][/ROW]
[ROW][C]17[/C][C]0.117915118832620[/C][C]0.235830237665240[/C][C]0.88208488116738[/C][/ROW]
[ROW][C]18[/C][C]0.669119897642092[/C][C]0.661760204715816[/C][C]0.330880102357908[/C][/ROW]
[ROW][C]19[/C][C]0.534201641346125[/C][C]0.93159671730775[/C][C]0.465798358653875[/C][/ROW]
[ROW][C]20[/C][C]0.426092123603887[/C][C]0.852184247207775[/C][C]0.573907876396113[/C][/ROW]
[ROW][C]21[/C][C]0.368988038765255[/C][C]0.737976077530509[/C][C]0.631011961234745[/C][/ROW]
[ROW][C]22[/C][C]0.286366660834793[/C][C]0.572733321669585[/C][C]0.713633339165207[/C][/ROW]
[ROW][C]23[/C][C]0.219543857156316[/C][C]0.439087714312632[/C][C]0.780456142843684[/C][/ROW]
[ROW][C]24[/C][C]0.227455230415668[/C][C]0.454910460831337[/C][C]0.772544769584332[/C][/ROW]
[ROW][C]25[/C][C]0.181112730615597[/C][C]0.362225461231194[/C][C]0.818887269384403[/C][/ROW]
[ROW][C]26[/C][C]0.119980692282968[/C][C]0.239961384565935[/C][C]0.880019307717032[/C][/ROW]
[ROW][C]27[/C][C]0.0737994389073882[/C][C]0.147598877814776[/C][C]0.926200561092612[/C][/ROW]
[ROW][C]28[/C][C]0.0693029613401554[/C][C]0.138605922680311[/C][C]0.930697038659845[/C][/ROW]
[ROW][C]29[/C][C]0.0467686664687126[/C][C]0.0935373329374253[/C][C]0.953231333531287[/C][/ROW]
[ROW][C]30[/C][C]0.0657919213349363[/C][C]0.131583842669873[/C][C]0.934208078665064[/C][/ROW]
[ROW][C]31[/C][C]0.0725837543393367[/C][C]0.145167508678673[/C][C]0.927416245660663[/C][/ROW]
[ROW][C]32[/C][C]0.0543034651069253[/C][C]0.108606930213851[/C][C]0.945696534893075[/C][/ROW]
[ROW][C]33[/C][C]0.0429249078545572[/C][C]0.0858498157091145[/C][C]0.957075092145443[/C][/ROW]
[ROW][C]34[/C][C]0.452841518433914[/C][C]0.905683036867828[/C][C]0.547158481566086[/C][/ROW]
[ROW][C]35[/C][C]0.520089485042161[/C][C]0.959821029915678[/C][C]0.479910514957839[/C][/ROW]
[ROW][C]36[/C][C]0.432761168990491[/C][C]0.865522337980982[/C][C]0.567238831009509[/C][/ROW]
[ROW][C]37[/C][C]0.353614586807036[/C][C]0.707229173614072[/C][C]0.646385413192964[/C][/ROW]
[ROW][C]38[/C][C]0.431911901468352[/C][C]0.863823802936704[/C][C]0.568088098531648[/C][/ROW]
[ROW][C]39[/C][C]0.355621736083964[/C][C]0.711243472167929[/C][C]0.644378263916036[/C][/ROW]
[ROW][C]40[/C][C]0.247886374143954[/C][C]0.495772748287908[/C][C]0.752113625856046[/C][/ROW]
[ROW][C]41[/C][C]0.498751580339638[/C][C]0.997503160679276[/C][C]0.501248419660362[/C][/ROW]
[ROW][C]42[/C][C]0.404151730578281[/C][C]0.808303461156563[/C][C]0.595848269421719[/C][/ROW]
[ROW][C]43[/C][C]0.276446229730004[/C][C]0.552892459460008[/C][C]0.723553770269996[/C][/ROW]
[/TABLE]
Source: https://freestatistics.org/blog/index.php?pk=104029&T=5

Globally Unique Identifier (entire table): ba.freestatistics.org/blog/index.php?pk=104029&T=5

As an alternative you can also use a QR Code:  

The GUIDs for individual cells are displayed in the table below:

Goldfeld-Quandt test for Heteroskedasticity
p-valuesAlternative Hypothesis
breakpoint indexgreater2-sidedless
170.1179151188326200.2358302376652400.88208488116738
180.6691198976420920.6617602047158160.330880102357908
190.5342016413461250.931596717307750.465798358653875
200.4260921236038870.8521842472077750.573907876396113
210.3689880387652550.7379760775305090.631011961234745
220.2863666608347930.5727333216695850.713633339165207
230.2195438571563160.4390877143126320.780456142843684
240.2274552304156680.4549104608313370.772544769584332
250.1811127306155970.3622254612311940.818887269384403
260.1199806922829680.2399613845659350.880019307717032
270.07379943890738820.1475988778147760.926200561092612
280.06930296134015540.1386059226803110.930697038659845
290.04676866646871260.09353733293742530.953231333531287
300.06579192133493630.1315838426698730.934208078665064
310.07258375433933670.1451675086786730.927416245660663
320.05430346510692530.1086069302138510.945696534893075
330.04292490785455720.08584981570911450.957075092145443
340.4528415184339140.9056830368678280.547158481566086
350.5200894850421610.9598210299156780.479910514957839
360.4327611689904910.8655223379809820.567238831009509
370.3536145868070360.7072291736140720.646385413192964
380.4319119014683520.8638238029367040.568088098531648
390.3556217360839640.7112434721679290.644378263916036
400.2478863741439540.4957727482879080.752113625856046
410.4987515803396380.9975031606792760.501248419660362
420.4041517305782810.8083034611565630.595848269421719
430.2764462297300040.5528924594600080.723553770269996


Meta Analysis of Goldfeld-Quandt test for Heteroskedasticity
Description# significant tests% significant testsOK/NOK
1% type I error level00OK
5% type I error level00OK
10% type I error level20.0740740740740741OK

\begin{tabular}{lllllllll}
\hline
Meta Analysis of Goldfeld-Quandt test for Heteroskedasticity \tabularnewline
Description & # significant tests & % significant tests & OK/NOK \tabularnewline
1% type I error level & 0 & 0 & OK \tabularnewline
5% type I error level & 0 & 0 & OK \tabularnewline
10% type I error level & 2 & 0.0740740740740741 & OK \tabularnewline
\hline
\end{tabular}
%Source: https://freestatistics.org/blog/index.php?pk=104029&T=6

[TABLE]
[ROW][C]Meta Analysis of Goldfeld-Quandt test for Heteroskedasticity[/C][/ROW]
[ROW][C]Description[/C][C]# significant tests[/C][C]% significant tests[/C][C]OK/NOK[/C][/ROW]
[ROW][C]1% type I error level[/C][C]0[/C][C]0[/C][C]OK[/C][/ROW]
[ROW][C]5% type I error level[/C][C]0[/C][C]0[/C][C]OK[/C][/ROW]
[ROW][C]10% type I error level[/C][C]2[/C][C]0.0740740740740741[/C][C]OK[/C][/ROW]
[/TABLE]
Source: https://freestatistics.org/blog/index.php?pk=104029&T=6

Globally Unique Identifier (entire table): ba.freestatistics.org/blog/index.php?pk=104029&T=6

As an alternative you can also use a QR Code:  

The GUIDs for individual cells are displayed in the table below:

Meta Analysis of Goldfeld-Quandt test for Heteroskedasticity
Description# significant tests% significant testsOK/NOK
1% type I error level00OK
5% type I error level00OK
10% type I error level20.0740740740740741OK


Parameters (Session):
par1 = 2 ; par2 = Include Monthly Dummies ; par3 = Linear Trend ;
Parameters (R input):
par1 = 2 ; par2 = Include Monthly Dummies ; par3 = Linear Trend ;
R code (references can be found in the software module):
library(lattice)
library(lmtest)
n25 <- 25 #minimum number of obs. for Goldfeld-Quandt test
par1 <- as.numeric(par1)
x <- t(y)
k <- length(x[1,])
n <- length(x[,1])
x1 <- cbind(x[,par1], x[,1:k!=par1])
mycolnames <- c(colnames(x)[par1], colnames(x)[1:k!=par1])
colnames(x1) <- mycolnames #colnames(x)[par1]
x <- x1
if (par3 == 'First Differences'){
x2 <- array(0, dim=c(n-1,k), dimnames=list(1:(n-1), paste('(1-B)',colnames(x),sep='')))
for (i in 1:n-1) {
for (j in 1:k) {
x2[i,j] <- x[i+1,j] - x[i,j]
}
}
x <- x2
}
if (par2 == 'Include Monthly Dummies'){
x2 <- array(0, dim=c(n,11), dimnames=list(1:n, paste('M', seq(1:11), sep ='')))
for (i in 1:11){
x2[seq(i,n,12),i] <- 1
}
x <- cbind(x, x2)
}
if (par2 == 'Include Quarterly Dummies'){
x2 <- array(0, dim=c(n,3), dimnames=list(1:n, paste('Q', seq(1:3), sep ='')))
for (i in 1:3){
x2[seq(i,n,4),i] <- 1
}
x <- cbind(x, x2)
}
k <- length(x[1,])
if (par3 == 'Linear Trend'){
x <- cbind(x, c(1:n))
colnames(x)[k+1] <- 't'
}
x
k <- length(x[1,])
df <- as.data.frame(x)
(mylm <- lm(df))
(mysum <- summary(mylm))
if (n > n25) {
kp3 <- k + 3
nmkm3 <- n - k - 3
gqarr <- array(NA, dim=c(nmkm3-kp3+1,3))
numgqtests <- 0
numsignificant1 <- 0
numsignificant5 <- 0
numsignificant10 <- 0
for (mypoint in kp3:nmkm3) {
j <- 0
numgqtests <- numgqtests + 1
for (myalt in c('greater', 'two.sided', 'less')) {
j <- j + 1
gqarr[mypoint-kp3+1,j] <- gqtest(mylm, point=mypoint, alternative=myalt)$p.value
}
if (gqarr[mypoint-kp3+1,2] < 0.01) numsignificant1 <- numsignificant1 + 1
if (gqarr[mypoint-kp3+1,2] < 0.05) numsignificant5 <- numsignificant5 + 1
if (gqarr[mypoint-kp3+1,2] < 0.10) numsignificant10 <- numsignificant10 + 1
}
gqarr
}
bitmap(file='test0.png')
plot(x[,1], type='l', main='Actuals and Interpolation', ylab='value of Actuals and Interpolation (dots)', xlab='time or index')
points(x[,1]-mysum$resid)
grid()
dev.off()
bitmap(file='test1.png')
plot(mysum$resid, type='b', pch=19, main='Residuals', ylab='value of Residuals', xlab='time or index')
grid()
dev.off()
bitmap(file='test2.png')
hist(mysum$resid, main='Residual Histogram', xlab='values of Residuals')
grid()
dev.off()
bitmap(file='test3.png')
densityplot(~mysum$resid,col='black',main='Residual Density Plot', xlab='values of Residuals')
dev.off()
bitmap(file='test4.png')
qqnorm(mysum$resid, main='Residual Normal Q-Q Plot')
qqline(mysum$resid)
grid()
dev.off()
(myerror <- as.ts(mysum$resid))
bitmap(file='test5.png')
dum <- cbind(lag(myerror,k=1),myerror)
dum
dum1 <- dum[2:length(myerror),]
dum1
z <- as.data.frame(dum1)
z
plot(z,main=paste('Residual Lag plot, lowess, and regression line'), ylab='values of Residuals', xlab='lagged values of Residuals')
lines(lowess(z))
abline(lm(z))
grid()
dev.off()
bitmap(file='test6.png')
acf(mysum$resid, lag.max=length(mysum$resid)/2, main='Residual Autocorrelation Function')
grid()
dev.off()
bitmap(file='test7.png')
pacf(mysum$resid, lag.max=length(mysum$resid)/2, main='Residual Partial Autocorrelation Function')
grid()
dev.off()
bitmap(file='test8.png')
opar <- par(mfrow = c(2,2), oma = c(0, 0, 1.1, 0))
plot(mylm, las = 1, sub='Residual Diagnostics')
par(opar)
dev.off()
if (n > n25) {
bitmap(file='test9.png')
plot(kp3:nmkm3,gqarr[,2], main='Goldfeld-Quandt test',ylab='2-sided p-value',xlab='breakpoint')
grid()
dev.off()
}
load(file='createtable')
a<-table.start()
a<-table.row.start(a)
a<-table.element(a, 'Multiple Linear Regression - Estimated Regression Equation', 1, TRUE)
a<-table.row.end(a)
myeq <- colnames(x)[1]
myeq <- paste(myeq, '[t] = ', sep='')
for (i in 1:k){
if (mysum$coefficients[i,1] > 0) myeq <- paste(myeq, '+', '')
myeq <- paste(myeq, mysum$coefficients[i,1], sep=' ')
if (rownames(mysum$coefficients)[i] != '(Intercept)') {
myeq <- paste(myeq, rownames(mysum$coefficients)[i], sep='')
if (rownames(mysum$coefficients)[i] != 't') myeq <- paste(myeq, '[t]', sep='')
}
}
myeq <- paste(myeq, ' + e[t]')
a<-table.row.start(a)
a<-table.element(a, myeq)
a<-table.row.end(a)
a<-table.end(a)
table.save(a,file='mytable1.tab')
a<-table.start()
a<-table.row.start(a)
a<-table.element(a,hyperlink('ols1.htm','Multiple Linear Regression - Ordinary Least Squares',''), 6, TRUE)
a<-table.row.end(a)
a<-table.row.start(a)
a<-table.element(a,'Variable',header=TRUE)
a<-table.element(a,'Parameter',header=TRUE)
a<-table.element(a,'S.D.',header=TRUE)
a<-table.element(a,'T-STAT
H0: parameter = 0',header=TRUE)
a<-table.element(a,'2-tail p-value',header=TRUE)
a<-table.element(a,'1-tail p-value',header=TRUE)
a<-table.row.end(a)
for (i in 1:k){
a<-table.row.start(a)
a<-table.element(a,rownames(mysum$coefficients)[i],header=TRUE)
a<-table.element(a,mysum$coefficients[i,1])
a<-table.element(a, round(mysum$coefficients[i,2],6))
a<-table.element(a, round(mysum$coefficients[i,3],4))
a<-table.element(a, round(mysum$coefficients[i,4],6))
a<-table.element(a, round(mysum$coefficients[i,4]/2,6))
a<-table.row.end(a)
}
a<-table.end(a)
table.save(a,file='mytable2.tab')
a<-table.start()
a<-table.row.start(a)
a<-table.element(a, 'Multiple Linear Regression - Regression Statistics', 2, TRUE)
a<-table.row.end(a)
a<-table.row.start(a)
a<-table.element(a, 'Multiple R',1,TRUE)
a<-table.element(a, sqrt(mysum$r.squared))
a<-table.row.end(a)
a<-table.row.start(a)
a<-table.element(a, 'R-squared',1,TRUE)
a<-table.element(a, mysum$r.squared)
a<-table.row.end(a)
a<-table.row.start(a)
a<-table.element(a, 'Adjusted R-squared',1,TRUE)
a<-table.element(a, mysum$adj.r.squared)
a<-table.row.end(a)
a<-table.row.start(a)
a<-table.element(a, 'F-TEST (value)',1,TRUE)
a<-table.element(a, mysum$fstatistic[1])
a<-table.row.end(a)
a<-table.row.start(a)
a<-table.element(a, 'F-TEST (DF numerator)',1,TRUE)
a<-table.element(a, mysum$fstatistic[2])
a<-table.row.end(a)
a<-table.row.start(a)
a<-table.element(a, 'F-TEST (DF denominator)',1,TRUE)
a<-table.element(a, mysum$fstatistic[3])
a<-table.row.end(a)
a<-table.row.start(a)
a<-table.element(a, 'p-value',1,TRUE)
a<-table.element(a, 1-pf(mysum$fstatistic[1],mysum$fstatistic[2],mysum$fstatistic[3]))
a<-table.row.end(a)
a<-table.row.start(a)
a<-table.element(a, 'Multiple Linear Regression - Residual Statistics', 2, TRUE)
a<-table.row.end(a)
a<-table.row.start(a)
a<-table.element(a, 'Residual Standard Deviation',1,TRUE)
a<-table.element(a, mysum$sigma)
a<-table.row.end(a)
a<-table.row.start(a)
a<-table.element(a, 'Sum Squared Residuals',1,TRUE)
a<-table.element(a, sum(myerror*myerror))
a<-table.row.end(a)
a<-table.end(a)
table.save(a,file='mytable3.tab')
a<-table.start()
a<-table.row.start(a)
a<-table.element(a, 'Multiple Linear Regression - Actuals, Interpolation, and Residuals', 4, TRUE)
a<-table.row.end(a)
a<-table.row.start(a)
a<-table.element(a, 'Time or Index', 1, TRUE)
a<-table.element(a, 'Actuals', 1, TRUE)
a<-table.element(a, 'Interpolation
Forecast', 1, TRUE)
a<-table.element(a, 'Residuals
Prediction Error', 1, TRUE)
a<-table.row.end(a)
for (i in 1:n) {
a<-table.row.start(a)
a<-table.element(a,i, 1, TRUE)
a<-table.element(a,x[i])
a<-table.element(a,x[i]-mysum$resid[i])
a<-table.element(a,mysum$resid[i])
a<-table.row.end(a)
}
a<-table.end(a)
table.save(a,file='mytable4.tab')
if (n > n25) {
a<-table.start()
a<-table.row.start(a)
a<-table.element(a,'Goldfeld-Quandt test for Heteroskedasticity',4,TRUE)
a<-table.row.end(a)
a<-table.row.start(a)
a<-table.element(a,'p-values',header=TRUE)
a<-table.element(a,'Alternative Hypothesis',3,header=TRUE)
a<-table.row.end(a)
a<-table.row.start(a)
a<-table.element(a,'breakpoint index',header=TRUE)
a<-table.element(a,'greater',header=TRUE)
a<-table.element(a,'2-sided',header=TRUE)
a<-table.element(a,'less',header=TRUE)
a<-table.row.end(a)
for (mypoint in kp3:nmkm3) {
a<-table.row.start(a)
a<-table.element(a,mypoint,header=TRUE)
a<-table.element(a,gqarr[mypoint-kp3+1,1])
a<-table.element(a,gqarr[mypoint-kp3+1,2])
a<-table.element(a,gqarr[mypoint-kp3+1,3])
a<-table.row.end(a)
}
a<-table.end(a)
table.save(a,file='mytable5.tab')
a<-table.start()
a<-table.row.start(a)
a<-table.element(a,'Meta Analysis of Goldfeld-Quandt test for Heteroskedasticity',4,TRUE)
a<-table.row.end(a)
a<-table.row.start(a)
a<-table.element(a,'Description',header=TRUE)
a<-table.element(a,'# significant tests',header=TRUE)
a<-table.element(a,'% significant tests',header=TRUE)
a<-table.element(a,'OK/NOK',header=TRUE)
a<-table.row.end(a)
a<-table.row.start(a)
a<-table.element(a,'1% type I error level',header=TRUE)
a<-table.element(a,numsignificant1)
a<-table.element(a,numsignificant1/numgqtests)
if (numsignificant1/numgqtests < 0.01) dum <- 'OK' else dum <- 'NOK'
a<-table.element(a,dum)
a<-table.row.end(a)
a<-table.row.start(a)
a<-table.element(a,'5% type I error level',header=TRUE)
a<-table.element(a,numsignificant5)
a<-table.element(a,numsignificant5/numgqtests)
if (numsignificant5/numgqtests < 0.05) dum <- 'OK' else dum <- 'NOK'
a<-table.element(a,dum)
a<-table.row.end(a)
a<-table.row.start(a)
a<-table.element(a,'10% type I error level',header=TRUE)
a<-table.element(a,numsignificant10)
a<-table.element(a,numsignificant10/numgqtests)
if (numsignificant10/numgqtests < 0.1) dum <- 'OK' else dum <- 'NOK'
a<-table.element(a,dum)
a<-table.row.end(a)
a<-table.end(a)
table.save(a,file='mytable6.tab')
}