Free Statistics

of Irreproducible Research!

Author's title

Author*Unverified author*
R Software Modulerwasp_autocorrelation.wasp
Title produced by software(Partial) Autocorrelation Function
Date of computationWed, 18 Aug 2010 18:17:33 +0000
Cite this page as followsStatistical Computations at FreeStatistics.org, Office for Research Development and Education, URL https://freestatistics.org/blog/index.php?v=date/2010/Aug/18/t1282155446uafb5kkii0hf21y.htm/, Retrieved Thu, 16 May 2024 20:56:29 +0000
Statistical Computations at FreeStatistics.org, Office for Research Development and Education, URL https://freestatistics.org/blog/index.php?pk=79214, Retrieved Thu, 16 May 2024 20:56:29 +0000
QR Codes:

Original text written by user:
IsPrivate?No (this computation is public)
User-defined keywordsPatrick Fieremans
Estimated Impact125
Family? (F = Feedback message, R = changed R code, M = changed R Module, P = changed Parameters, D = changed Data)
-       [(Partial) Autocorrelation Function] [Tijdreeks 2 - Sta...] [2010-08-18 18:17:33] [c9c054077df6495a4b48ba74c2b1bb38] [Current]
Feedback Forum

Post a new message
Dataseries X:
259
258
257
255
253
252
253
255
256
256
257
259
267
263
266
257
249
249
251
252
252
252
256
257
259
260
261
253
243
233
241
239
233
228
228
227
225
230
222
207
190
184
192
187
173
167
163
156
153
157
152
128
115
114
136
132
126
124
123
119
105
107
108
92
74
73
100
97
99
102
99
103
92
99
97
87
69
66
95
91
93
99
91
91


Summary of computational transaction
Raw Inputview raw input (R code)
Raw Outputview raw output of R engine
Computing time1 seconds
R Server'Gwilym Jenkins' @ 72.249.127.135

\begin{tabular}{lllllllll}
\hline
Summary of computational transaction \tabularnewline
Raw Input & view raw input (R code)  \tabularnewline
Raw Output & view raw output of R engine  \tabularnewline
Computing time & 1 seconds \tabularnewline
R Server & 'Gwilym Jenkins' @ 72.249.127.135 \tabularnewline
\hline
\end{tabular}
%Source: https://freestatistics.org/blog/index.php?pk=79214&T=0

[TABLE]
[ROW][C]Summary of computational transaction[/C][/ROW]
[ROW][C]Raw Input[/C][C]view raw input (R code) [/C][/ROW]
[ROW][C]Raw Output[/C][C]view raw output of R engine [/C][/ROW]
[ROW][C]Computing time[/C][C]1 seconds[/C][/ROW]
[ROW][C]R Server[/C][C]'Gwilym Jenkins' @ 72.249.127.135[/C][/ROW]
[/TABLE]
Source: https://freestatistics.org/blog/index.php?pk=79214&T=0

Globally Unique Identifier (entire table): ba.freestatistics.org/blog/index.php?pk=79214&T=0

As an alternative you can also use a QR Code:  

The GUIDs for individual cells are displayed in the table below:

Summary of computational transaction
Raw Inputview raw input (R code)
Raw Outputview raw output of R engine
Computing time1 seconds
R Server'Gwilym Jenkins' @ 72.249.127.135


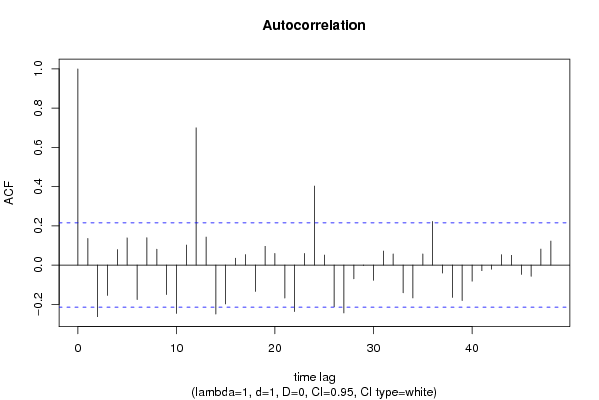
Autocorrelation Function
Time lag kACF(k)T-STATP-value
10.13581.23720.109752
2-0.263259-2.39840.009354
3-0.155012-1.41220.08081
40.0788080.7180.237394
50.1385121.26190.10526
6-0.176376-1.60690.055941
70.1397271.2730.10329
80.0807660.73580.23196
9-0.150481-1.37090.087044
10-0.246799-2.24840.013599
110.1015930.92560.178679
120.6999526.37690
130.1427981.30090.098438
14-0.250312-2.28040.012572
15-0.198644-1.80970.036979
160.0348590.31760.375799
170.0533290.48590.314175
18-0.134629-1.22650.111734
190.095770.87250.192724
200.0593920.54110.294947
21-0.168579-1.53580.064192
22-0.237211-2.16110.016785
230.0590340.53780.29607
240.4025523.66740.000216
250.050680.46170.322745
26-0.212253-1.93370.028278
27-0.244046-2.22340.014455
28-0.070543-0.64270.261103
29-0.002078-0.01890.49247
30-0.077997-0.71060.239665
310.0713320.64990.258786
320.0563410.51330.304556
33-0.141984-1.29350.099707
34-0.167639-1.52730.065249
350.056590.51560.303766
360.222352.02570.023004
37-0.040918-0.37280.355132
38-0.165586-1.50860.067604
39-0.181425-1.65290.051069
40-0.082442-0.75110.227364
41-0.02853-0.25990.397786
42-0.020915-0.19050.424675
430.0524980.47830.316853
440.0498730.45440.325378
45-0.047903-0.43640.331834
46-0.05762-0.52490.30051
470.0812710.74040.23057
480.1219871.11140.134813

\begin{tabular}{lllllllll}
\hline
Autocorrelation Function \tabularnewline
Time lag k & ACF(k) & T-STAT & P-value \tabularnewline
1 & 0.1358 & 1.2372 & 0.109752 \tabularnewline
2 & -0.263259 & -2.3984 & 0.009354 \tabularnewline
3 & -0.155012 & -1.4122 & 0.08081 \tabularnewline
4 & 0.078808 & 0.718 & 0.237394 \tabularnewline
5 & 0.138512 & 1.2619 & 0.10526 \tabularnewline
6 & -0.176376 & -1.6069 & 0.055941 \tabularnewline
7 & 0.139727 & 1.273 & 0.10329 \tabularnewline
8 & 0.080766 & 0.7358 & 0.23196 \tabularnewline
9 & -0.150481 & -1.3709 & 0.087044 \tabularnewline
10 & -0.246799 & -2.2484 & 0.013599 \tabularnewline
11 & 0.101593 & 0.9256 & 0.178679 \tabularnewline
12 & 0.699952 & 6.3769 & 0 \tabularnewline
13 & 0.142798 & 1.3009 & 0.098438 \tabularnewline
14 & -0.250312 & -2.2804 & 0.012572 \tabularnewline
15 & -0.198644 & -1.8097 & 0.036979 \tabularnewline
16 & 0.034859 & 0.3176 & 0.375799 \tabularnewline
17 & 0.053329 & 0.4859 & 0.314175 \tabularnewline
18 & -0.134629 & -1.2265 & 0.111734 \tabularnewline
19 & 0.09577 & 0.8725 & 0.192724 \tabularnewline
20 & 0.059392 & 0.5411 & 0.294947 \tabularnewline
21 & -0.168579 & -1.5358 & 0.064192 \tabularnewline
22 & -0.237211 & -2.1611 & 0.016785 \tabularnewline
23 & 0.059034 & 0.5378 & 0.29607 \tabularnewline
24 & 0.402552 & 3.6674 & 0.000216 \tabularnewline
25 & 0.05068 & 0.4617 & 0.322745 \tabularnewline
26 & -0.212253 & -1.9337 & 0.028278 \tabularnewline
27 & -0.244046 & -2.2234 & 0.014455 \tabularnewline
28 & -0.070543 & -0.6427 & 0.261103 \tabularnewline
29 & -0.002078 & -0.0189 & 0.49247 \tabularnewline
30 & -0.077997 & -0.7106 & 0.239665 \tabularnewline
31 & 0.071332 & 0.6499 & 0.258786 \tabularnewline
32 & 0.056341 & 0.5133 & 0.304556 \tabularnewline
33 & -0.141984 & -1.2935 & 0.099707 \tabularnewline
34 & -0.167639 & -1.5273 & 0.065249 \tabularnewline
35 & 0.05659 & 0.5156 & 0.303766 \tabularnewline
36 & 0.22235 & 2.0257 & 0.023004 \tabularnewline
37 & -0.040918 & -0.3728 & 0.355132 \tabularnewline
38 & -0.165586 & -1.5086 & 0.067604 \tabularnewline
39 & -0.181425 & -1.6529 & 0.051069 \tabularnewline
40 & -0.082442 & -0.7511 & 0.227364 \tabularnewline
41 & -0.02853 & -0.2599 & 0.397786 \tabularnewline
42 & -0.020915 & -0.1905 & 0.424675 \tabularnewline
43 & 0.052498 & 0.4783 & 0.316853 \tabularnewline
44 & 0.049873 & 0.4544 & 0.325378 \tabularnewline
45 & -0.047903 & -0.4364 & 0.331834 \tabularnewline
46 & -0.05762 & -0.5249 & 0.30051 \tabularnewline
47 & 0.081271 & 0.7404 & 0.23057 \tabularnewline
48 & 0.121987 & 1.1114 & 0.134813 \tabularnewline
\hline
\end{tabular}
%Source: https://freestatistics.org/blog/index.php?pk=79214&T=1

[TABLE]
[ROW][C]Autocorrelation Function[/C][/ROW]
[ROW][C]Time lag k[/C][C]ACF(k)[/C][C]T-STAT[/C][C]P-value[/C][/ROW]
[ROW][C]1[/C][C]0.1358[/C][C]1.2372[/C][C]0.109752[/C][/ROW]
[ROW][C]2[/C][C]-0.263259[/C][C]-2.3984[/C][C]0.009354[/C][/ROW]
[ROW][C]3[/C][C]-0.155012[/C][C]-1.4122[/C][C]0.08081[/C][/ROW]
[ROW][C]4[/C][C]0.078808[/C][C]0.718[/C][C]0.237394[/C][/ROW]
[ROW][C]5[/C][C]0.138512[/C][C]1.2619[/C][C]0.10526[/C][/ROW]
[ROW][C]6[/C][C]-0.176376[/C][C]-1.6069[/C][C]0.055941[/C][/ROW]
[ROW][C]7[/C][C]0.139727[/C][C]1.273[/C][C]0.10329[/C][/ROW]
[ROW][C]8[/C][C]0.080766[/C][C]0.7358[/C][C]0.23196[/C][/ROW]
[ROW][C]9[/C][C]-0.150481[/C][C]-1.3709[/C][C]0.087044[/C][/ROW]
[ROW][C]10[/C][C]-0.246799[/C][C]-2.2484[/C][C]0.013599[/C][/ROW]
[ROW][C]11[/C][C]0.101593[/C][C]0.9256[/C][C]0.178679[/C][/ROW]
[ROW][C]12[/C][C]0.699952[/C][C]6.3769[/C][C]0[/C][/ROW]
[ROW][C]13[/C][C]0.142798[/C][C]1.3009[/C][C]0.098438[/C][/ROW]
[ROW][C]14[/C][C]-0.250312[/C][C]-2.2804[/C][C]0.012572[/C][/ROW]
[ROW][C]15[/C][C]-0.198644[/C][C]-1.8097[/C][C]0.036979[/C][/ROW]
[ROW][C]16[/C][C]0.034859[/C][C]0.3176[/C][C]0.375799[/C][/ROW]
[ROW][C]17[/C][C]0.053329[/C][C]0.4859[/C][C]0.314175[/C][/ROW]
[ROW][C]18[/C][C]-0.134629[/C][C]-1.2265[/C][C]0.111734[/C][/ROW]
[ROW][C]19[/C][C]0.09577[/C][C]0.8725[/C][C]0.192724[/C][/ROW]
[ROW][C]20[/C][C]0.059392[/C][C]0.5411[/C][C]0.294947[/C][/ROW]
[ROW][C]21[/C][C]-0.168579[/C][C]-1.5358[/C][C]0.064192[/C][/ROW]
[ROW][C]22[/C][C]-0.237211[/C][C]-2.1611[/C][C]0.016785[/C][/ROW]
[ROW][C]23[/C][C]0.059034[/C][C]0.5378[/C][C]0.29607[/C][/ROW]
[ROW][C]24[/C][C]0.402552[/C][C]3.6674[/C][C]0.000216[/C][/ROW]
[ROW][C]25[/C][C]0.05068[/C][C]0.4617[/C][C]0.322745[/C][/ROW]
[ROW][C]26[/C][C]-0.212253[/C][C]-1.9337[/C][C]0.028278[/C][/ROW]
[ROW][C]27[/C][C]-0.244046[/C][C]-2.2234[/C][C]0.014455[/C][/ROW]
[ROW][C]28[/C][C]-0.070543[/C][C]-0.6427[/C][C]0.261103[/C][/ROW]
[ROW][C]29[/C][C]-0.002078[/C][C]-0.0189[/C][C]0.49247[/C][/ROW]
[ROW][C]30[/C][C]-0.077997[/C][C]-0.7106[/C][C]0.239665[/C][/ROW]
[ROW][C]31[/C][C]0.071332[/C][C]0.6499[/C][C]0.258786[/C][/ROW]
[ROW][C]32[/C][C]0.056341[/C][C]0.5133[/C][C]0.304556[/C][/ROW]
[ROW][C]33[/C][C]-0.141984[/C][C]-1.2935[/C][C]0.099707[/C][/ROW]
[ROW][C]34[/C][C]-0.167639[/C][C]-1.5273[/C][C]0.065249[/C][/ROW]
[ROW][C]35[/C][C]0.05659[/C][C]0.5156[/C][C]0.303766[/C][/ROW]
[ROW][C]36[/C][C]0.22235[/C][C]2.0257[/C][C]0.023004[/C][/ROW]
[ROW][C]37[/C][C]-0.040918[/C][C]-0.3728[/C][C]0.355132[/C][/ROW]
[ROW][C]38[/C][C]-0.165586[/C][C]-1.5086[/C][C]0.067604[/C][/ROW]
[ROW][C]39[/C][C]-0.181425[/C][C]-1.6529[/C][C]0.051069[/C][/ROW]
[ROW][C]40[/C][C]-0.082442[/C][C]-0.7511[/C][C]0.227364[/C][/ROW]
[ROW][C]41[/C][C]-0.02853[/C][C]-0.2599[/C][C]0.397786[/C][/ROW]
[ROW][C]42[/C][C]-0.020915[/C][C]-0.1905[/C][C]0.424675[/C][/ROW]
[ROW][C]43[/C][C]0.052498[/C][C]0.4783[/C][C]0.316853[/C][/ROW]
[ROW][C]44[/C][C]0.049873[/C][C]0.4544[/C][C]0.325378[/C][/ROW]
[ROW][C]45[/C][C]-0.047903[/C][C]-0.4364[/C][C]0.331834[/C][/ROW]
[ROW][C]46[/C][C]-0.05762[/C][C]-0.5249[/C][C]0.30051[/C][/ROW]
[ROW][C]47[/C][C]0.081271[/C][C]0.7404[/C][C]0.23057[/C][/ROW]
[ROW][C]48[/C][C]0.121987[/C][C]1.1114[/C][C]0.134813[/C][/ROW]
[/TABLE]
Source: https://freestatistics.org/blog/index.php?pk=79214&T=1

Globally Unique Identifier (entire table): ba.freestatistics.org/blog/index.php?pk=79214&T=1

As an alternative you can also use a QR Code:  

The GUIDs for individual cells are displayed in the table below:

Autocorrelation Function
Time lag kACF(k)T-STATP-value
10.13581.23720.109752
2-0.263259-2.39840.009354
3-0.155012-1.41220.08081
40.0788080.7180.237394
50.1385121.26190.10526
6-0.176376-1.60690.055941
70.1397271.2730.10329
80.0807660.73580.23196
9-0.150481-1.37090.087044
10-0.246799-2.24840.013599
110.1015930.92560.178679
120.6999526.37690
130.1427981.30090.098438
14-0.250312-2.28040.012572
15-0.198644-1.80970.036979
160.0348590.31760.375799
170.0533290.48590.314175
18-0.134629-1.22650.111734
190.095770.87250.192724
200.0593920.54110.294947
21-0.168579-1.53580.064192
22-0.237211-2.16110.016785
230.0590340.53780.29607
240.4025523.66740.000216
250.050680.46170.322745
26-0.212253-1.93370.028278
27-0.244046-2.22340.014455
28-0.070543-0.64270.261103
29-0.002078-0.01890.49247
30-0.077997-0.71060.239665
310.0713320.64990.258786
320.0563410.51330.304556
33-0.141984-1.29350.099707
34-0.167639-1.52730.065249
350.056590.51560.303766
360.222352.02570.023004
37-0.040918-0.37280.355132
38-0.165586-1.50860.067604
39-0.181425-1.65290.051069
40-0.082442-0.75110.227364
41-0.02853-0.25990.397786
42-0.020915-0.19050.424675
430.0524980.47830.316853
440.0498730.45440.325378
45-0.047903-0.43640.331834
46-0.05762-0.52490.30051
470.0812710.74040.23057
480.1219871.11140.134813


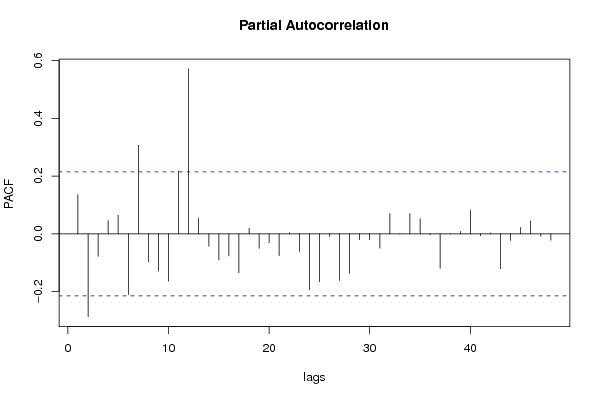
Partial Autocorrelation Function
Time lag kPACF(k)T-STATP-value
10.13581.23720.109752
2-0.286993-2.61460.005303
3-0.077747-0.70830.240368
40.0458220.41750.338711
50.0640790.58380.280474
6-0.210475-1.91750.029306
70.307052.79740.003201
8-0.096426-0.87850.191109
9-0.129611-1.18080.120526
10-0.164206-1.4960.069225
110.2179691.98580.025179
120.5714975.20661e-06
130.0544480.4960.310588
14-0.043043-0.39210.347978
15-0.090578-0.82520.205811
16-0.076415-0.69620.244132
17-0.135039-1.23030.111037
180.0197420.17990.428853
19-0.050305-0.45830.323969
20-0.030516-0.2780.390845
21-0.07522-0.68530.247535
220.0038920.03550.4859
23-0.061094-0.55660.289652
24-0.194041-1.76780.040385
25-0.166001-1.51230.067123
26-0.009149-0.08330.466887
27-0.161655-1.47270.0723
28-0.136967-1.24780.107802
29-0.020174-0.18380.427313
30-0.020247-0.18450.427053
31-0.049738-0.45310.325816
320.0702830.64030.261867
33-0.00028-0.00260.498985
340.0704510.64180.261373
350.0523840.47720.317223
36-0.002727-0.02480.490118
37-0.11944-1.08810.13984
380.0019970.01820.492764
390.0082140.07480.470262
400.0819290.74640.228763
41-0.006447-0.05870.476652
420.0027890.02540.489894
43-0.121375-1.10580.136009
44-0.022697-0.20680.418345
450.0222390.20260.419969
460.0449280.40930.341681
47-0.008756-0.07980.468305
48-0.021982-0.20030.420882

\begin{tabular}{lllllllll}
\hline
Partial Autocorrelation Function \tabularnewline
Time lag k & PACF(k) & T-STAT & P-value \tabularnewline
1 & 0.1358 & 1.2372 & 0.109752 \tabularnewline
2 & -0.286993 & -2.6146 & 0.005303 \tabularnewline
3 & -0.077747 & -0.7083 & 0.240368 \tabularnewline
4 & 0.045822 & 0.4175 & 0.338711 \tabularnewline
5 & 0.064079 & 0.5838 & 0.280474 \tabularnewline
6 & -0.210475 & -1.9175 & 0.029306 \tabularnewline
7 & 0.30705 & 2.7974 & 0.003201 \tabularnewline
8 & -0.096426 & -0.8785 & 0.191109 \tabularnewline
9 & -0.129611 & -1.1808 & 0.120526 \tabularnewline
10 & -0.164206 & -1.496 & 0.069225 \tabularnewline
11 & 0.217969 & 1.9858 & 0.025179 \tabularnewline
12 & 0.571497 & 5.2066 & 1e-06 \tabularnewline
13 & 0.054448 & 0.496 & 0.310588 \tabularnewline
14 & -0.043043 & -0.3921 & 0.347978 \tabularnewline
15 & -0.090578 & -0.8252 & 0.205811 \tabularnewline
16 & -0.076415 & -0.6962 & 0.244132 \tabularnewline
17 & -0.135039 & -1.2303 & 0.111037 \tabularnewline
18 & 0.019742 & 0.1799 & 0.428853 \tabularnewline
19 & -0.050305 & -0.4583 & 0.323969 \tabularnewline
20 & -0.030516 & -0.278 & 0.390845 \tabularnewline
21 & -0.07522 & -0.6853 & 0.247535 \tabularnewline
22 & 0.003892 & 0.0355 & 0.4859 \tabularnewline
23 & -0.061094 & -0.5566 & 0.289652 \tabularnewline
24 & -0.194041 & -1.7678 & 0.040385 \tabularnewline
25 & -0.166001 & -1.5123 & 0.067123 \tabularnewline
26 & -0.009149 & -0.0833 & 0.466887 \tabularnewline
27 & -0.161655 & -1.4727 & 0.0723 \tabularnewline
28 & -0.136967 & -1.2478 & 0.107802 \tabularnewline
29 & -0.020174 & -0.1838 & 0.427313 \tabularnewline
30 & -0.020247 & -0.1845 & 0.427053 \tabularnewline
31 & -0.049738 & -0.4531 & 0.325816 \tabularnewline
32 & 0.070283 & 0.6403 & 0.261867 \tabularnewline
33 & -0.00028 & -0.0026 & 0.498985 \tabularnewline
34 & 0.070451 & 0.6418 & 0.261373 \tabularnewline
35 & 0.052384 & 0.4772 & 0.317223 \tabularnewline
36 & -0.002727 & -0.0248 & 0.490118 \tabularnewline
37 & -0.11944 & -1.0881 & 0.13984 \tabularnewline
38 & 0.001997 & 0.0182 & 0.492764 \tabularnewline
39 & 0.008214 & 0.0748 & 0.470262 \tabularnewline
40 & 0.081929 & 0.7464 & 0.228763 \tabularnewline
41 & -0.006447 & -0.0587 & 0.476652 \tabularnewline
42 & 0.002789 & 0.0254 & 0.489894 \tabularnewline
43 & -0.121375 & -1.1058 & 0.136009 \tabularnewline
44 & -0.022697 & -0.2068 & 0.418345 \tabularnewline
45 & 0.022239 & 0.2026 & 0.419969 \tabularnewline
46 & 0.044928 & 0.4093 & 0.341681 \tabularnewline
47 & -0.008756 & -0.0798 & 0.468305 \tabularnewline
48 & -0.021982 & -0.2003 & 0.420882 \tabularnewline
\hline
\end{tabular}
%Source: https://freestatistics.org/blog/index.php?pk=79214&T=2

[TABLE]
[ROW][C]Partial Autocorrelation Function[/C][/ROW]
[ROW][C]Time lag k[/C][C]PACF(k)[/C][C]T-STAT[/C][C]P-value[/C][/ROW]
[ROW][C]1[/C][C]0.1358[/C][C]1.2372[/C][C]0.109752[/C][/ROW]
[ROW][C]2[/C][C]-0.286993[/C][C]-2.6146[/C][C]0.005303[/C][/ROW]
[ROW][C]3[/C][C]-0.077747[/C][C]-0.7083[/C][C]0.240368[/C][/ROW]
[ROW][C]4[/C][C]0.045822[/C][C]0.4175[/C][C]0.338711[/C][/ROW]
[ROW][C]5[/C][C]0.064079[/C][C]0.5838[/C][C]0.280474[/C][/ROW]
[ROW][C]6[/C][C]-0.210475[/C][C]-1.9175[/C][C]0.029306[/C][/ROW]
[ROW][C]7[/C][C]0.30705[/C][C]2.7974[/C][C]0.003201[/C][/ROW]
[ROW][C]8[/C][C]-0.096426[/C][C]-0.8785[/C][C]0.191109[/C][/ROW]
[ROW][C]9[/C][C]-0.129611[/C][C]-1.1808[/C][C]0.120526[/C][/ROW]
[ROW][C]10[/C][C]-0.164206[/C][C]-1.496[/C][C]0.069225[/C][/ROW]
[ROW][C]11[/C][C]0.217969[/C][C]1.9858[/C][C]0.025179[/C][/ROW]
[ROW][C]12[/C][C]0.571497[/C][C]5.2066[/C][C]1e-06[/C][/ROW]
[ROW][C]13[/C][C]0.054448[/C][C]0.496[/C][C]0.310588[/C][/ROW]
[ROW][C]14[/C][C]-0.043043[/C][C]-0.3921[/C][C]0.347978[/C][/ROW]
[ROW][C]15[/C][C]-0.090578[/C][C]-0.8252[/C][C]0.205811[/C][/ROW]
[ROW][C]16[/C][C]-0.076415[/C][C]-0.6962[/C][C]0.244132[/C][/ROW]
[ROW][C]17[/C][C]-0.135039[/C][C]-1.2303[/C][C]0.111037[/C][/ROW]
[ROW][C]18[/C][C]0.019742[/C][C]0.1799[/C][C]0.428853[/C][/ROW]
[ROW][C]19[/C][C]-0.050305[/C][C]-0.4583[/C][C]0.323969[/C][/ROW]
[ROW][C]20[/C][C]-0.030516[/C][C]-0.278[/C][C]0.390845[/C][/ROW]
[ROW][C]21[/C][C]-0.07522[/C][C]-0.6853[/C][C]0.247535[/C][/ROW]
[ROW][C]22[/C][C]0.003892[/C][C]0.0355[/C][C]0.4859[/C][/ROW]
[ROW][C]23[/C][C]-0.061094[/C][C]-0.5566[/C][C]0.289652[/C][/ROW]
[ROW][C]24[/C][C]-0.194041[/C][C]-1.7678[/C][C]0.040385[/C][/ROW]
[ROW][C]25[/C][C]-0.166001[/C][C]-1.5123[/C][C]0.067123[/C][/ROW]
[ROW][C]26[/C][C]-0.009149[/C][C]-0.0833[/C][C]0.466887[/C][/ROW]
[ROW][C]27[/C][C]-0.161655[/C][C]-1.4727[/C][C]0.0723[/C][/ROW]
[ROW][C]28[/C][C]-0.136967[/C][C]-1.2478[/C][C]0.107802[/C][/ROW]
[ROW][C]29[/C][C]-0.020174[/C][C]-0.1838[/C][C]0.427313[/C][/ROW]
[ROW][C]30[/C][C]-0.020247[/C][C]-0.1845[/C][C]0.427053[/C][/ROW]
[ROW][C]31[/C][C]-0.049738[/C][C]-0.4531[/C][C]0.325816[/C][/ROW]
[ROW][C]32[/C][C]0.070283[/C][C]0.6403[/C][C]0.261867[/C][/ROW]
[ROW][C]33[/C][C]-0.00028[/C][C]-0.0026[/C][C]0.498985[/C][/ROW]
[ROW][C]34[/C][C]0.070451[/C][C]0.6418[/C][C]0.261373[/C][/ROW]
[ROW][C]35[/C][C]0.052384[/C][C]0.4772[/C][C]0.317223[/C][/ROW]
[ROW][C]36[/C][C]-0.002727[/C][C]-0.0248[/C][C]0.490118[/C][/ROW]
[ROW][C]37[/C][C]-0.11944[/C][C]-1.0881[/C][C]0.13984[/C][/ROW]
[ROW][C]38[/C][C]0.001997[/C][C]0.0182[/C][C]0.492764[/C][/ROW]
[ROW][C]39[/C][C]0.008214[/C][C]0.0748[/C][C]0.470262[/C][/ROW]
[ROW][C]40[/C][C]0.081929[/C][C]0.7464[/C][C]0.228763[/C][/ROW]
[ROW][C]41[/C][C]-0.006447[/C][C]-0.0587[/C][C]0.476652[/C][/ROW]
[ROW][C]42[/C][C]0.002789[/C][C]0.0254[/C][C]0.489894[/C][/ROW]
[ROW][C]43[/C][C]-0.121375[/C][C]-1.1058[/C][C]0.136009[/C][/ROW]
[ROW][C]44[/C][C]-0.022697[/C][C]-0.2068[/C][C]0.418345[/C][/ROW]
[ROW][C]45[/C][C]0.022239[/C][C]0.2026[/C][C]0.419969[/C][/ROW]
[ROW][C]46[/C][C]0.044928[/C][C]0.4093[/C][C]0.341681[/C][/ROW]
[ROW][C]47[/C][C]-0.008756[/C][C]-0.0798[/C][C]0.468305[/C][/ROW]
[ROW][C]48[/C][C]-0.021982[/C][C]-0.2003[/C][C]0.420882[/C][/ROW]
[/TABLE]
Source: https://freestatistics.org/blog/index.php?pk=79214&T=2

Globally Unique Identifier (entire table): ba.freestatistics.org/blog/index.php?pk=79214&T=2

As an alternative you can also use a QR Code:  

The GUIDs for individual cells are displayed in the table below:

Partial Autocorrelation Function
Time lag kPACF(k)T-STATP-value
10.13581.23720.109752
2-0.286993-2.61460.005303
3-0.077747-0.70830.240368
40.0458220.41750.338711
50.0640790.58380.280474
6-0.210475-1.91750.029306
70.307052.79740.003201
8-0.096426-0.87850.191109
9-0.129611-1.18080.120526
10-0.164206-1.4960.069225
110.2179691.98580.025179
120.5714975.20661e-06
130.0544480.4960.310588
14-0.043043-0.39210.347978
15-0.090578-0.82520.205811
16-0.076415-0.69620.244132
17-0.135039-1.23030.111037
180.0197420.17990.428853
19-0.050305-0.45830.323969
20-0.030516-0.2780.390845
21-0.07522-0.68530.247535
220.0038920.03550.4859
23-0.061094-0.55660.289652
24-0.194041-1.76780.040385
25-0.166001-1.51230.067123
26-0.009149-0.08330.466887
27-0.161655-1.47270.0723
28-0.136967-1.24780.107802
29-0.020174-0.18380.427313
30-0.020247-0.18450.427053
31-0.049738-0.45310.325816
320.0702830.64030.261867
33-0.00028-0.00260.498985
340.0704510.64180.261373
350.0523840.47720.317223
36-0.002727-0.02480.490118
37-0.11944-1.08810.13984
380.0019970.01820.492764
390.0082140.07480.470262
400.0819290.74640.228763
41-0.006447-0.05870.476652
420.0027890.02540.489894
43-0.121375-1.10580.136009
44-0.022697-0.20680.418345
450.0222390.20260.419969
460.0449280.40930.341681
47-0.008756-0.07980.468305
48-0.021982-0.20030.420882


Parameters (Session):
par1 = 48 ; par2 = 1 ; par3 = 1 ; par4 = 0 ; par5 = 12 ; par6 = White Noise ; par7 = 0.95 ;
Parameters (R input):
par1 = 48 ; par2 = 1 ; par3 = 1 ; par4 = 0 ; par5 = 12 ; par6 = White Noise ; par7 = 0.95 ;
R code (references can be found in the software module):
if (par1 == 'Default') {
par1 = 10*log10(length(x))
} else {
par1 <- as.numeric(par1)
}
par2 <- as.numeric(par2)
par3 <- as.numeric(par3)
par4 <- as.numeric(par4)
par5 <- as.numeric(par5)
if (par6 == 'White Noise') par6 <- 'white' else par6 <- 'ma'
par7 <- as.numeric(par7)
if (par2 == 0) {
x <- log(x)
} else {
x <- (x ^ par2 - 1) / par2
}
if (par3 > 0) x <- diff(x,lag=1,difference=par3)
if (par4 > 0) x <- diff(x,lag=par5,difference=par4)
bitmap(file='pic1.png')
racf <- acf(x, par1, main='Autocorrelation', xlab='time lag', ylab='ACF', ci.type=par6, ci=par7, sub=paste('(lambda=',par2,', d=',par3,', D=',par4,', CI=', par7, ', CI type=',par6,')',sep=''))
dev.off()
bitmap(file='pic2.png')
rpacf <- pacf(x,par1,main='Partial Autocorrelation',xlab='lags',ylab='PACF')
dev.off()
(myacf <- c(racf$acf))
(mypacf <- c(rpacf$acf))
lengthx <- length(x)
sqrtn <- sqrt(lengthx)
load(file='createtable')
a<-table.start()
a<-table.row.start(a)
a<-table.element(a,'Autocorrelation Function',4,TRUE)
a<-table.row.end(a)
a<-table.row.start(a)
a<-table.element(a,'Time lag k',header=TRUE)
a<-table.element(a,hyperlink('basics.htm','ACF(k)','click here for more information about the Autocorrelation Function'),header=TRUE)
a<-table.element(a,'T-STAT',header=TRUE)
a<-table.element(a,'P-value',header=TRUE)
a<-table.row.end(a)
for (i in 2:(par1+1)) {
a<-table.row.start(a)
a<-table.element(a,i-1,header=TRUE)
a<-table.element(a,round(myacf[i],6))
mytstat <- myacf[i]*sqrtn
a<-table.element(a,round(mytstat,4))
a<-table.element(a,round(1-pt(abs(mytstat),lengthx),6))
a<-table.row.end(a)
}
a<-table.end(a)
table.save(a,file='mytable.tab')
a<-table.start()
a<-table.row.start(a)
a<-table.element(a,'Partial Autocorrelation Function',4,TRUE)
a<-table.row.end(a)
a<-table.row.start(a)
a<-table.element(a,'Time lag k',header=TRUE)
a<-table.element(a,hyperlink('basics.htm','PACF(k)','click here for more information about the Partial Autocorrelation Function'),header=TRUE)
a<-table.element(a,'T-STAT',header=TRUE)
a<-table.element(a,'P-value',header=TRUE)
a<-table.row.end(a)
for (i in 1:par1) {
a<-table.row.start(a)
a<-table.element(a,i,header=TRUE)
a<-table.element(a,round(mypacf[i],6))
mytstat <- mypacf[i]*sqrtn
a<-table.element(a,round(mytstat,4))
a<-table.element(a,round(1-pt(abs(mytstat),lengthx),6))
a<-table.row.end(a)
}
a<-table.end(a)
table.save(a,file='mytable1.tab')