Free Statistics

of Irreproducible Research!

Author's title

Author*Unverified author*
R Software Modulerwasp_autocorrelation.wasp
Title produced by software(Partial) Autocorrelation Function
Date of computationWed, 18 Aug 2010 18:15:26 +0000
Cite this page as followsStatistical Computations at FreeStatistics.org, Office for Research Development and Education, URL https://freestatistics.org/blog/index.php?v=date/2010/Aug/18/t12821552984ok05fa94oi08oz.htm/, Retrieved Thu, 16 May 2024 21:25:00 +0000
Statistical Computations at FreeStatistics.org, Office for Research Development and Education, URL https://freestatistics.org/blog/index.php?pk=79212, Retrieved Thu, 16 May 2024 21:25:00 +0000
QR Codes:

Original text written by user:
IsPrivate?No (this computation is public)
User-defined keywordsPatrick Fieremans
Estimated Impact120
Family? (F = Feedback message, R = changed R code, M = changed R Module, P = changed Parameters, D = changed Data)
-       [(Partial) Autocorrelation Function] [Tijdreeks 2 - Sta...] [2010-08-18 18:15:26] [ad57e680f18cfe8dd712ed1113a582da] [Current]
Feedback Forum

Post a new message
Dataseries X:
259
258
257
255
253
252
253
255
256
256
257
259
267
263
266
257
249
249
251
252
252
252
256
257
259
260
261
253
243
233
241
239
233
228
228
227
225
230
222
207
190
184
192
187
173
167
163
156
153
157
152
128
115
114
136
132
126
124
123
119
105
107
108
92
74
73
100
97
99
102
99
103
92
99
97
87
69
66
95
91
93
99
91
91


Summary of computational transaction
Raw Inputview raw input (R code)
Raw Outputview raw output of R engine
Computing time3 seconds
R Server'Gwilym Jenkins' @ 72.249.127.135

\begin{tabular}{lllllllll}
\hline
Summary of computational transaction \tabularnewline
Raw Input & view raw input (R code)  \tabularnewline
Raw Output & view raw output of R engine  \tabularnewline
Computing time & 3 seconds \tabularnewline
R Server & 'Gwilym Jenkins' @ 72.249.127.135 \tabularnewline
\hline
\end{tabular}
%Source: https://freestatistics.org/blog/index.php?pk=79212&T=0

[TABLE]
[ROW][C]Summary of computational transaction[/C][/ROW]
[ROW][C]Raw Input[/C][C]view raw input (R code) [/C][/ROW]
[ROW][C]Raw Output[/C][C]view raw output of R engine [/C][/ROW]
[ROW][C]Computing time[/C][C]3 seconds[/C][/ROW]
[ROW][C]R Server[/C][C]'Gwilym Jenkins' @ 72.249.127.135[/C][/ROW]
[/TABLE]
Source: https://freestatistics.org/blog/index.php?pk=79212&T=0

Globally Unique Identifier (entire table): ba.freestatistics.org/blog/index.php?pk=79212&T=0

As an alternative you can also use a QR Code:  

The GUIDs for individual cells are displayed in the table below:

Summary of computational transaction
Raw Inputview raw input (R code)
Raw Outputview raw output of R engine
Computing time3 seconds
R Server'Gwilym Jenkins' @ 72.249.127.135


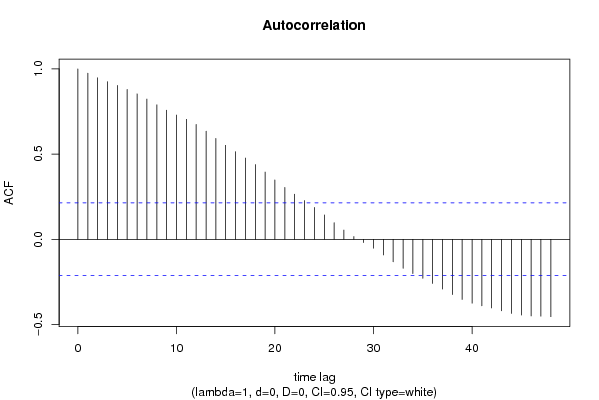
Autocorrelation Function
Time lag kACF(k)T-STATP-value
10.9752418.93820
20.9479098.68770
30.9254548.48190
40.9034548.28030
50.8794448.06020
60.8537017.82430
70.8229917.54280
80.7895787.23660
90.7578266.94560
100.7295156.68610
110.704086.4530
120.6743646.18060
130.6346265.81640
140.5918175.42410
150.5516995.05641e-06
160.5145484.71595e-06
170.4770894.37261.7e-05
180.438624.026.3e-05
190.3947583.6180.000253
200.3484953.1940.000988
210.3043132.78910.003269
220.2650872.42960.008624
230.22732.08320.020135
240.187071.71450.04506
250.1428461.30920.097017
260.0976560.8950.186663
270.0545780.50020.309117
280.016040.1470.441737
29-0.019102-0.17510.430722
30-0.052199-0.47840.316801
31-0.091423-0.83790.20223
32-0.131982-1.20960.114906
33-0.170204-1.55990.061266
34-0.200936-1.84160.034531
35-0.228886-2.09780.019465
36-0.259032-2.37410.009937
37-0.292004-2.67630.004475
38-0.324528-2.97430.001916
39-0.352946-3.23480.000871
40-0.375166-3.43850.000456
41-0.390332-3.57750.00029
42-0.403226-3.69560.000195
43-0.419551-3.84520.000117
44-0.434775-3.98487.2e-05
45-0.444605-4.07495.2e-05
46-0.449524-4.124.4e-05
47-0.451247-4.13574.2e-05
48-0.454002-4.1613.8e-05

\begin{tabular}{lllllllll}
\hline
Autocorrelation Function \tabularnewline
Time lag k & ACF(k) & T-STAT & P-value \tabularnewline
1 & 0.975241 & 8.9382 & 0 \tabularnewline
2 & 0.947909 & 8.6877 & 0 \tabularnewline
3 & 0.925454 & 8.4819 & 0 \tabularnewline
4 & 0.903454 & 8.2803 & 0 \tabularnewline
5 & 0.879444 & 8.0602 & 0 \tabularnewline
6 & 0.853701 & 7.8243 & 0 \tabularnewline
7 & 0.822991 & 7.5428 & 0 \tabularnewline
8 & 0.789578 & 7.2366 & 0 \tabularnewline
9 & 0.757826 & 6.9456 & 0 \tabularnewline
10 & 0.729515 & 6.6861 & 0 \tabularnewline
11 & 0.70408 & 6.453 & 0 \tabularnewline
12 & 0.674364 & 6.1806 & 0 \tabularnewline
13 & 0.634626 & 5.8164 & 0 \tabularnewline
14 & 0.591817 & 5.4241 & 0 \tabularnewline
15 & 0.551699 & 5.0564 & 1e-06 \tabularnewline
16 & 0.514548 & 4.7159 & 5e-06 \tabularnewline
17 & 0.477089 & 4.3726 & 1.7e-05 \tabularnewline
18 & 0.43862 & 4.02 & 6.3e-05 \tabularnewline
19 & 0.394758 & 3.618 & 0.000253 \tabularnewline
20 & 0.348495 & 3.194 & 0.000988 \tabularnewline
21 & 0.304313 & 2.7891 & 0.003269 \tabularnewline
22 & 0.265087 & 2.4296 & 0.008624 \tabularnewline
23 & 0.2273 & 2.0832 & 0.020135 \tabularnewline
24 & 0.18707 & 1.7145 & 0.04506 \tabularnewline
25 & 0.142846 & 1.3092 & 0.097017 \tabularnewline
26 & 0.097656 & 0.895 & 0.186663 \tabularnewline
27 & 0.054578 & 0.5002 & 0.309117 \tabularnewline
28 & 0.01604 & 0.147 & 0.441737 \tabularnewline
29 & -0.019102 & -0.1751 & 0.430722 \tabularnewline
30 & -0.052199 & -0.4784 & 0.316801 \tabularnewline
31 & -0.091423 & -0.8379 & 0.20223 \tabularnewline
32 & -0.131982 & -1.2096 & 0.114906 \tabularnewline
33 & -0.170204 & -1.5599 & 0.061266 \tabularnewline
34 & -0.200936 & -1.8416 & 0.034531 \tabularnewline
35 & -0.228886 & -2.0978 & 0.019465 \tabularnewline
36 & -0.259032 & -2.3741 & 0.009937 \tabularnewline
37 & -0.292004 & -2.6763 & 0.004475 \tabularnewline
38 & -0.324528 & -2.9743 & 0.001916 \tabularnewline
39 & -0.352946 & -3.2348 & 0.000871 \tabularnewline
40 & -0.375166 & -3.4385 & 0.000456 \tabularnewline
41 & -0.390332 & -3.5775 & 0.00029 \tabularnewline
42 & -0.403226 & -3.6956 & 0.000195 \tabularnewline
43 & -0.419551 & -3.8452 & 0.000117 \tabularnewline
44 & -0.434775 & -3.9848 & 7.2e-05 \tabularnewline
45 & -0.444605 & -4.0749 & 5.2e-05 \tabularnewline
46 & -0.449524 & -4.12 & 4.4e-05 \tabularnewline
47 & -0.451247 & -4.1357 & 4.2e-05 \tabularnewline
48 & -0.454002 & -4.161 & 3.8e-05 \tabularnewline
\hline
\end{tabular}
%Source: https://freestatistics.org/blog/index.php?pk=79212&T=1

[TABLE]
[ROW][C]Autocorrelation Function[/C][/ROW]
[ROW][C]Time lag k[/C][C]ACF(k)[/C][C]T-STAT[/C][C]P-value[/C][/ROW]
[ROW][C]1[/C][C]0.975241[/C][C]8.9382[/C][C]0[/C][/ROW]
[ROW][C]2[/C][C]0.947909[/C][C]8.6877[/C][C]0[/C][/ROW]
[ROW][C]3[/C][C]0.925454[/C][C]8.4819[/C][C]0[/C][/ROW]
[ROW][C]4[/C][C]0.903454[/C][C]8.2803[/C][C]0[/C][/ROW]
[ROW][C]5[/C][C]0.879444[/C][C]8.0602[/C][C]0[/C][/ROW]
[ROW][C]6[/C][C]0.853701[/C][C]7.8243[/C][C]0[/C][/ROW]
[ROW][C]7[/C][C]0.822991[/C][C]7.5428[/C][C]0[/C][/ROW]
[ROW][C]8[/C][C]0.789578[/C][C]7.2366[/C][C]0[/C][/ROW]
[ROW][C]9[/C][C]0.757826[/C][C]6.9456[/C][C]0[/C][/ROW]
[ROW][C]10[/C][C]0.729515[/C][C]6.6861[/C][C]0[/C][/ROW]
[ROW][C]11[/C][C]0.70408[/C][C]6.453[/C][C]0[/C][/ROW]
[ROW][C]12[/C][C]0.674364[/C][C]6.1806[/C][C]0[/C][/ROW]
[ROW][C]13[/C][C]0.634626[/C][C]5.8164[/C][C]0[/C][/ROW]
[ROW][C]14[/C][C]0.591817[/C][C]5.4241[/C][C]0[/C][/ROW]
[ROW][C]15[/C][C]0.551699[/C][C]5.0564[/C][C]1e-06[/C][/ROW]
[ROW][C]16[/C][C]0.514548[/C][C]4.7159[/C][C]5e-06[/C][/ROW]
[ROW][C]17[/C][C]0.477089[/C][C]4.3726[/C][C]1.7e-05[/C][/ROW]
[ROW][C]18[/C][C]0.43862[/C][C]4.02[/C][C]6.3e-05[/C][/ROW]
[ROW][C]19[/C][C]0.394758[/C][C]3.618[/C][C]0.000253[/C][/ROW]
[ROW][C]20[/C][C]0.348495[/C][C]3.194[/C][C]0.000988[/C][/ROW]
[ROW][C]21[/C][C]0.304313[/C][C]2.7891[/C][C]0.003269[/C][/ROW]
[ROW][C]22[/C][C]0.265087[/C][C]2.4296[/C][C]0.008624[/C][/ROW]
[ROW][C]23[/C][C]0.2273[/C][C]2.0832[/C][C]0.020135[/C][/ROW]
[ROW][C]24[/C][C]0.18707[/C][C]1.7145[/C][C]0.04506[/C][/ROW]
[ROW][C]25[/C][C]0.142846[/C][C]1.3092[/C][C]0.097017[/C][/ROW]
[ROW][C]26[/C][C]0.097656[/C][C]0.895[/C][C]0.186663[/C][/ROW]
[ROW][C]27[/C][C]0.054578[/C][C]0.5002[/C][C]0.309117[/C][/ROW]
[ROW][C]28[/C][C]0.01604[/C][C]0.147[/C][C]0.441737[/C][/ROW]
[ROW][C]29[/C][C]-0.019102[/C][C]-0.1751[/C][C]0.430722[/C][/ROW]
[ROW][C]30[/C][C]-0.052199[/C][C]-0.4784[/C][C]0.316801[/C][/ROW]
[ROW][C]31[/C][C]-0.091423[/C][C]-0.8379[/C][C]0.20223[/C][/ROW]
[ROW][C]32[/C][C]-0.131982[/C][C]-1.2096[/C][C]0.114906[/C][/ROW]
[ROW][C]33[/C][C]-0.170204[/C][C]-1.5599[/C][C]0.061266[/C][/ROW]
[ROW][C]34[/C][C]-0.200936[/C][C]-1.8416[/C][C]0.034531[/C][/ROW]
[ROW][C]35[/C][C]-0.228886[/C][C]-2.0978[/C][C]0.019465[/C][/ROW]
[ROW][C]36[/C][C]-0.259032[/C][C]-2.3741[/C][C]0.009937[/C][/ROW]
[ROW][C]37[/C][C]-0.292004[/C][C]-2.6763[/C][C]0.004475[/C][/ROW]
[ROW][C]38[/C][C]-0.324528[/C][C]-2.9743[/C][C]0.001916[/C][/ROW]
[ROW][C]39[/C][C]-0.352946[/C][C]-3.2348[/C][C]0.000871[/C][/ROW]
[ROW][C]40[/C][C]-0.375166[/C][C]-3.4385[/C][C]0.000456[/C][/ROW]
[ROW][C]41[/C][C]-0.390332[/C][C]-3.5775[/C][C]0.00029[/C][/ROW]
[ROW][C]42[/C][C]-0.403226[/C][C]-3.6956[/C][C]0.000195[/C][/ROW]
[ROW][C]43[/C][C]-0.419551[/C][C]-3.8452[/C][C]0.000117[/C][/ROW]
[ROW][C]44[/C][C]-0.434775[/C][C]-3.9848[/C][C]7.2e-05[/C][/ROW]
[ROW][C]45[/C][C]-0.444605[/C][C]-4.0749[/C][C]5.2e-05[/C][/ROW]
[ROW][C]46[/C][C]-0.449524[/C][C]-4.12[/C][C]4.4e-05[/C][/ROW]
[ROW][C]47[/C][C]-0.451247[/C][C]-4.1357[/C][C]4.2e-05[/C][/ROW]
[ROW][C]48[/C][C]-0.454002[/C][C]-4.161[/C][C]3.8e-05[/C][/ROW]
[/TABLE]
Source: https://freestatistics.org/blog/index.php?pk=79212&T=1

Globally Unique Identifier (entire table): ba.freestatistics.org/blog/index.php?pk=79212&T=1

As an alternative you can also use a QR Code:  

The GUIDs for individual cells are displayed in the table below:

Autocorrelation Function
Time lag kACF(k)T-STATP-value
10.9752418.93820
20.9479098.68770
30.9254548.48190
40.9034548.28030
50.8794448.06020
60.8537017.82430
70.8229917.54280
80.7895787.23660
90.7578266.94560
100.7295156.68610
110.704086.4530
120.6743646.18060
130.6346265.81640
140.5918175.42410
150.5516995.05641e-06
160.5145484.71595e-06
170.4770894.37261.7e-05
180.438624.026.3e-05
190.3947583.6180.000253
200.3484953.1940.000988
210.3043132.78910.003269
220.2650872.42960.008624
230.22732.08320.020135
240.187071.71450.04506
250.1428461.30920.097017
260.0976560.8950.186663
270.0545780.50020.309117
280.016040.1470.441737
29-0.019102-0.17510.430722
30-0.052199-0.47840.316801
31-0.091423-0.83790.20223
32-0.131982-1.20960.114906
33-0.170204-1.55990.061266
34-0.200936-1.84160.034531
35-0.228886-2.09780.019465
36-0.259032-2.37410.009937
37-0.292004-2.67630.004475
38-0.324528-2.97430.001916
39-0.352946-3.23480.000871
40-0.375166-3.43850.000456
41-0.390332-3.57750.00029
42-0.403226-3.69560.000195
43-0.419551-3.84520.000117
44-0.434775-3.98487.2e-05
45-0.444605-4.07495.2e-05
46-0.449524-4.124.4e-05
47-0.451247-4.13574.2e-05
48-0.454002-4.1613.8e-05


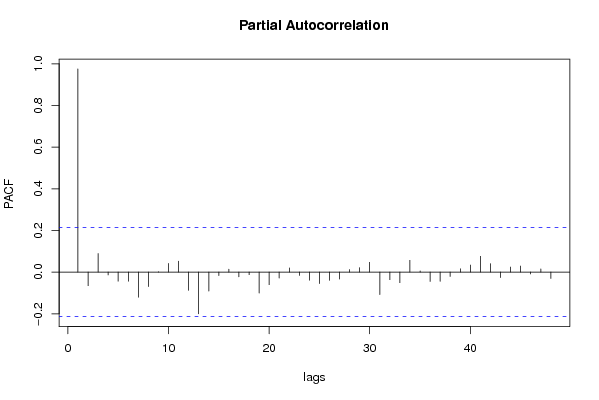
Partial Autocorrelation Function
Time lag kPACF(k)T-STATP-value
10.9752418.93820
2-0.065131-0.59690.276079
30.0887730.81360.209081
4-0.013393-0.12270.451299
5-0.043636-0.39990.345111
6-0.043664-0.40020.345018
7-0.12045-1.10390.136386
8-0.069492-0.63690.262958
90.0012520.01150.495437
100.0417560.38270.351455
110.0522440.47880.316653
12-0.087514-0.80210.212385
13-0.200337-1.83610.034939
14-0.091133-0.83530.202973
15-0.016718-0.15320.439294
160.0138620.1270.449605
17-0.022724-0.20830.417763
18-0.012167-0.11150.455738
19-0.100435-0.92050.179973
20-0.060546-0.55490.290216
21-0.02851-0.26130.397252
220.0199690.1830.427613
23-0.01584-0.14520.44246
24-0.038642-0.35420.362055
25-0.055015-0.50420.307712
26-0.039622-0.36310.358706
27-0.033178-0.30410.380909
280.0121890.11170.455658
290.0214220.19630.422411
300.046930.43010.334106
31-0.107775-0.98780.16305
32-0.036661-0.3360.368851
33-0.051097-0.46830.320388
340.0568560.52110.301837
350.0057630.05280.478999
36-0.045075-0.41310.340286
37-0.044391-0.40680.342577
38-0.02065-0.18930.425171
390.0157270.14410.442866
400.0339640.31130.378177
410.0757280.69410.244782
420.0405820.37190.355437
43-0.026317-0.24120.404993
440.0244570.22410.411593
450.0291140.26680.395125
46-0.008987-0.08240.467275
470.0153660.14080.444169
48-0.030303-0.27770.39095

\begin{tabular}{lllllllll}
\hline
Partial Autocorrelation Function \tabularnewline
Time lag k & PACF(k) & T-STAT & P-value \tabularnewline
1 & 0.975241 & 8.9382 & 0 \tabularnewline
2 & -0.065131 & -0.5969 & 0.276079 \tabularnewline
3 & 0.088773 & 0.8136 & 0.209081 \tabularnewline
4 & -0.013393 & -0.1227 & 0.451299 \tabularnewline
5 & -0.043636 & -0.3999 & 0.345111 \tabularnewline
6 & -0.043664 & -0.4002 & 0.345018 \tabularnewline
7 & -0.12045 & -1.1039 & 0.136386 \tabularnewline
8 & -0.069492 & -0.6369 & 0.262958 \tabularnewline
9 & 0.001252 & 0.0115 & 0.495437 \tabularnewline
10 & 0.041756 & 0.3827 & 0.351455 \tabularnewline
11 & 0.052244 & 0.4788 & 0.316653 \tabularnewline
12 & -0.087514 & -0.8021 & 0.212385 \tabularnewline
13 & -0.200337 & -1.8361 & 0.034939 \tabularnewline
14 & -0.091133 & -0.8353 & 0.202973 \tabularnewline
15 & -0.016718 & -0.1532 & 0.439294 \tabularnewline
16 & 0.013862 & 0.127 & 0.449605 \tabularnewline
17 & -0.022724 & -0.2083 & 0.417763 \tabularnewline
18 & -0.012167 & -0.1115 & 0.455738 \tabularnewline
19 & -0.100435 & -0.9205 & 0.179973 \tabularnewline
20 & -0.060546 & -0.5549 & 0.290216 \tabularnewline
21 & -0.02851 & -0.2613 & 0.397252 \tabularnewline
22 & 0.019969 & 0.183 & 0.427613 \tabularnewline
23 & -0.01584 & -0.1452 & 0.44246 \tabularnewline
24 & -0.038642 & -0.3542 & 0.362055 \tabularnewline
25 & -0.055015 & -0.5042 & 0.307712 \tabularnewline
26 & -0.039622 & -0.3631 & 0.358706 \tabularnewline
27 & -0.033178 & -0.3041 & 0.380909 \tabularnewline
28 & 0.012189 & 0.1117 & 0.455658 \tabularnewline
29 & 0.021422 & 0.1963 & 0.422411 \tabularnewline
30 & 0.04693 & 0.4301 & 0.334106 \tabularnewline
31 & -0.107775 & -0.9878 & 0.16305 \tabularnewline
32 & -0.036661 & -0.336 & 0.368851 \tabularnewline
33 & -0.051097 & -0.4683 & 0.320388 \tabularnewline
34 & 0.056856 & 0.5211 & 0.301837 \tabularnewline
35 & 0.005763 & 0.0528 & 0.478999 \tabularnewline
36 & -0.045075 & -0.4131 & 0.340286 \tabularnewline
37 & -0.044391 & -0.4068 & 0.342577 \tabularnewline
38 & -0.02065 & -0.1893 & 0.425171 \tabularnewline
39 & 0.015727 & 0.1441 & 0.442866 \tabularnewline
40 & 0.033964 & 0.3113 & 0.378177 \tabularnewline
41 & 0.075728 & 0.6941 & 0.244782 \tabularnewline
42 & 0.040582 & 0.3719 & 0.355437 \tabularnewline
43 & -0.026317 & -0.2412 & 0.404993 \tabularnewline
44 & 0.024457 & 0.2241 & 0.411593 \tabularnewline
45 & 0.029114 & 0.2668 & 0.395125 \tabularnewline
46 & -0.008987 & -0.0824 & 0.467275 \tabularnewline
47 & 0.015366 & 0.1408 & 0.444169 \tabularnewline
48 & -0.030303 & -0.2777 & 0.39095 \tabularnewline
\hline
\end{tabular}
%Source: https://freestatistics.org/blog/index.php?pk=79212&T=2

[TABLE]
[ROW][C]Partial Autocorrelation Function[/C][/ROW]
[ROW][C]Time lag k[/C][C]PACF(k)[/C][C]T-STAT[/C][C]P-value[/C][/ROW]
[ROW][C]1[/C][C]0.975241[/C][C]8.9382[/C][C]0[/C][/ROW]
[ROW][C]2[/C][C]-0.065131[/C][C]-0.5969[/C][C]0.276079[/C][/ROW]
[ROW][C]3[/C][C]0.088773[/C][C]0.8136[/C][C]0.209081[/C][/ROW]
[ROW][C]4[/C][C]-0.013393[/C][C]-0.1227[/C][C]0.451299[/C][/ROW]
[ROW][C]5[/C][C]-0.043636[/C][C]-0.3999[/C][C]0.345111[/C][/ROW]
[ROW][C]6[/C][C]-0.043664[/C][C]-0.4002[/C][C]0.345018[/C][/ROW]
[ROW][C]7[/C][C]-0.12045[/C][C]-1.1039[/C][C]0.136386[/C][/ROW]
[ROW][C]8[/C][C]-0.069492[/C][C]-0.6369[/C][C]0.262958[/C][/ROW]
[ROW][C]9[/C][C]0.001252[/C][C]0.0115[/C][C]0.495437[/C][/ROW]
[ROW][C]10[/C][C]0.041756[/C][C]0.3827[/C][C]0.351455[/C][/ROW]
[ROW][C]11[/C][C]0.052244[/C][C]0.4788[/C][C]0.316653[/C][/ROW]
[ROW][C]12[/C][C]-0.087514[/C][C]-0.8021[/C][C]0.212385[/C][/ROW]
[ROW][C]13[/C][C]-0.200337[/C][C]-1.8361[/C][C]0.034939[/C][/ROW]
[ROW][C]14[/C][C]-0.091133[/C][C]-0.8353[/C][C]0.202973[/C][/ROW]
[ROW][C]15[/C][C]-0.016718[/C][C]-0.1532[/C][C]0.439294[/C][/ROW]
[ROW][C]16[/C][C]0.013862[/C][C]0.127[/C][C]0.449605[/C][/ROW]
[ROW][C]17[/C][C]-0.022724[/C][C]-0.2083[/C][C]0.417763[/C][/ROW]
[ROW][C]18[/C][C]-0.012167[/C][C]-0.1115[/C][C]0.455738[/C][/ROW]
[ROW][C]19[/C][C]-0.100435[/C][C]-0.9205[/C][C]0.179973[/C][/ROW]
[ROW][C]20[/C][C]-0.060546[/C][C]-0.5549[/C][C]0.290216[/C][/ROW]
[ROW][C]21[/C][C]-0.02851[/C][C]-0.2613[/C][C]0.397252[/C][/ROW]
[ROW][C]22[/C][C]0.019969[/C][C]0.183[/C][C]0.427613[/C][/ROW]
[ROW][C]23[/C][C]-0.01584[/C][C]-0.1452[/C][C]0.44246[/C][/ROW]
[ROW][C]24[/C][C]-0.038642[/C][C]-0.3542[/C][C]0.362055[/C][/ROW]
[ROW][C]25[/C][C]-0.055015[/C][C]-0.5042[/C][C]0.307712[/C][/ROW]
[ROW][C]26[/C][C]-0.039622[/C][C]-0.3631[/C][C]0.358706[/C][/ROW]
[ROW][C]27[/C][C]-0.033178[/C][C]-0.3041[/C][C]0.380909[/C][/ROW]
[ROW][C]28[/C][C]0.012189[/C][C]0.1117[/C][C]0.455658[/C][/ROW]
[ROW][C]29[/C][C]0.021422[/C][C]0.1963[/C][C]0.422411[/C][/ROW]
[ROW][C]30[/C][C]0.04693[/C][C]0.4301[/C][C]0.334106[/C][/ROW]
[ROW][C]31[/C][C]-0.107775[/C][C]-0.9878[/C][C]0.16305[/C][/ROW]
[ROW][C]32[/C][C]-0.036661[/C][C]-0.336[/C][C]0.368851[/C][/ROW]
[ROW][C]33[/C][C]-0.051097[/C][C]-0.4683[/C][C]0.320388[/C][/ROW]
[ROW][C]34[/C][C]0.056856[/C][C]0.5211[/C][C]0.301837[/C][/ROW]
[ROW][C]35[/C][C]0.005763[/C][C]0.0528[/C][C]0.478999[/C][/ROW]
[ROW][C]36[/C][C]-0.045075[/C][C]-0.4131[/C][C]0.340286[/C][/ROW]
[ROW][C]37[/C][C]-0.044391[/C][C]-0.4068[/C][C]0.342577[/C][/ROW]
[ROW][C]38[/C][C]-0.02065[/C][C]-0.1893[/C][C]0.425171[/C][/ROW]
[ROW][C]39[/C][C]0.015727[/C][C]0.1441[/C][C]0.442866[/C][/ROW]
[ROW][C]40[/C][C]0.033964[/C][C]0.3113[/C][C]0.378177[/C][/ROW]
[ROW][C]41[/C][C]0.075728[/C][C]0.6941[/C][C]0.244782[/C][/ROW]
[ROW][C]42[/C][C]0.040582[/C][C]0.3719[/C][C]0.355437[/C][/ROW]
[ROW][C]43[/C][C]-0.026317[/C][C]-0.2412[/C][C]0.404993[/C][/ROW]
[ROW][C]44[/C][C]0.024457[/C][C]0.2241[/C][C]0.411593[/C][/ROW]
[ROW][C]45[/C][C]0.029114[/C][C]0.2668[/C][C]0.395125[/C][/ROW]
[ROW][C]46[/C][C]-0.008987[/C][C]-0.0824[/C][C]0.467275[/C][/ROW]
[ROW][C]47[/C][C]0.015366[/C][C]0.1408[/C][C]0.444169[/C][/ROW]
[ROW][C]48[/C][C]-0.030303[/C][C]-0.2777[/C][C]0.39095[/C][/ROW]
[/TABLE]
Source: https://freestatistics.org/blog/index.php?pk=79212&T=2

Globally Unique Identifier (entire table): ba.freestatistics.org/blog/index.php?pk=79212&T=2

As an alternative you can also use a QR Code:  

The GUIDs for individual cells are displayed in the table below:

Partial Autocorrelation Function
Time lag kPACF(k)T-STATP-value
10.9752418.93820
2-0.065131-0.59690.276079
30.0887730.81360.209081
4-0.013393-0.12270.451299
5-0.043636-0.39990.345111
6-0.043664-0.40020.345018
7-0.12045-1.10390.136386
8-0.069492-0.63690.262958
90.0012520.01150.495437
100.0417560.38270.351455
110.0522440.47880.316653
12-0.087514-0.80210.212385
13-0.200337-1.83610.034939
14-0.091133-0.83530.202973
15-0.016718-0.15320.439294
160.0138620.1270.449605
17-0.022724-0.20830.417763
18-0.012167-0.11150.455738
19-0.100435-0.92050.179973
20-0.060546-0.55490.290216
21-0.02851-0.26130.397252
220.0199690.1830.427613
23-0.01584-0.14520.44246
24-0.038642-0.35420.362055
25-0.055015-0.50420.307712
26-0.039622-0.36310.358706
27-0.033178-0.30410.380909
280.0121890.11170.455658
290.0214220.19630.422411
300.046930.43010.334106
31-0.107775-0.98780.16305
32-0.036661-0.3360.368851
33-0.051097-0.46830.320388
340.0568560.52110.301837
350.0057630.05280.478999
36-0.045075-0.41310.340286
37-0.044391-0.40680.342577
38-0.02065-0.18930.425171
390.0157270.14410.442866
400.0339640.31130.378177
410.0757280.69410.244782
420.0405820.37190.355437
43-0.026317-0.24120.404993
440.0244570.22410.411593
450.0291140.26680.395125
46-0.008987-0.08240.467275
470.0153660.14080.444169
48-0.030303-0.27770.39095


Parameters (Session):
par1 = 48 ; par2 = 1 ; par3 = 0 ; par4 = 0 ; par5 = 12 ; par6 = White Noise ; par7 = 0.95 ;
Parameters (R input):
par1 = 48 ; par2 = 1 ; par3 = 0 ; par4 = 0 ; par5 = 12 ; par6 = White Noise ; par7 = 0.95 ;
R code (references can be found in the software module):
if (par1 == 'Default') {
par1 = 10*log10(length(x))
} else {
par1 <- as.numeric(par1)
}
par2 <- as.numeric(par2)
par3 <- as.numeric(par3)
par4 <- as.numeric(par4)
par5 <- as.numeric(par5)
if (par6 == 'White Noise') par6 <- 'white' else par6 <- 'ma'
par7 <- as.numeric(par7)
if (par2 == 0) {
x <- log(x)
} else {
x <- (x ^ par2 - 1) / par2
}
if (par3 > 0) x <- diff(x,lag=1,difference=par3)
if (par4 > 0) x <- diff(x,lag=par5,difference=par4)
bitmap(file='pic1.png')
racf <- acf(x, par1, main='Autocorrelation', xlab='time lag', ylab='ACF', ci.type=par6, ci=par7, sub=paste('(lambda=',par2,', d=',par3,', D=',par4,', CI=', par7, ', CI type=',par6,')',sep=''))
dev.off()
bitmap(file='pic2.png')
rpacf <- pacf(x,par1,main='Partial Autocorrelation',xlab='lags',ylab='PACF')
dev.off()
(myacf <- c(racf$acf))
(mypacf <- c(rpacf$acf))
lengthx <- length(x)
sqrtn <- sqrt(lengthx)
load(file='createtable')
a<-table.start()
a<-table.row.start(a)
a<-table.element(a,'Autocorrelation Function',4,TRUE)
a<-table.row.end(a)
a<-table.row.start(a)
a<-table.element(a,'Time lag k',header=TRUE)
a<-table.element(a,hyperlink('basics.htm','ACF(k)','click here for more information about the Autocorrelation Function'),header=TRUE)
a<-table.element(a,'T-STAT',header=TRUE)
a<-table.element(a,'P-value',header=TRUE)
a<-table.row.end(a)
for (i in 2:(par1+1)) {
a<-table.row.start(a)
a<-table.element(a,i-1,header=TRUE)
a<-table.element(a,round(myacf[i],6))
mytstat <- myacf[i]*sqrtn
a<-table.element(a,round(mytstat,4))
a<-table.element(a,round(1-pt(abs(mytstat),lengthx),6))
a<-table.row.end(a)
}
a<-table.end(a)
table.save(a,file='mytable.tab')
a<-table.start()
a<-table.row.start(a)
a<-table.element(a,'Partial Autocorrelation Function',4,TRUE)
a<-table.row.end(a)
a<-table.row.start(a)
a<-table.element(a,'Time lag k',header=TRUE)
a<-table.element(a,hyperlink('basics.htm','PACF(k)','click here for more information about the Partial Autocorrelation Function'),header=TRUE)
a<-table.element(a,'T-STAT',header=TRUE)
a<-table.element(a,'P-value',header=TRUE)
a<-table.row.end(a)
for (i in 1:par1) {
a<-table.row.start(a)
a<-table.element(a,i,header=TRUE)
a<-table.element(a,round(mypacf[i],6))
mytstat <- mypacf[i]*sqrtn
a<-table.element(a,round(mytstat,4))
a<-table.element(a,round(1-pt(abs(mytstat),lengthx),6))
a<-table.row.end(a)
}
a<-table.end(a)
table.save(a,file='mytable1.tab')