Free Statistics

of Irreproducible Research!

Author's title

Author*Unverified author*
R Software Modulerwasp_autocorrelation.wasp
Title produced by software(Partial) Autocorrelation Function
Date of computationWed, 18 Aug 2010 18:00:21 +0000
Cite this page as followsStatistical Computations at FreeStatistics.org, Office for Research Development and Education, URL https://freestatistics.org/blog/index.php?v=date/2010/Aug/18/t1282154478gxheamzk23omf09.htm/, Retrieved Thu, 16 May 2024 12:45:11 +0000
Statistical Computations at FreeStatistics.org, Office for Research Development and Education, URL https://freestatistics.org/blog/index.php?pk=79211, Retrieved Thu, 16 May 2024 12:45:11 +0000
QR Codes:

Original text written by user:
IsPrivate?No (this computation is public)
User-defined keywordsPatrick Fieremans
Estimated Impact149
Family? (F = Feedback message, R = changed R code, M = changed R Module, P = changed Parameters, D = changed Data)
-       [(Partial) Autocorrelation Function] [Tijdreeks 1 - Sta...] [2010-08-18 18:00:21] [bffa0fb6afa860209dcefcd4361c2008] [Current]
Feedback Forum

Post a new message
Dataseries X:
136
135
134
132
152
151
136
126
127
127
128
130
125
118
111
104
126
131
122
116
115
115
113
122
114
106
93
89
114
122
115
116
120
120
120
121
118
112
99
96
120
135
128
134
134
132
130
125
124
114
101
101
123
143
133
136
137
135
141
136
133
124
110
104
130
160
142
142
137
135
139
135
134
120
103
101
127
159
141
140
135
127
130
128
126
110
101
102
129
169
146
145
138
123
124
137
132
112
105
106
137
175
151
142
140
122
127
135
128
117
107
108
134
171
154
146
148
122
124
135


Summary of computational transaction
Raw Inputview raw input (R code)
Raw Outputview raw output of R engine
Computing time2 seconds
R Server'RServer@AstonUniversity' @ vre.aston.ac.uk

\begin{tabular}{lllllllll}
\hline
Summary of computational transaction \tabularnewline
Raw Input & view raw input (R code)  \tabularnewline
Raw Output & view raw output of R engine  \tabularnewline
Computing time & 2 seconds \tabularnewline
R Server & 'RServer@AstonUniversity' @ vre.aston.ac.uk \tabularnewline
\hline
\end{tabular}
%Source: https://freestatistics.org/blog/index.php?pk=79211&T=0

[TABLE]
[ROW][C]Summary of computational transaction[/C][/ROW]
[ROW][C]Raw Input[/C][C]view raw input (R code) [/C][/ROW]
[ROW][C]Raw Output[/C][C]view raw output of R engine [/C][/ROW]
[ROW][C]Computing time[/C][C]2 seconds[/C][/ROW]
[ROW][C]R Server[/C][C]'RServer@AstonUniversity' @ vre.aston.ac.uk[/C][/ROW]
[/TABLE]
Source: https://freestatistics.org/blog/index.php?pk=79211&T=0

Globally Unique Identifier (entire table): ba.freestatistics.org/blog/index.php?pk=79211&T=0

As an alternative you can also use a QR Code:  

The GUIDs for individual cells are displayed in the table below:

Summary of computational transaction
Raw Inputview raw input (R code)
Raw Outputview raw output of R engine
Computing time2 seconds
R Server'RServer@AstonUniversity' @ vre.aston.ac.uk


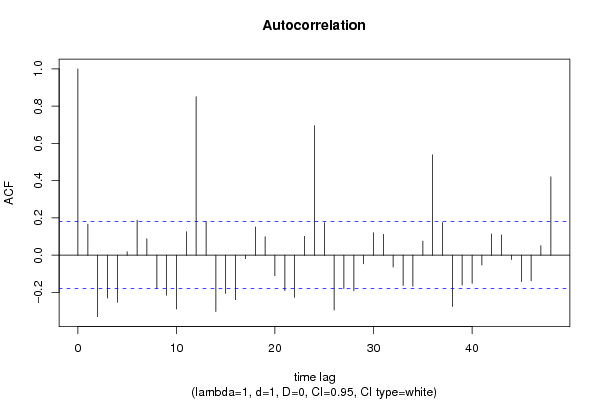
Autocorrelation Function
Time lag kACF(k)T-STATP-value
10.1660241.81110.036324
2-0.330026-3.60020.000232
3-0.230133-2.51050.0067
4-0.252853-2.75830.003364
50.0182170.19870.421407
60.1877122.04770.021395
70.0889080.96990.167039
8-0.17829-1.94490.027072
9-0.215149-2.3470.010289
10-0.289572-3.15890.001004
110.125621.37040.086578
120.8511529.2850
130.180511.96910.025631
14-0.30248-3.29970.000639
15-0.205664-2.24350.013356
16-0.239407-2.61160.005086
17-0.018776-0.20480.41903
180.1519961.65810.049967
190.099181.08190.140736
20-0.110862-1.20940.11446
21-0.190352-2.07650.020001
22-0.22645-2.47030.007459
230.1011631.10360.136005
240.695167.58330
250.174411.90260.029756
26-0.29405-3.20770.00086
27-0.179162-1.95440.026498
28-0.190525-2.07840.019912
29-0.045933-0.50110.308623
300.1201541.31070.096237
310.1120471.22230.112008
32-0.063078-0.68810.246364
33-0.162298-1.77050.039606
34-0.166316-1.81430.036076
350.0757530.82640.205125
360.5387795.87740
370.1750721.90980.029282
38-0.276071-3.01160.001587
39-0.160098-1.74650.041655
40-0.150785-1.64490.051318
41-0.05318-0.58010.281465
420.1136151.23940.108819
430.1083961.18250.119691
44-0.023103-0.2520.400729
45-0.141199-1.54030.063071
46-0.137312-1.49790.068404
470.050820.55440.290181
480.4206344.58866e-06

\begin{tabular}{lllllllll}
\hline
Autocorrelation Function \tabularnewline
Time lag k & ACF(k) & T-STAT & P-value \tabularnewline
1 & 0.166024 & 1.8111 & 0.036324 \tabularnewline
2 & -0.330026 & -3.6002 & 0.000232 \tabularnewline
3 & -0.230133 & -2.5105 & 0.0067 \tabularnewline
4 & -0.252853 & -2.7583 & 0.003364 \tabularnewline
5 & 0.018217 & 0.1987 & 0.421407 \tabularnewline
6 & 0.187712 & 2.0477 & 0.021395 \tabularnewline
7 & 0.088908 & 0.9699 & 0.167039 \tabularnewline
8 & -0.17829 & -1.9449 & 0.027072 \tabularnewline
9 & -0.215149 & -2.347 & 0.010289 \tabularnewline
10 & -0.289572 & -3.1589 & 0.001004 \tabularnewline
11 & 0.12562 & 1.3704 & 0.086578 \tabularnewline
12 & 0.851152 & 9.285 & 0 \tabularnewline
13 & 0.18051 & 1.9691 & 0.025631 \tabularnewline
14 & -0.30248 & -3.2997 & 0.000639 \tabularnewline
15 & -0.205664 & -2.2435 & 0.013356 \tabularnewline
16 & -0.239407 & -2.6116 & 0.005086 \tabularnewline
17 & -0.018776 & -0.2048 & 0.41903 \tabularnewline
18 & 0.151996 & 1.6581 & 0.049967 \tabularnewline
19 & 0.09918 & 1.0819 & 0.140736 \tabularnewline
20 & -0.110862 & -1.2094 & 0.11446 \tabularnewline
21 & -0.190352 & -2.0765 & 0.020001 \tabularnewline
22 & -0.22645 & -2.4703 & 0.007459 \tabularnewline
23 & 0.101163 & 1.1036 & 0.136005 \tabularnewline
24 & 0.69516 & 7.5833 & 0 \tabularnewline
25 & 0.17441 & 1.9026 & 0.029756 \tabularnewline
26 & -0.29405 & -3.2077 & 0.00086 \tabularnewline
27 & -0.179162 & -1.9544 & 0.026498 \tabularnewline
28 & -0.190525 & -2.0784 & 0.019912 \tabularnewline
29 & -0.045933 & -0.5011 & 0.308623 \tabularnewline
30 & 0.120154 & 1.3107 & 0.096237 \tabularnewline
31 & 0.112047 & 1.2223 & 0.112008 \tabularnewline
32 & -0.063078 & -0.6881 & 0.246364 \tabularnewline
33 & -0.162298 & -1.7705 & 0.039606 \tabularnewline
34 & -0.166316 & -1.8143 & 0.036076 \tabularnewline
35 & 0.075753 & 0.8264 & 0.205125 \tabularnewline
36 & 0.538779 & 5.8774 & 0 \tabularnewline
37 & 0.175072 & 1.9098 & 0.029282 \tabularnewline
38 & -0.276071 & -3.0116 & 0.001587 \tabularnewline
39 & -0.160098 & -1.7465 & 0.041655 \tabularnewline
40 & -0.150785 & -1.6449 & 0.051318 \tabularnewline
41 & -0.05318 & -0.5801 & 0.281465 \tabularnewline
42 & 0.113615 & 1.2394 & 0.108819 \tabularnewline
43 & 0.108396 & 1.1825 & 0.119691 \tabularnewline
44 & -0.023103 & -0.252 & 0.400729 \tabularnewline
45 & -0.141199 & -1.5403 & 0.063071 \tabularnewline
46 & -0.137312 & -1.4979 & 0.068404 \tabularnewline
47 & 0.05082 & 0.5544 & 0.290181 \tabularnewline
48 & 0.420634 & 4.5886 & 6e-06 \tabularnewline
\hline
\end{tabular}
%Source: https://freestatistics.org/blog/index.php?pk=79211&T=1

[TABLE]
[ROW][C]Autocorrelation Function[/C][/ROW]
[ROW][C]Time lag k[/C][C]ACF(k)[/C][C]T-STAT[/C][C]P-value[/C][/ROW]
[ROW][C]1[/C][C]0.166024[/C][C]1.8111[/C][C]0.036324[/C][/ROW]
[ROW][C]2[/C][C]-0.330026[/C][C]-3.6002[/C][C]0.000232[/C][/ROW]
[ROW][C]3[/C][C]-0.230133[/C][C]-2.5105[/C][C]0.0067[/C][/ROW]
[ROW][C]4[/C][C]-0.252853[/C][C]-2.7583[/C][C]0.003364[/C][/ROW]
[ROW][C]5[/C][C]0.018217[/C][C]0.1987[/C][C]0.421407[/C][/ROW]
[ROW][C]6[/C][C]0.187712[/C][C]2.0477[/C][C]0.021395[/C][/ROW]
[ROW][C]7[/C][C]0.088908[/C][C]0.9699[/C][C]0.167039[/C][/ROW]
[ROW][C]8[/C][C]-0.17829[/C][C]-1.9449[/C][C]0.027072[/C][/ROW]
[ROW][C]9[/C][C]-0.215149[/C][C]-2.347[/C][C]0.010289[/C][/ROW]
[ROW][C]10[/C][C]-0.289572[/C][C]-3.1589[/C][C]0.001004[/C][/ROW]
[ROW][C]11[/C][C]0.12562[/C][C]1.3704[/C][C]0.086578[/C][/ROW]
[ROW][C]12[/C][C]0.851152[/C][C]9.285[/C][C]0[/C][/ROW]
[ROW][C]13[/C][C]0.18051[/C][C]1.9691[/C][C]0.025631[/C][/ROW]
[ROW][C]14[/C][C]-0.30248[/C][C]-3.2997[/C][C]0.000639[/C][/ROW]
[ROW][C]15[/C][C]-0.205664[/C][C]-2.2435[/C][C]0.013356[/C][/ROW]
[ROW][C]16[/C][C]-0.239407[/C][C]-2.6116[/C][C]0.005086[/C][/ROW]
[ROW][C]17[/C][C]-0.018776[/C][C]-0.2048[/C][C]0.41903[/C][/ROW]
[ROW][C]18[/C][C]0.151996[/C][C]1.6581[/C][C]0.049967[/C][/ROW]
[ROW][C]19[/C][C]0.09918[/C][C]1.0819[/C][C]0.140736[/C][/ROW]
[ROW][C]20[/C][C]-0.110862[/C][C]-1.2094[/C][C]0.11446[/C][/ROW]
[ROW][C]21[/C][C]-0.190352[/C][C]-2.0765[/C][C]0.020001[/C][/ROW]
[ROW][C]22[/C][C]-0.22645[/C][C]-2.4703[/C][C]0.007459[/C][/ROW]
[ROW][C]23[/C][C]0.101163[/C][C]1.1036[/C][C]0.136005[/C][/ROW]
[ROW][C]24[/C][C]0.69516[/C][C]7.5833[/C][C]0[/C][/ROW]
[ROW][C]25[/C][C]0.17441[/C][C]1.9026[/C][C]0.029756[/C][/ROW]
[ROW][C]26[/C][C]-0.29405[/C][C]-3.2077[/C][C]0.00086[/C][/ROW]
[ROW][C]27[/C][C]-0.179162[/C][C]-1.9544[/C][C]0.026498[/C][/ROW]
[ROW][C]28[/C][C]-0.190525[/C][C]-2.0784[/C][C]0.019912[/C][/ROW]
[ROW][C]29[/C][C]-0.045933[/C][C]-0.5011[/C][C]0.308623[/C][/ROW]
[ROW][C]30[/C][C]0.120154[/C][C]1.3107[/C][C]0.096237[/C][/ROW]
[ROW][C]31[/C][C]0.112047[/C][C]1.2223[/C][C]0.112008[/C][/ROW]
[ROW][C]32[/C][C]-0.063078[/C][C]-0.6881[/C][C]0.246364[/C][/ROW]
[ROW][C]33[/C][C]-0.162298[/C][C]-1.7705[/C][C]0.039606[/C][/ROW]
[ROW][C]34[/C][C]-0.166316[/C][C]-1.8143[/C][C]0.036076[/C][/ROW]
[ROW][C]35[/C][C]0.075753[/C][C]0.8264[/C][C]0.205125[/C][/ROW]
[ROW][C]36[/C][C]0.538779[/C][C]5.8774[/C][C]0[/C][/ROW]
[ROW][C]37[/C][C]0.175072[/C][C]1.9098[/C][C]0.029282[/C][/ROW]
[ROW][C]38[/C][C]-0.276071[/C][C]-3.0116[/C][C]0.001587[/C][/ROW]
[ROW][C]39[/C][C]-0.160098[/C][C]-1.7465[/C][C]0.041655[/C][/ROW]
[ROW][C]40[/C][C]-0.150785[/C][C]-1.6449[/C][C]0.051318[/C][/ROW]
[ROW][C]41[/C][C]-0.05318[/C][C]-0.5801[/C][C]0.281465[/C][/ROW]
[ROW][C]42[/C][C]0.113615[/C][C]1.2394[/C][C]0.108819[/C][/ROW]
[ROW][C]43[/C][C]0.108396[/C][C]1.1825[/C][C]0.119691[/C][/ROW]
[ROW][C]44[/C][C]-0.023103[/C][C]-0.252[/C][C]0.400729[/C][/ROW]
[ROW][C]45[/C][C]-0.141199[/C][C]-1.5403[/C][C]0.063071[/C][/ROW]
[ROW][C]46[/C][C]-0.137312[/C][C]-1.4979[/C][C]0.068404[/C][/ROW]
[ROW][C]47[/C][C]0.05082[/C][C]0.5544[/C][C]0.290181[/C][/ROW]
[ROW][C]48[/C][C]0.420634[/C][C]4.5886[/C][C]6e-06[/C][/ROW]
[/TABLE]
Source: https://freestatistics.org/blog/index.php?pk=79211&T=1

Globally Unique Identifier (entire table): ba.freestatistics.org/blog/index.php?pk=79211&T=1

As an alternative you can also use a QR Code:  

The GUIDs for individual cells are displayed in the table below:

Autocorrelation Function
Time lag kACF(k)T-STATP-value
10.1660241.81110.036324
2-0.330026-3.60020.000232
3-0.230133-2.51050.0067
4-0.252853-2.75830.003364
50.0182170.19870.421407
60.1877122.04770.021395
70.0889080.96990.167039
8-0.17829-1.94490.027072
9-0.215149-2.3470.010289
10-0.289572-3.15890.001004
110.125621.37040.086578
120.8511529.2850
130.180511.96910.025631
14-0.30248-3.29970.000639
15-0.205664-2.24350.013356
16-0.239407-2.61160.005086
17-0.018776-0.20480.41903
180.1519961.65810.049967
190.099181.08190.140736
20-0.110862-1.20940.11446
21-0.190352-2.07650.020001
22-0.22645-2.47030.007459
230.1011631.10360.136005
240.695167.58330
250.174411.90260.029756
26-0.29405-3.20770.00086
27-0.179162-1.95440.026498
28-0.190525-2.07840.019912
29-0.045933-0.50110.308623
300.1201541.31070.096237
310.1120471.22230.112008
32-0.063078-0.68810.246364
33-0.162298-1.77050.039606
34-0.166316-1.81430.036076
350.0757530.82640.205125
360.5387795.87740
370.1750721.90980.029282
38-0.276071-3.01160.001587
39-0.160098-1.74650.041655
40-0.150785-1.64490.051318
41-0.05318-0.58010.281465
420.1136151.23940.108819
430.1083961.18250.119691
44-0.023103-0.2520.400729
45-0.141199-1.54030.063071
46-0.137312-1.49790.068404
470.050820.55440.290181
480.4206344.58866e-06


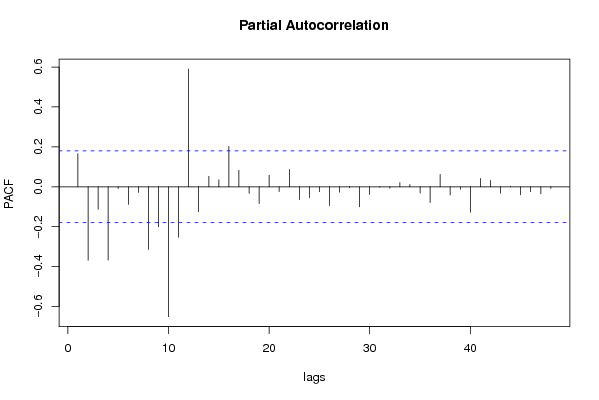
Partial Autocorrelation Function
Time lag kPACF(k)T-STATP-value
10.1660241.81110.036324
2-0.367726-4.01145.3e-05
3-0.111948-1.22120.112211
4-0.366634-3.99955.5e-05
5-0.008893-0.0970.461441
6-0.088189-0.9620.168992
7-0.02714-0.29610.383848
8-0.31482-3.43430.000409
9-0.200079-2.18260.015514
10-0.650829-7.09970
11-0.253004-2.75990.003348
120.5905936.44260
13-0.125666-1.37090.086501
140.052240.56990.284919
150.0348260.37990.352345
160.2017972.20130.01482
170.0831240.90680.18318
18-0.032777-0.35760.360656
19-0.084352-0.92020.179673
200.0583020.6360.262998
21-0.023763-0.25920.397954
220.0865120.94370.173608
23-0.063571-0.69350.24468
24-0.053814-0.5870.279143
25-0.024247-0.26450.395923
26-0.094216-1.02780.153071
27-0.026869-0.29310.384976
28-0.004665-0.05090.479749
29-0.100562-1.0970.137428
30-0.038503-0.420.337614
31-0.00253-0.02760.489016
32-0.00674-0.07350.470757
330.0209250.22830.409915
340.010950.11950.452559
35-0.031542-0.34410.365697
36-0.079127-0.86320.194889
370.0620090.67640.250036
38-0.040682-0.44380.329
39-0.0132-0.1440.442875
40-0.127973-1.3960.082654
410.042070.45890.323563
420.031470.34330.365991
43-0.032029-0.34940.363704
440.0030440.03320.486784
45-0.039572-0.43170.333377
46-0.024771-0.27020.393731
47-0.034966-0.38140.351781
48-0.008036-0.08770.465146

\begin{tabular}{lllllllll}
\hline
Partial Autocorrelation Function \tabularnewline
Time lag k & PACF(k) & T-STAT & P-value \tabularnewline
1 & 0.166024 & 1.8111 & 0.036324 \tabularnewline
2 & -0.367726 & -4.0114 & 5.3e-05 \tabularnewline
3 & -0.111948 & -1.2212 & 0.112211 \tabularnewline
4 & -0.366634 & -3.9995 & 5.5e-05 \tabularnewline
5 & -0.008893 & -0.097 & 0.461441 \tabularnewline
6 & -0.088189 & -0.962 & 0.168992 \tabularnewline
7 & -0.02714 & -0.2961 & 0.383848 \tabularnewline
8 & -0.31482 & -3.4343 & 0.000409 \tabularnewline
9 & -0.200079 & -2.1826 & 0.015514 \tabularnewline
10 & -0.650829 & -7.0997 & 0 \tabularnewline
11 & -0.253004 & -2.7599 & 0.003348 \tabularnewline
12 & 0.590593 & 6.4426 & 0 \tabularnewline
13 & -0.125666 & -1.3709 & 0.086501 \tabularnewline
14 & 0.05224 & 0.5699 & 0.284919 \tabularnewline
15 & 0.034826 & 0.3799 & 0.352345 \tabularnewline
16 & 0.201797 & 2.2013 & 0.01482 \tabularnewline
17 & 0.083124 & 0.9068 & 0.18318 \tabularnewline
18 & -0.032777 & -0.3576 & 0.360656 \tabularnewline
19 & -0.084352 & -0.9202 & 0.179673 \tabularnewline
20 & 0.058302 & 0.636 & 0.262998 \tabularnewline
21 & -0.023763 & -0.2592 & 0.397954 \tabularnewline
22 & 0.086512 & 0.9437 & 0.173608 \tabularnewline
23 & -0.063571 & -0.6935 & 0.24468 \tabularnewline
24 & -0.053814 & -0.587 & 0.279143 \tabularnewline
25 & -0.024247 & -0.2645 & 0.395923 \tabularnewline
26 & -0.094216 & -1.0278 & 0.153071 \tabularnewline
27 & -0.026869 & -0.2931 & 0.384976 \tabularnewline
28 & -0.004665 & -0.0509 & 0.479749 \tabularnewline
29 & -0.100562 & -1.097 & 0.137428 \tabularnewline
30 & -0.038503 & -0.42 & 0.337614 \tabularnewline
31 & -0.00253 & -0.0276 & 0.489016 \tabularnewline
32 & -0.00674 & -0.0735 & 0.470757 \tabularnewline
33 & 0.020925 & 0.2283 & 0.409915 \tabularnewline
34 & 0.01095 & 0.1195 & 0.452559 \tabularnewline
35 & -0.031542 & -0.3441 & 0.365697 \tabularnewline
36 & -0.079127 & -0.8632 & 0.194889 \tabularnewline
37 & 0.062009 & 0.6764 & 0.250036 \tabularnewline
38 & -0.040682 & -0.4438 & 0.329 \tabularnewline
39 & -0.0132 & -0.144 & 0.442875 \tabularnewline
40 & -0.127973 & -1.396 & 0.082654 \tabularnewline
41 & 0.04207 & 0.4589 & 0.323563 \tabularnewline
42 & 0.03147 & 0.3433 & 0.365991 \tabularnewline
43 & -0.032029 & -0.3494 & 0.363704 \tabularnewline
44 & 0.003044 & 0.0332 & 0.486784 \tabularnewline
45 & -0.039572 & -0.4317 & 0.333377 \tabularnewline
46 & -0.024771 & -0.2702 & 0.393731 \tabularnewline
47 & -0.034966 & -0.3814 & 0.351781 \tabularnewline
48 & -0.008036 & -0.0877 & 0.465146 \tabularnewline
\hline
\end{tabular}
%Source: https://freestatistics.org/blog/index.php?pk=79211&T=2

[TABLE]
[ROW][C]Partial Autocorrelation Function[/C][/ROW]
[ROW][C]Time lag k[/C][C]PACF(k)[/C][C]T-STAT[/C][C]P-value[/C][/ROW]
[ROW][C]1[/C][C]0.166024[/C][C]1.8111[/C][C]0.036324[/C][/ROW]
[ROW][C]2[/C][C]-0.367726[/C][C]-4.0114[/C][C]5.3e-05[/C][/ROW]
[ROW][C]3[/C][C]-0.111948[/C][C]-1.2212[/C][C]0.112211[/C][/ROW]
[ROW][C]4[/C][C]-0.366634[/C][C]-3.9995[/C][C]5.5e-05[/C][/ROW]
[ROW][C]5[/C][C]-0.008893[/C][C]-0.097[/C][C]0.461441[/C][/ROW]
[ROW][C]6[/C][C]-0.088189[/C][C]-0.962[/C][C]0.168992[/C][/ROW]
[ROW][C]7[/C][C]-0.02714[/C][C]-0.2961[/C][C]0.383848[/C][/ROW]
[ROW][C]8[/C][C]-0.31482[/C][C]-3.4343[/C][C]0.000409[/C][/ROW]
[ROW][C]9[/C][C]-0.200079[/C][C]-2.1826[/C][C]0.015514[/C][/ROW]
[ROW][C]10[/C][C]-0.650829[/C][C]-7.0997[/C][C]0[/C][/ROW]
[ROW][C]11[/C][C]-0.253004[/C][C]-2.7599[/C][C]0.003348[/C][/ROW]
[ROW][C]12[/C][C]0.590593[/C][C]6.4426[/C][C]0[/C][/ROW]
[ROW][C]13[/C][C]-0.125666[/C][C]-1.3709[/C][C]0.086501[/C][/ROW]
[ROW][C]14[/C][C]0.05224[/C][C]0.5699[/C][C]0.284919[/C][/ROW]
[ROW][C]15[/C][C]0.034826[/C][C]0.3799[/C][C]0.352345[/C][/ROW]
[ROW][C]16[/C][C]0.201797[/C][C]2.2013[/C][C]0.01482[/C][/ROW]
[ROW][C]17[/C][C]0.083124[/C][C]0.9068[/C][C]0.18318[/C][/ROW]
[ROW][C]18[/C][C]-0.032777[/C][C]-0.3576[/C][C]0.360656[/C][/ROW]
[ROW][C]19[/C][C]-0.084352[/C][C]-0.9202[/C][C]0.179673[/C][/ROW]
[ROW][C]20[/C][C]0.058302[/C][C]0.636[/C][C]0.262998[/C][/ROW]
[ROW][C]21[/C][C]-0.023763[/C][C]-0.2592[/C][C]0.397954[/C][/ROW]
[ROW][C]22[/C][C]0.086512[/C][C]0.9437[/C][C]0.173608[/C][/ROW]
[ROW][C]23[/C][C]-0.063571[/C][C]-0.6935[/C][C]0.24468[/C][/ROW]
[ROW][C]24[/C][C]-0.053814[/C][C]-0.587[/C][C]0.279143[/C][/ROW]
[ROW][C]25[/C][C]-0.024247[/C][C]-0.2645[/C][C]0.395923[/C][/ROW]
[ROW][C]26[/C][C]-0.094216[/C][C]-1.0278[/C][C]0.153071[/C][/ROW]
[ROW][C]27[/C][C]-0.026869[/C][C]-0.2931[/C][C]0.384976[/C][/ROW]
[ROW][C]28[/C][C]-0.004665[/C][C]-0.0509[/C][C]0.479749[/C][/ROW]
[ROW][C]29[/C][C]-0.100562[/C][C]-1.097[/C][C]0.137428[/C][/ROW]
[ROW][C]30[/C][C]-0.038503[/C][C]-0.42[/C][C]0.337614[/C][/ROW]
[ROW][C]31[/C][C]-0.00253[/C][C]-0.0276[/C][C]0.489016[/C][/ROW]
[ROW][C]32[/C][C]-0.00674[/C][C]-0.0735[/C][C]0.470757[/C][/ROW]
[ROW][C]33[/C][C]0.020925[/C][C]0.2283[/C][C]0.409915[/C][/ROW]
[ROW][C]34[/C][C]0.01095[/C][C]0.1195[/C][C]0.452559[/C][/ROW]
[ROW][C]35[/C][C]-0.031542[/C][C]-0.3441[/C][C]0.365697[/C][/ROW]
[ROW][C]36[/C][C]-0.079127[/C][C]-0.8632[/C][C]0.194889[/C][/ROW]
[ROW][C]37[/C][C]0.062009[/C][C]0.6764[/C][C]0.250036[/C][/ROW]
[ROW][C]38[/C][C]-0.040682[/C][C]-0.4438[/C][C]0.329[/C][/ROW]
[ROW][C]39[/C][C]-0.0132[/C][C]-0.144[/C][C]0.442875[/C][/ROW]
[ROW][C]40[/C][C]-0.127973[/C][C]-1.396[/C][C]0.082654[/C][/ROW]
[ROW][C]41[/C][C]0.04207[/C][C]0.4589[/C][C]0.323563[/C][/ROW]
[ROW][C]42[/C][C]0.03147[/C][C]0.3433[/C][C]0.365991[/C][/ROW]
[ROW][C]43[/C][C]-0.032029[/C][C]-0.3494[/C][C]0.363704[/C][/ROW]
[ROW][C]44[/C][C]0.003044[/C][C]0.0332[/C][C]0.486784[/C][/ROW]
[ROW][C]45[/C][C]-0.039572[/C][C]-0.4317[/C][C]0.333377[/C][/ROW]
[ROW][C]46[/C][C]-0.024771[/C][C]-0.2702[/C][C]0.393731[/C][/ROW]
[ROW][C]47[/C][C]-0.034966[/C][C]-0.3814[/C][C]0.351781[/C][/ROW]
[ROW][C]48[/C][C]-0.008036[/C][C]-0.0877[/C][C]0.465146[/C][/ROW]
[/TABLE]
Source: https://freestatistics.org/blog/index.php?pk=79211&T=2

Globally Unique Identifier (entire table): ba.freestatistics.org/blog/index.php?pk=79211&T=2

As an alternative you can also use a QR Code:  

The GUIDs for individual cells are displayed in the table below:

Partial Autocorrelation Function
Time lag kPACF(k)T-STATP-value
10.1660241.81110.036324
2-0.367726-4.01145.3e-05
3-0.111948-1.22120.112211
4-0.366634-3.99955.5e-05
5-0.008893-0.0970.461441
6-0.088189-0.9620.168992
7-0.02714-0.29610.383848
8-0.31482-3.43430.000409
9-0.200079-2.18260.015514
10-0.650829-7.09970
11-0.253004-2.75990.003348
120.5905936.44260
13-0.125666-1.37090.086501
140.052240.56990.284919
150.0348260.37990.352345
160.2017972.20130.01482
170.0831240.90680.18318
18-0.032777-0.35760.360656
19-0.084352-0.92020.179673
200.0583020.6360.262998
21-0.023763-0.25920.397954
220.0865120.94370.173608
23-0.063571-0.69350.24468
24-0.053814-0.5870.279143
25-0.024247-0.26450.395923
26-0.094216-1.02780.153071
27-0.026869-0.29310.384976
28-0.004665-0.05090.479749
29-0.100562-1.0970.137428
30-0.038503-0.420.337614
31-0.00253-0.02760.489016
32-0.00674-0.07350.470757
330.0209250.22830.409915
340.010950.11950.452559
35-0.031542-0.34410.365697
36-0.079127-0.86320.194889
370.0620090.67640.250036
38-0.040682-0.44380.329
39-0.0132-0.1440.442875
40-0.127973-1.3960.082654
410.042070.45890.323563
420.031470.34330.365991
43-0.032029-0.34940.363704
440.0030440.03320.486784
45-0.039572-0.43170.333377
46-0.024771-0.27020.393731
47-0.034966-0.38140.351781
48-0.008036-0.08770.465146


Parameters (Session):
par1 = 48 ; par2 = 1 ; par3 = 1 ; par4 = 0 ; par5 = 12 ; par6 = White Noise ; par7 = 0.95 ;
Parameters (R input):
par1 = 48 ; par2 = 1 ; par3 = 1 ; par4 = 0 ; par5 = 12 ; par6 = White Noise ; par7 = 0.95 ;
R code (references can be found in the software module):
if (par1 == 'Default') {
par1 = 10*log10(length(x))
} else {
par1 <- as.numeric(par1)
}
par2 <- as.numeric(par2)
par3 <- as.numeric(par3)
par4 <- as.numeric(par4)
par5 <- as.numeric(par5)
if (par6 == 'White Noise') par6 <- 'white' else par6 <- 'ma'
par7 <- as.numeric(par7)
if (par2 == 0) {
x <- log(x)
} else {
x <- (x ^ par2 - 1) / par2
}
if (par3 > 0) x <- diff(x,lag=1,difference=par3)
if (par4 > 0) x <- diff(x,lag=par5,difference=par4)
bitmap(file='pic1.png')
racf <- acf(x, par1, main='Autocorrelation', xlab='time lag', ylab='ACF', ci.type=par6, ci=par7, sub=paste('(lambda=',par2,', d=',par3,', D=',par4,', CI=', par7, ', CI type=',par6,')',sep=''))
dev.off()
bitmap(file='pic2.png')
rpacf <- pacf(x,par1,main='Partial Autocorrelation',xlab='lags',ylab='PACF')
dev.off()
(myacf <- c(racf$acf))
(mypacf <- c(rpacf$acf))
lengthx <- length(x)
sqrtn <- sqrt(lengthx)
load(file='createtable')
a<-table.start()
a<-table.row.start(a)
a<-table.element(a,'Autocorrelation Function',4,TRUE)
a<-table.row.end(a)
a<-table.row.start(a)
a<-table.element(a,'Time lag k',header=TRUE)
a<-table.element(a,hyperlink('basics.htm','ACF(k)','click here for more information about the Autocorrelation Function'),header=TRUE)
a<-table.element(a,'T-STAT',header=TRUE)
a<-table.element(a,'P-value',header=TRUE)
a<-table.row.end(a)
for (i in 2:(par1+1)) {
a<-table.row.start(a)
a<-table.element(a,i-1,header=TRUE)
a<-table.element(a,round(myacf[i],6))
mytstat <- myacf[i]*sqrtn
a<-table.element(a,round(mytstat,4))
a<-table.element(a,round(1-pt(abs(mytstat),lengthx),6))
a<-table.row.end(a)
}
a<-table.end(a)
table.save(a,file='mytable.tab')
a<-table.start()
a<-table.row.start(a)
a<-table.element(a,'Partial Autocorrelation Function',4,TRUE)
a<-table.row.end(a)
a<-table.row.start(a)
a<-table.element(a,'Time lag k',header=TRUE)
a<-table.element(a,hyperlink('basics.htm','PACF(k)','click here for more information about the Partial Autocorrelation Function'),header=TRUE)
a<-table.element(a,'T-STAT',header=TRUE)
a<-table.element(a,'P-value',header=TRUE)
a<-table.row.end(a)
for (i in 1:par1) {
a<-table.row.start(a)
a<-table.element(a,i,header=TRUE)
a<-table.element(a,round(mypacf[i],6))
mytstat <- mypacf[i]*sqrtn
a<-table.element(a,round(mytstat,4))
a<-table.element(a,round(1-pt(abs(mytstat),lengthx),6))
a<-table.row.end(a)
}
a<-table.end(a)
table.save(a,file='mytable1.tab')