Free Statistics

of Irreproducible Research!

Author's title

Author*Unverified author*
R Software Modulerwasp_autocorrelation.wasp
Title produced by software(Partial) Autocorrelation Function
Date of computationWed, 18 Aug 2010 17:57:58 +0000
Cite this page as followsStatistical Computations at FreeStatistics.org, Office for Research Development and Education, URL https://freestatistics.org/blog/index.php?v=date/2010/Aug/18/t1282154261qowhdbl7mv1bj8x.htm/, Retrieved Thu, 16 May 2024 16:30:34 +0000
Statistical Computations at FreeStatistics.org, Office for Research Development and Education, URL https://freestatistics.org/blog/index.php?pk=79210, Retrieved Thu, 16 May 2024 16:30:34 +0000
QR Codes:

Original text written by user:
IsPrivate?No (this computation is public)
User-defined keywordsPatrick Fieremans
Estimated Impact156
Family? (F = Feedback message, R = changed R code, M = changed R Module, P = changed Parameters, D = changed Data)
-       [(Partial) Autocorrelation Function] [Tijdreeks 1 - Sta...] [2010-08-18 17:57:58] [ad57e680f18cfe8dd712ed1113a582da] [Current]
Feedback Forum

Post a new message
Dataseries X:
136
135
134
132
152
151
136
126
127
127
128
130
125
118
111
104
126
131
122
116
115
115
113
122
114
106
93
89
114
122
115
116
120
120
120
121
118
112
99
96
120
135
128
134
134
132
130
125
124
114
101
101
123
143
133
136
137
135
141
136
133
124
110
104
130
160
142
142
137
135
139
135
134
120
103
101
127
159
141
140
135
127
130
128
126
110
101
102
129
169
146
145
138
123
124
137
132
112
105
106
137
175
151
142
140
122
127
135
128
117
107
108
134
171
154
146
148
122
124
135


Summary of computational transaction
Raw Inputview raw input (R code)
Raw Outputview raw output of R engine
Computing time1 seconds
R Server'Gwilym Jenkins' @ 72.249.127.135

\begin{tabular}{lllllllll}
\hline
Summary of computational transaction \tabularnewline
Raw Input & view raw input (R code)  \tabularnewline
Raw Output & view raw output of R engine  \tabularnewline
Computing time & 1 seconds \tabularnewline
R Server & 'Gwilym Jenkins' @ 72.249.127.135 \tabularnewline
\hline
\end{tabular}
%Source: https://freestatistics.org/blog/index.php?pk=79210&T=0

[TABLE]
[ROW][C]Summary of computational transaction[/C][/ROW]
[ROW][C]Raw Input[/C][C]view raw input (R code) [/C][/ROW]
[ROW][C]Raw Output[/C][C]view raw output of R engine [/C][/ROW]
[ROW][C]Computing time[/C][C]1 seconds[/C][/ROW]
[ROW][C]R Server[/C][C]'Gwilym Jenkins' @ 72.249.127.135[/C][/ROW]
[/TABLE]
Source: https://freestatistics.org/blog/index.php?pk=79210&T=0

Globally Unique Identifier (entire table): ba.freestatistics.org/blog/index.php?pk=79210&T=0

As an alternative you can also use a QR Code:  

The GUIDs for individual cells are displayed in the table below:

Summary of computational transaction
Raw Inputview raw input (R code)
Raw Outputview raw output of R engine
Computing time1 seconds
R Server'Gwilym Jenkins' @ 72.249.127.135


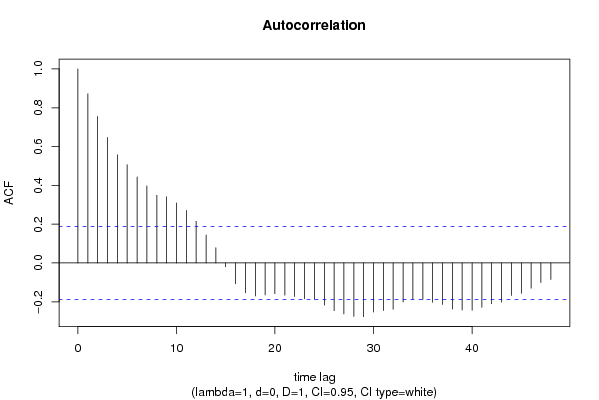
Autocorrelation Function
Time lag kACF(k)T-STATP-value
10.8716069.0580
20.7553497.84980
30.6469626.72340
40.5577795.79660
50.5064735.26340
60.4432354.60626e-06
70.397284.12873.6e-05
80.3488513.62540.000221
90.3411453.54530.000291
100.3096753.21820.000852
110.2709932.81620.002889
120.2150942.23530.013727
130.1440841.49740.068608
140.0791340.82240.206336
15-0.019884-0.20660.418342
16-0.107564-1.11780.133058
17-0.153466-1.59490.056832
18-0.170171-1.76850.039903
19-0.164833-1.7130.044791
20-0.158392-1.64610.05133
21-0.166041-1.72550.043644
22-0.173217-1.80010.037316
23-0.184887-1.92140.028659
24-0.187483-1.94840.026982
25-0.216974-2.25490.01308
26-0.245589-2.55220.006051
27-0.262307-2.7260.003741
28-0.275535-2.86340.002518
29-0.276607-2.87460.002437
30-0.252887-2.62810.004919
31-0.245237-2.54860.006111
32-0.238585-2.47940.007352
33-0.200848-2.08730.019608
34-0.185465-1.92740.028277
35-0.18878-1.96190.026176
36-0.202529-2.10470.018817
37-0.213624-2.220.014252
38-0.237712-2.47040.007531
39-0.242668-2.52190.006566
40-0.243684-2.53240.006382
41-0.228222-2.37180.009737
42-0.209936-2.18170.015649
43-0.201397-2.0930.019347
44-0.167448-1.74020.042339
45-0.156457-1.62590.053438
46-0.130009-1.35110.089745
47-0.1012-1.05170.147641
48-0.084679-0.880.190404

\begin{tabular}{lllllllll}
\hline
Autocorrelation Function \tabularnewline
Time lag k & ACF(k) & T-STAT & P-value \tabularnewline
1 & 0.871606 & 9.058 & 0 \tabularnewline
2 & 0.755349 & 7.8498 & 0 \tabularnewline
3 & 0.646962 & 6.7234 & 0 \tabularnewline
4 & 0.557779 & 5.7966 & 0 \tabularnewline
5 & 0.506473 & 5.2634 & 0 \tabularnewline
6 & 0.443235 & 4.6062 & 6e-06 \tabularnewline
7 & 0.39728 & 4.1287 & 3.6e-05 \tabularnewline
8 & 0.348851 & 3.6254 & 0.000221 \tabularnewline
9 & 0.341145 & 3.5453 & 0.000291 \tabularnewline
10 & 0.309675 & 3.2182 & 0.000852 \tabularnewline
11 & 0.270993 & 2.8162 & 0.002889 \tabularnewline
12 & 0.215094 & 2.2353 & 0.013727 \tabularnewline
13 & 0.144084 & 1.4974 & 0.068608 \tabularnewline
14 & 0.079134 & 0.8224 & 0.206336 \tabularnewline
15 & -0.019884 & -0.2066 & 0.418342 \tabularnewline
16 & -0.107564 & -1.1178 & 0.133058 \tabularnewline
17 & -0.153466 & -1.5949 & 0.056832 \tabularnewline
18 & -0.170171 & -1.7685 & 0.039903 \tabularnewline
19 & -0.164833 & -1.713 & 0.044791 \tabularnewline
20 & -0.158392 & -1.6461 & 0.05133 \tabularnewline
21 & -0.166041 & -1.7255 & 0.043644 \tabularnewline
22 & -0.173217 & -1.8001 & 0.037316 \tabularnewline
23 & -0.184887 & -1.9214 & 0.028659 \tabularnewline
24 & -0.187483 & -1.9484 & 0.026982 \tabularnewline
25 & -0.216974 & -2.2549 & 0.01308 \tabularnewline
26 & -0.245589 & -2.5522 & 0.006051 \tabularnewline
27 & -0.262307 & -2.726 & 0.003741 \tabularnewline
28 & -0.275535 & -2.8634 & 0.002518 \tabularnewline
29 & -0.276607 & -2.8746 & 0.002437 \tabularnewline
30 & -0.252887 & -2.6281 & 0.004919 \tabularnewline
31 & -0.245237 & -2.5486 & 0.006111 \tabularnewline
32 & -0.238585 & -2.4794 & 0.007352 \tabularnewline
33 & -0.200848 & -2.0873 & 0.019608 \tabularnewline
34 & -0.185465 & -1.9274 & 0.028277 \tabularnewline
35 & -0.18878 & -1.9619 & 0.026176 \tabularnewline
36 & -0.202529 & -2.1047 & 0.018817 \tabularnewline
37 & -0.213624 & -2.22 & 0.014252 \tabularnewline
38 & -0.237712 & -2.4704 & 0.007531 \tabularnewline
39 & -0.242668 & -2.5219 & 0.006566 \tabularnewline
40 & -0.243684 & -2.5324 & 0.006382 \tabularnewline
41 & -0.228222 & -2.3718 & 0.009737 \tabularnewline
42 & -0.209936 & -2.1817 & 0.015649 \tabularnewline
43 & -0.201397 & -2.093 & 0.019347 \tabularnewline
44 & -0.167448 & -1.7402 & 0.042339 \tabularnewline
45 & -0.156457 & -1.6259 & 0.053438 \tabularnewline
46 & -0.130009 & -1.3511 & 0.089745 \tabularnewline
47 & -0.1012 & -1.0517 & 0.147641 \tabularnewline
48 & -0.084679 & -0.88 & 0.190404 \tabularnewline
\hline
\end{tabular}
%Source: https://freestatistics.org/blog/index.php?pk=79210&T=1

[TABLE]
[ROW][C]Autocorrelation Function[/C][/ROW]
[ROW][C]Time lag k[/C][C]ACF(k)[/C][C]T-STAT[/C][C]P-value[/C][/ROW]
[ROW][C]1[/C][C]0.871606[/C][C]9.058[/C][C]0[/C][/ROW]
[ROW][C]2[/C][C]0.755349[/C][C]7.8498[/C][C]0[/C][/ROW]
[ROW][C]3[/C][C]0.646962[/C][C]6.7234[/C][C]0[/C][/ROW]
[ROW][C]4[/C][C]0.557779[/C][C]5.7966[/C][C]0[/C][/ROW]
[ROW][C]5[/C][C]0.506473[/C][C]5.2634[/C][C]0[/C][/ROW]
[ROW][C]6[/C][C]0.443235[/C][C]4.6062[/C][C]6e-06[/C][/ROW]
[ROW][C]7[/C][C]0.39728[/C][C]4.1287[/C][C]3.6e-05[/C][/ROW]
[ROW][C]8[/C][C]0.348851[/C][C]3.6254[/C][C]0.000221[/C][/ROW]
[ROW][C]9[/C][C]0.341145[/C][C]3.5453[/C][C]0.000291[/C][/ROW]
[ROW][C]10[/C][C]0.309675[/C][C]3.2182[/C][C]0.000852[/C][/ROW]
[ROW][C]11[/C][C]0.270993[/C][C]2.8162[/C][C]0.002889[/C][/ROW]
[ROW][C]12[/C][C]0.215094[/C][C]2.2353[/C][C]0.013727[/C][/ROW]
[ROW][C]13[/C][C]0.144084[/C][C]1.4974[/C][C]0.068608[/C][/ROW]
[ROW][C]14[/C][C]0.079134[/C][C]0.8224[/C][C]0.206336[/C][/ROW]
[ROW][C]15[/C][C]-0.019884[/C][C]-0.2066[/C][C]0.418342[/C][/ROW]
[ROW][C]16[/C][C]-0.107564[/C][C]-1.1178[/C][C]0.133058[/C][/ROW]
[ROW][C]17[/C][C]-0.153466[/C][C]-1.5949[/C][C]0.056832[/C][/ROW]
[ROW][C]18[/C][C]-0.170171[/C][C]-1.7685[/C][C]0.039903[/C][/ROW]
[ROW][C]19[/C][C]-0.164833[/C][C]-1.713[/C][C]0.044791[/C][/ROW]
[ROW][C]20[/C][C]-0.158392[/C][C]-1.6461[/C][C]0.05133[/C][/ROW]
[ROW][C]21[/C][C]-0.166041[/C][C]-1.7255[/C][C]0.043644[/C][/ROW]
[ROW][C]22[/C][C]-0.173217[/C][C]-1.8001[/C][C]0.037316[/C][/ROW]
[ROW][C]23[/C][C]-0.184887[/C][C]-1.9214[/C][C]0.028659[/C][/ROW]
[ROW][C]24[/C][C]-0.187483[/C][C]-1.9484[/C][C]0.026982[/C][/ROW]
[ROW][C]25[/C][C]-0.216974[/C][C]-2.2549[/C][C]0.01308[/C][/ROW]
[ROW][C]26[/C][C]-0.245589[/C][C]-2.5522[/C][C]0.006051[/C][/ROW]
[ROW][C]27[/C][C]-0.262307[/C][C]-2.726[/C][C]0.003741[/C][/ROW]
[ROW][C]28[/C][C]-0.275535[/C][C]-2.8634[/C][C]0.002518[/C][/ROW]
[ROW][C]29[/C][C]-0.276607[/C][C]-2.8746[/C][C]0.002437[/C][/ROW]
[ROW][C]30[/C][C]-0.252887[/C][C]-2.6281[/C][C]0.004919[/C][/ROW]
[ROW][C]31[/C][C]-0.245237[/C][C]-2.5486[/C][C]0.006111[/C][/ROW]
[ROW][C]32[/C][C]-0.238585[/C][C]-2.4794[/C][C]0.007352[/C][/ROW]
[ROW][C]33[/C][C]-0.200848[/C][C]-2.0873[/C][C]0.019608[/C][/ROW]
[ROW][C]34[/C][C]-0.185465[/C][C]-1.9274[/C][C]0.028277[/C][/ROW]
[ROW][C]35[/C][C]-0.18878[/C][C]-1.9619[/C][C]0.026176[/C][/ROW]
[ROW][C]36[/C][C]-0.202529[/C][C]-2.1047[/C][C]0.018817[/C][/ROW]
[ROW][C]37[/C][C]-0.213624[/C][C]-2.22[/C][C]0.014252[/C][/ROW]
[ROW][C]38[/C][C]-0.237712[/C][C]-2.4704[/C][C]0.007531[/C][/ROW]
[ROW][C]39[/C][C]-0.242668[/C][C]-2.5219[/C][C]0.006566[/C][/ROW]
[ROW][C]40[/C][C]-0.243684[/C][C]-2.5324[/C][C]0.006382[/C][/ROW]
[ROW][C]41[/C][C]-0.228222[/C][C]-2.3718[/C][C]0.009737[/C][/ROW]
[ROW][C]42[/C][C]-0.209936[/C][C]-2.1817[/C][C]0.015649[/C][/ROW]
[ROW][C]43[/C][C]-0.201397[/C][C]-2.093[/C][C]0.019347[/C][/ROW]
[ROW][C]44[/C][C]-0.167448[/C][C]-1.7402[/C][C]0.042339[/C][/ROW]
[ROW][C]45[/C][C]-0.156457[/C][C]-1.6259[/C][C]0.053438[/C][/ROW]
[ROW][C]46[/C][C]-0.130009[/C][C]-1.3511[/C][C]0.089745[/C][/ROW]
[ROW][C]47[/C][C]-0.1012[/C][C]-1.0517[/C][C]0.147641[/C][/ROW]
[ROW][C]48[/C][C]-0.084679[/C][C]-0.88[/C][C]0.190404[/C][/ROW]
[/TABLE]
Source: https://freestatistics.org/blog/index.php?pk=79210&T=1

Globally Unique Identifier (entire table): ba.freestatistics.org/blog/index.php?pk=79210&T=1

As an alternative you can also use a QR Code:  

The GUIDs for individual cells are displayed in the table below:

Autocorrelation Function
Time lag kACF(k)T-STATP-value
10.8716069.0580
20.7553497.84980
30.6469626.72340
40.5577795.79660
50.5064735.26340
60.4432354.60626e-06
70.397284.12873.6e-05
80.3488513.62540.000221
90.3411453.54530.000291
100.3096753.21820.000852
110.2709932.81620.002889
120.2150942.23530.013727
130.1440841.49740.068608
140.0791340.82240.206336
15-0.019884-0.20660.418342
16-0.107564-1.11780.133058
17-0.153466-1.59490.056832
18-0.170171-1.76850.039903
19-0.164833-1.7130.044791
20-0.158392-1.64610.05133
21-0.166041-1.72550.043644
22-0.173217-1.80010.037316
23-0.184887-1.92140.028659
24-0.187483-1.94840.026982
25-0.216974-2.25490.01308
26-0.245589-2.55220.006051
27-0.262307-2.7260.003741
28-0.275535-2.86340.002518
29-0.276607-2.87460.002437
30-0.252887-2.62810.004919
31-0.245237-2.54860.006111
32-0.238585-2.47940.007352
33-0.200848-2.08730.019608
34-0.185465-1.92740.028277
35-0.18878-1.96190.026176
36-0.202529-2.10470.018817
37-0.213624-2.220.014252
38-0.237712-2.47040.007531
39-0.242668-2.52190.006566
40-0.243684-2.53240.006382
41-0.228222-2.37180.009737
42-0.209936-2.18170.015649
43-0.201397-2.0930.019347
44-0.167448-1.74020.042339
45-0.156457-1.62590.053438
46-0.130009-1.35110.089745
47-0.1012-1.05170.147641
48-0.084679-0.880.190404


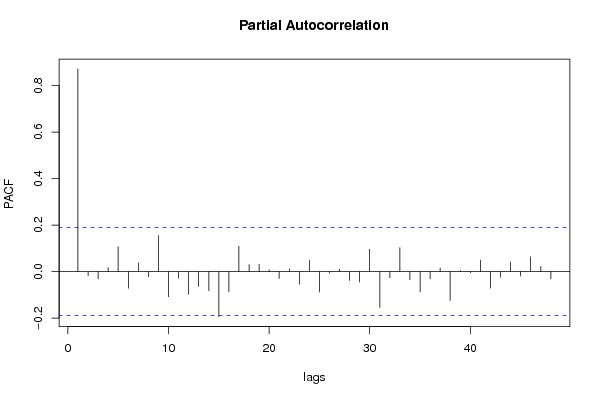
Partial Autocorrelation Function
Time lag kPACF(k)T-STATP-value
10.8716069.0580
2-0.01809-0.1880.425616
3-0.031419-0.32650.372334
40.0168360.1750.430716
50.1068911.11080.134552
6-0.071613-0.74420.229178
70.0369730.38420.35078
8-0.022239-0.23110.408831
90.1549441.61020.055134
10-0.108143-1.12390.131784
11-0.028781-0.29910.382719
12-0.097252-1.01070.157216
13-0.064162-0.66680.253165
14-0.082123-0.85340.19765
15-0.194074-2.01690.023095
16-0.087455-0.90890.182724
170.1089551.13230.13001
180.0302770.31470.376816
190.030850.32060.374565
200.0075560.07850.468778
21-0.030309-0.3150.376692
220.0114290.11880.452839
23-0.055134-0.5730.283928
240.0480670.49950.309211
25-0.08827-0.91730.180507
26-0.006931-0.0720.471354
270.0095580.09930.46053
28-0.039003-0.40530.343016
29-0.045234-0.47010.319622
300.0961350.99910.159997
31-0.154506-1.60570.055633
32-0.026422-0.27460.392079
330.1026661.06690.144191
34-0.035319-0.3670.357152
35-0.087536-0.90970.182502
36-0.031306-0.32530.372776
370.0152080.1580.437359
38-0.124429-1.29310.099367
390.0040710.04230.483168
40-0.004685-0.04870.48063
410.0490690.50990.305569
42-0.070832-0.73610.231632
43-0.02403-0.24970.401637
440.0410490.42660.335264
45-0.019215-0.19970.421048
460.06350.65990.255356
470.0218960.22760.410213
48-0.03166-0.3290.371388

\begin{tabular}{lllllllll}
\hline
Partial Autocorrelation Function \tabularnewline
Time lag k & PACF(k) & T-STAT & P-value \tabularnewline
1 & 0.871606 & 9.058 & 0 \tabularnewline
2 & -0.01809 & -0.188 & 0.425616 \tabularnewline
3 & -0.031419 & -0.3265 & 0.372334 \tabularnewline
4 & 0.016836 & 0.175 & 0.430716 \tabularnewline
5 & 0.106891 & 1.1108 & 0.134552 \tabularnewline
6 & -0.071613 & -0.7442 & 0.229178 \tabularnewline
7 & 0.036973 & 0.3842 & 0.35078 \tabularnewline
8 & -0.022239 & -0.2311 & 0.408831 \tabularnewline
9 & 0.154944 & 1.6102 & 0.055134 \tabularnewline
10 & -0.108143 & -1.1239 & 0.131784 \tabularnewline
11 & -0.028781 & -0.2991 & 0.382719 \tabularnewline
12 & -0.097252 & -1.0107 & 0.157216 \tabularnewline
13 & -0.064162 & -0.6668 & 0.253165 \tabularnewline
14 & -0.082123 & -0.8534 & 0.19765 \tabularnewline
15 & -0.194074 & -2.0169 & 0.023095 \tabularnewline
16 & -0.087455 & -0.9089 & 0.182724 \tabularnewline
17 & 0.108955 & 1.1323 & 0.13001 \tabularnewline
18 & 0.030277 & 0.3147 & 0.376816 \tabularnewline
19 & 0.03085 & 0.3206 & 0.374565 \tabularnewline
20 & 0.007556 & 0.0785 & 0.468778 \tabularnewline
21 & -0.030309 & -0.315 & 0.376692 \tabularnewline
22 & 0.011429 & 0.1188 & 0.452839 \tabularnewline
23 & -0.055134 & -0.573 & 0.283928 \tabularnewline
24 & 0.048067 & 0.4995 & 0.309211 \tabularnewline
25 & -0.08827 & -0.9173 & 0.180507 \tabularnewline
26 & -0.006931 & -0.072 & 0.471354 \tabularnewline
27 & 0.009558 & 0.0993 & 0.46053 \tabularnewline
28 & -0.039003 & -0.4053 & 0.343016 \tabularnewline
29 & -0.045234 & -0.4701 & 0.319622 \tabularnewline
30 & 0.096135 & 0.9991 & 0.159997 \tabularnewline
31 & -0.154506 & -1.6057 & 0.055633 \tabularnewline
32 & -0.026422 & -0.2746 & 0.392079 \tabularnewline
33 & 0.102666 & 1.0669 & 0.144191 \tabularnewline
34 & -0.035319 & -0.367 & 0.357152 \tabularnewline
35 & -0.087536 & -0.9097 & 0.182502 \tabularnewline
36 & -0.031306 & -0.3253 & 0.372776 \tabularnewline
37 & 0.015208 & 0.158 & 0.437359 \tabularnewline
38 & -0.124429 & -1.2931 & 0.099367 \tabularnewline
39 & 0.004071 & 0.0423 & 0.483168 \tabularnewline
40 & -0.004685 & -0.0487 & 0.48063 \tabularnewline
41 & 0.049069 & 0.5099 & 0.305569 \tabularnewline
42 & -0.070832 & -0.7361 & 0.231632 \tabularnewline
43 & -0.02403 & -0.2497 & 0.401637 \tabularnewline
44 & 0.041049 & 0.4266 & 0.335264 \tabularnewline
45 & -0.019215 & -0.1997 & 0.421048 \tabularnewline
46 & 0.0635 & 0.6599 & 0.255356 \tabularnewline
47 & 0.021896 & 0.2276 & 0.410213 \tabularnewline
48 & -0.03166 & -0.329 & 0.371388 \tabularnewline
\hline
\end{tabular}
%Source: https://freestatistics.org/blog/index.php?pk=79210&T=2

[TABLE]
[ROW][C]Partial Autocorrelation Function[/C][/ROW]
[ROW][C]Time lag k[/C][C]PACF(k)[/C][C]T-STAT[/C][C]P-value[/C][/ROW]
[ROW][C]1[/C][C]0.871606[/C][C]9.058[/C][C]0[/C][/ROW]
[ROW][C]2[/C][C]-0.01809[/C][C]-0.188[/C][C]0.425616[/C][/ROW]
[ROW][C]3[/C][C]-0.031419[/C][C]-0.3265[/C][C]0.372334[/C][/ROW]
[ROW][C]4[/C][C]0.016836[/C][C]0.175[/C][C]0.430716[/C][/ROW]
[ROW][C]5[/C][C]0.106891[/C][C]1.1108[/C][C]0.134552[/C][/ROW]
[ROW][C]6[/C][C]-0.071613[/C][C]-0.7442[/C][C]0.229178[/C][/ROW]
[ROW][C]7[/C][C]0.036973[/C][C]0.3842[/C][C]0.35078[/C][/ROW]
[ROW][C]8[/C][C]-0.022239[/C][C]-0.2311[/C][C]0.408831[/C][/ROW]
[ROW][C]9[/C][C]0.154944[/C][C]1.6102[/C][C]0.055134[/C][/ROW]
[ROW][C]10[/C][C]-0.108143[/C][C]-1.1239[/C][C]0.131784[/C][/ROW]
[ROW][C]11[/C][C]-0.028781[/C][C]-0.2991[/C][C]0.382719[/C][/ROW]
[ROW][C]12[/C][C]-0.097252[/C][C]-1.0107[/C][C]0.157216[/C][/ROW]
[ROW][C]13[/C][C]-0.064162[/C][C]-0.6668[/C][C]0.253165[/C][/ROW]
[ROW][C]14[/C][C]-0.082123[/C][C]-0.8534[/C][C]0.19765[/C][/ROW]
[ROW][C]15[/C][C]-0.194074[/C][C]-2.0169[/C][C]0.023095[/C][/ROW]
[ROW][C]16[/C][C]-0.087455[/C][C]-0.9089[/C][C]0.182724[/C][/ROW]
[ROW][C]17[/C][C]0.108955[/C][C]1.1323[/C][C]0.13001[/C][/ROW]
[ROW][C]18[/C][C]0.030277[/C][C]0.3147[/C][C]0.376816[/C][/ROW]
[ROW][C]19[/C][C]0.03085[/C][C]0.3206[/C][C]0.374565[/C][/ROW]
[ROW][C]20[/C][C]0.007556[/C][C]0.0785[/C][C]0.468778[/C][/ROW]
[ROW][C]21[/C][C]-0.030309[/C][C]-0.315[/C][C]0.376692[/C][/ROW]
[ROW][C]22[/C][C]0.011429[/C][C]0.1188[/C][C]0.452839[/C][/ROW]
[ROW][C]23[/C][C]-0.055134[/C][C]-0.573[/C][C]0.283928[/C][/ROW]
[ROW][C]24[/C][C]0.048067[/C][C]0.4995[/C][C]0.309211[/C][/ROW]
[ROW][C]25[/C][C]-0.08827[/C][C]-0.9173[/C][C]0.180507[/C][/ROW]
[ROW][C]26[/C][C]-0.006931[/C][C]-0.072[/C][C]0.471354[/C][/ROW]
[ROW][C]27[/C][C]0.009558[/C][C]0.0993[/C][C]0.46053[/C][/ROW]
[ROW][C]28[/C][C]-0.039003[/C][C]-0.4053[/C][C]0.343016[/C][/ROW]
[ROW][C]29[/C][C]-0.045234[/C][C]-0.4701[/C][C]0.319622[/C][/ROW]
[ROW][C]30[/C][C]0.096135[/C][C]0.9991[/C][C]0.159997[/C][/ROW]
[ROW][C]31[/C][C]-0.154506[/C][C]-1.6057[/C][C]0.055633[/C][/ROW]
[ROW][C]32[/C][C]-0.026422[/C][C]-0.2746[/C][C]0.392079[/C][/ROW]
[ROW][C]33[/C][C]0.102666[/C][C]1.0669[/C][C]0.144191[/C][/ROW]
[ROW][C]34[/C][C]-0.035319[/C][C]-0.367[/C][C]0.357152[/C][/ROW]
[ROW][C]35[/C][C]-0.087536[/C][C]-0.9097[/C][C]0.182502[/C][/ROW]
[ROW][C]36[/C][C]-0.031306[/C][C]-0.3253[/C][C]0.372776[/C][/ROW]
[ROW][C]37[/C][C]0.015208[/C][C]0.158[/C][C]0.437359[/C][/ROW]
[ROW][C]38[/C][C]-0.124429[/C][C]-1.2931[/C][C]0.099367[/C][/ROW]
[ROW][C]39[/C][C]0.004071[/C][C]0.0423[/C][C]0.483168[/C][/ROW]
[ROW][C]40[/C][C]-0.004685[/C][C]-0.0487[/C][C]0.48063[/C][/ROW]
[ROW][C]41[/C][C]0.049069[/C][C]0.5099[/C][C]0.305569[/C][/ROW]
[ROW][C]42[/C][C]-0.070832[/C][C]-0.7361[/C][C]0.231632[/C][/ROW]
[ROW][C]43[/C][C]-0.02403[/C][C]-0.2497[/C][C]0.401637[/C][/ROW]
[ROW][C]44[/C][C]0.041049[/C][C]0.4266[/C][C]0.335264[/C][/ROW]
[ROW][C]45[/C][C]-0.019215[/C][C]-0.1997[/C][C]0.421048[/C][/ROW]
[ROW][C]46[/C][C]0.0635[/C][C]0.6599[/C][C]0.255356[/C][/ROW]
[ROW][C]47[/C][C]0.021896[/C][C]0.2276[/C][C]0.410213[/C][/ROW]
[ROW][C]48[/C][C]-0.03166[/C][C]-0.329[/C][C]0.371388[/C][/ROW]
[/TABLE]
Source: https://freestatistics.org/blog/index.php?pk=79210&T=2

Globally Unique Identifier (entire table): ba.freestatistics.org/blog/index.php?pk=79210&T=2

As an alternative you can also use a QR Code:  

The GUIDs for individual cells are displayed in the table below:

Partial Autocorrelation Function
Time lag kPACF(k)T-STATP-value
10.8716069.0580
2-0.01809-0.1880.425616
3-0.031419-0.32650.372334
40.0168360.1750.430716
50.1068911.11080.134552
6-0.071613-0.74420.229178
70.0369730.38420.35078
8-0.022239-0.23110.408831
90.1549441.61020.055134
10-0.108143-1.12390.131784
11-0.028781-0.29910.382719
12-0.097252-1.01070.157216
13-0.064162-0.66680.253165
14-0.082123-0.85340.19765
15-0.194074-2.01690.023095
16-0.087455-0.90890.182724
170.1089551.13230.13001
180.0302770.31470.376816
190.030850.32060.374565
200.0075560.07850.468778
21-0.030309-0.3150.376692
220.0114290.11880.452839
23-0.055134-0.5730.283928
240.0480670.49950.309211
25-0.08827-0.91730.180507
26-0.006931-0.0720.471354
270.0095580.09930.46053
28-0.039003-0.40530.343016
29-0.045234-0.47010.319622
300.0961350.99910.159997
31-0.154506-1.60570.055633
32-0.026422-0.27460.392079
330.1026661.06690.144191
34-0.035319-0.3670.357152
35-0.087536-0.90970.182502
36-0.031306-0.32530.372776
370.0152080.1580.437359
38-0.124429-1.29310.099367
390.0040710.04230.483168
40-0.004685-0.04870.48063
410.0490690.50990.305569
42-0.070832-0.73610.231632
43-0.02403-0.24970.401637
440.0410490.42660.335264
45-0.019215-0.19970.421048
460.06350.65990.255356
470.0218960.22760.410213
48-0.03166-0.3290.371388


Parameters (Session):
par1 = 48 ; par2 = 1 ; par3 = 0 ; par4 = 1 ; par5 = 12 ; par6 = White Noise ; par7 = 0.95 ;
Parameters (R input):
par1 = 48 ; par2 = 1 ; par3 = 0 ; par4 = 1 ; par5 = 12 ; par6 = White Noise ; par7 = 0.95 ;
R code (references can be found in the software module):
if (par1 == 'Default') {
par1 = 10*log10(length(x))
} else {
par1 <- as.numeric(par1)
}
par2 <- as.numeric(par2)
par3 <- as.numeric(par3)
par4 <- as.numeric(par4)
par5 <- as.numeric(par5)
if (par6 == 'White Noise') par6 <- 'white' else par6 <- 'ma'
par7 <- as.numeric(par7)
if (par2 == 0) {
x <- log(x)
} else {
x <- (x ^ par2 - 1) / par2
}
if (par3 > 0) x <- diff(x,lag=1,difference=par3)
if (par4 > 0) x <- diff(x,lag=par5,difference=par4)
bitmap(file='pic1.png')
racf <- acf(x, par1, main='Autocorrelation', xlab='time lag', ylab='ACF', ci.type=par6, ci=par7, sub=paste('(lambda=',par2,', d=',par3,', D=',par4,', CI=', par7, ', CI type=',par6,')',sep=''))
dev.off()
bitmap(file='pic2.png')
rpacf <- pacf(x,par1,main='Partial Autocorrelation',xlab='lags',ylab='PACF')
dev.off()
(myacf <- c(racf$acf))
(mypacf <- c(rpacf$acf))
lengthx <- length(x)
sqrtn <- sqrt(lengthx)
load(file='createtable')
a<-table.start()
a<-table.row.start(a)
a<-table.element(a,'Autocorrelation Function',4,TRUE)
a<-table.row.end(a)
a<-table.row.start(a)
a<-table.element(a,'Time lag k',header=TRUE)
a<-table.element(a,hyperlink('basics.htm','ACF(k)','click here for more information about the Autocorrelation Function'),header=TRUE)
a<-table.element(a,'T-STAT',header=TRUE)
a<-table.element(a,'P-value',header=TRUE)
a<-table.row.end(a)
for (i in 2:(par1+1)) {
a<-table.row.start(a)
a<-table.element(a,i-1,header=TRUE)
a<-table.element(a,round(myacf[i],6))
mytstat <- myacf[i]*sqrtn
a<-table.element(a,round(mytstat,4))
a<-table.element(a,round(1-pt(abs(mytstat),lengthx),6))
a<-table.row.end(a)
}
a<-table.end(a)
table.save(a,file='mytable.tab')
a<-table.start()
a<-table.row.start(a)
a<-table.element(a,'Partial Autocorrelation Function',4,TRUE)
a<-table.row.end(a)
a<-table.row.start(a)
a<-table.element(a,'Time lag k',header=TRUE)
a<-table.element(a,hyperlink('basics.htm','PACF(k)','click here for more information about the Partial Autocorrelation Function'),header=TRUE)
a<-table.element(a,'T-STAT',header=TRUE)
a<-table.element(a,'P-value',header=TRUE)
a<-table.row.end(a)
for (i in 1:par1) {
a<-table.row.start(a)
a<-table.element(a,i,header=TRUE)
a<-table.element(a,round(mypacf[i],6))
mytstat <- mypacf[i]*sqrtn
a<-table.element(a,round(mytstat,4))
a<-table.element(a,round(1-pt(abs(mytstat),lengthx),6))
a<-table.row.end(a)
}
a<-table.end(a)
table.save(a,file='mytable1.tab')