Free Statistics

of Irreproducible Research!

Author's title

autocorrelation Function diff1 - verkocht aantal producten - Mattias Debbau...

Author*Unverified author*
R Software Modulerwasp_autocorrelation.wasp
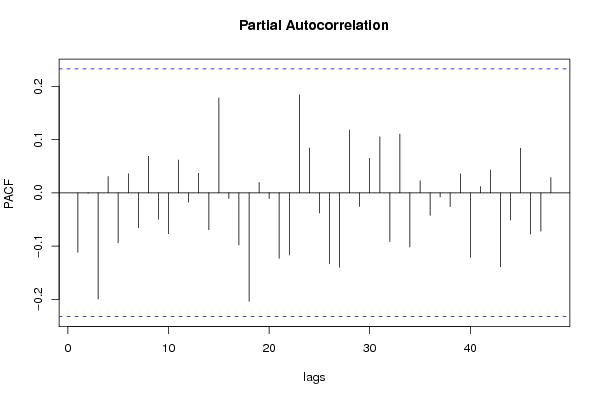
Title produced by software(Partial) Autocorrelation Function
Date of computationWed, 18 Aug 2010 17:36:01 +0000
Cite this page as followsStatistical Computations at FreeStatistics.org, Office for Research Development and Education, URL https://freestatistics.org/blog/index.php?v=date/2010/Aug/18/t12821530497uu30oqkbwiowrc.htm/, Retrieved Thu, 16 May 2024 23:21:06 +0000
Statistical Computations at FreeStatistics.org, Office for Research Development and Education, URL https://freestatistics.org/blog/index.php?pk=79205, Retrieved Thu, 16 May 2024 23:21:06 +0000
QR Codes:

Original text written by user:
IsPrivate?No (this computation is public)
User-defined keywordsmattias debbaut
Estimated Impact139
Family? (F = Feedback message, R = changed R code, M = changed R Module, P = changed Parameters, D = changed Data)
-       [(Partial) Autocorrelation Function] [autocorrelation F...] [2010-08-18 17:36:01] [59fa324537f53fb6459bc6951db20f7b] [Current]
Feedback Forum

Post a new message
Dataseries X:
376
375
374
372
370
369
370
372
373
373
374
376
371
374
369
363
357
366
362
366
361
362
358
363
360
360
348
345
332
333
323
327
332
337
336
337
343
337
326
321
309
302
293
287
292
292
289
302
310
295
276
264
257
243
227
226
226
229
224
240
244
226
208
199
193
180
167
164
166
173
169
191
193
166
143
147
139
129
115
108
106
116
108
135


Summary of computational transaction
Raw Inputview raw input (R code)
Raw Outputview raw output of R engine
Computing time1 seconds
R Server'George Udny Yule' @ 72.249.76.132

\begin{tabular}{lllllllll}
\hline
Summary of computational transaction \tabularnewline
Raw Input & view raw input (R code)  \tabularnewline
Raw Output & view raw output of R engine  \tabularnewline
Computing time & 1 seconds \tabularnewline
R Server & 'George Udny Yule' @ 72.249.76.132 \tabularnewline
\hline
\end{tabular}
%Source: https://freestatistics.org/blog/index.php?pk=79205&T=0

[TABLE]
[ROW][C]Summary of computational transaction[/C][/ROW]
[ROW][C]Raw Input[/C][C]view raw input (R code) [/C][/ROW]
[ROW][C]Raw Output[/C][C]view raw output of R engine [/C][/ROW]
[ROW][C]Computing time[/C][C]1 seconds[/C][/ROW]
[ROW][C]R Server[/C][C]'George Udny Yule' @ 72.249.76.132[/C][/ROW]
[/TABLE]
Source: https://freestatistics.org/blog/index.php?pk=79205&T=0

Globally Unique Identifier (entire table): ba.freestatistics.org/blog/index.php?pk=79205&T=0

As an alternative you can also use a QR Code:  

The GUIDs for individual cells are displayed in the table below:

Summary of computational transaction
Raw Inputview raw input (R code)
Raw Outputview raw output of R engine
Computing time1 seconds
R Server'George Udny Yule' @ 72.249.76.132


Autocorrelation Function
Time lag kACF(k)T-STATP-value
1-0.111525-0.93970.175272
20.0117520.0990.460698
3-0.198082-1.66910.049754
40.0732960.61760.269406
5-0.098098-0.82660.205619
60.0904280.7620.224304
7-0.089947-0.75790.225508
80.1138760.95950.170272
9-0.090124-0.75940.225063
10-0.024302-0.20480.419169
110.021840.1840.427258
120.0272880.22990.409402
130.0196640.16570.434434
14-0.060989-0.51390.304459
150.16011.3490.090807
16-0.03473-0.29260.385326
17-0.073357-0.61810.269238
18-0.243471-2.05150.021953
190.1019760.85930.196543
20-0.018281-0.1540.43901
210.0006640.00560.497777
22-0.148679-1.25280.107197
230.2470432.08160.020492
240.0089860.07570.469928
250.0181520.1530.439434
26-0.189084-1.59320.057774
27-0.043703-0.36820.356893
280.0780810.65790.256357
290.0113780.09590.461945
300.0663540.55910.288923
310.104650.88180.190431
32-0.128729-1.08470.140864
33-0.018509-0.1560.438253
34-0.048822-0.41140.341016
350.098930.83360.203651
360.0348110.29330.385067
37-0.064272-0.54160.294907
38-0.01248-0.10520.458275
390.1060550.89360.187268
40-0.132521-1.11660.133956
41-0.063046-0.53120.298457
42-0.004952-0.04170.483416
430.0338340.28510.388202
440.0168710.14220.443678
450.0479290.40390.343767
46-0.078242-0.65930.255926
47-0.008796-0.07410.470563
480.0005020.00420.498319

\begin{tabular}{lllllllll}
\hline
Autocorrelation Function \tabularnewline
Time lag k & ACF(k) & T-STAT & P-value \tabularnewline
1 & -0.111525 & -0.9397 & 0.175272 \tabularnewline
2 & 0.011752 & 0.099 & 0.460698 \tabularnewline
3 & -0.198082 & -1.6691 & 0.049754 \tabularnewline
4 & 0.073296 & 0.6176 & 0.269406 \tabularnewline
5 & -0.098098 & -0.8266 & 0.205619 \tabularnewline
6 & 0.090428 & 0.762 & 0.224304 \tabularnewline
7 & -0.089947 & -0.7579 & 0.225508 \tabularnewline
8 & 0.113876 & 0.9595 & 0.170272 \tabularnewline
9 & -0.090124 & -0.7594 & 0.225063 \tabularnewline
10 & -0.024302 & -0.2048 & 0.419169 \tabularnewline
11 & 0.02184 & 0.184 & 0.427258 \tabularnewline
12 & 0.027288 & 0.2299 & 0.409402 \tabularnewline
13 & 0.019664 & 0.1657 & 0.434434 \tabularnewline
14 & -0.060989 & -0.5139 & 0.304459 \tabularnewline
15 & 0.1601 & 1.349 & 0.090807 \tabularnewline
16 & -0.03473 & -0.2926 & 0.385326 \tabularnewline
17 & -0.073357 & -0.6181 & 0.269238 \tabularnewline
18 & -0.243471 & -2.0515 & 0.021953 \tabularnewline
19 & 0.101976 & 0.8593 & 0.196543 \tabularnewline
20 & -0.018281 & -0.154 & 0.43901 \tabularnewline
21 & 0.000664 & 0.0056 & 0.497777 \tabularnewline
22 & -0.148679 & -1.2528 & 0.107197 \tabularnewline
23 & 0.247043 & 2.0816 & 0.020492 \tabularnewline
24 & 0.008986 & 0.0757 & 0.469928 \tabularnewline
25 & 0.018152 & 0.153 & 0.439434 \tabularnewline
26 & -0.189084 & -1.5932 & 0.057774 \tabularnewline
27 & -0.043703 & -0.3682 & 0.356893 \tabularnewline
28 & 0.078081 & 0.6579 & 0.256357 \tabularnewline
29 & 0.011378 & 0.0959 & 0.461945 \tabularnewline
30 & 0.066354 & 0.5591 & 0.288923 \tabularnewline
31 & 0.10465 & 0.8818 & 0.190431 \tabularnewline
32 & -0.128729 & -1.0847 & 0.140864 \tabularnewline
33 & -0.018509 & -0.156 & 0.438253 \tabularnewline
34 & -0.048822 & -0.4114 & 0.341016 \tabularnewline
35 & 0.09893 & 0.8336 & 0.203651 \tabularnewline
36 & 0.034811 & 0.2933 & 0.385067 \tabularnewline
37 & -0.064272 & -0.5416 & 0.294907 \tabularnewline
38 & -0.01248 & -0.1052 & 0.458275 \tabularnewline
39 & 0.106055 & 0.8936 & 0.187268 \tabularnewline
40 & -0.132521 & -1.1166 & 0.133956 \tabularnewline
41 & -0.063046 & -0.5312 & 0.298457 \tabularnewline
42 & -0.004952 & -0.0417 & 0.483416 \tabularnewline
43 & 0.033834 & 0.2851 & 0.388202 \tabularnewline
44 & 0.016871 & 0.1422 & 0.443678 \tabularnewline
45 & 0.047929 & 0.4039 & 0.343767 \tabularnewline
46 & -0.078242 & -0.6593 & 0.255926 \tabularnewline
47 & -0.008796 & -0.0741 & 0.470563 \tabularnewline
48 & 0.000502 & 0.0042 & 0.498319 \tabularnewline
\hline
\end{tabular}
%Source: https://freestatistics.org/blog/index.php?pk=79205&T=1

[TABLE]
[ROW][C]Autocorrelation Function[/C][/ROW]
[ROW][C]Time lag k[/C][C]ACF(k)[/C][C]T-STAT[/C][C]P-value[/C][/ROW]
[ROW][C]1[/C][C]-0.111525[/C][C]-0.9397[/C][C]0.175272[/C][/ROW]
[ROW][C]2[/C][C]0.011752[/C][C]0.099[/C][C]0.460698[/C][/ROW]
[ROW][C]3[/C][C]-0.198082[/C][C]-1.6691[/C][C]0.049754[/C][/ROW]
[ROW][C]4[/C][C]0.073296[/C][C]0.6176[/C][C]0.269406[/C][/ROW]
[ROW][C]5[/C][C]-0.098098[/C][C]-0.8266[/C][C]0.205619[/C][/ROW]
[ROW][C]6[/C][C]0.090428[/C][C]0.762[/C][C]0.224304[/C][/ROW]
[ROW][C]7[/C][C]-0.089947[/C][C]-0.7579[/C][C]0.225508[/C][/ROW]
[ROW][C]8[/C][C]0.113876[/C][C]0.9595[/C][C]0.170272[/C][/ROW]
[ROW][C]9[/C][C]-0.090124[/C][C]-0.7594[/C][C]0.225063[/C][/ROW]
[ROW][C]10[/C][C]-0.024302[/C][C]-0.2048[/C][C]0.419169[/C][/ROW]
[ROW][C]11[/C][C]0.02184[/C][C]0.184[/C][C]0.427258[/C][/ROW]
[ROW][C]12[/C][C]0.027288[/C][C]0.2299[/C][C]0.409402[/C][/ROW]
[ROW][C]13[/C][C]0.019664[/C][C]0.1657[/C][C]0.434434[/C][/ROW]
[ROW][C]14[/C][C]-0.060989[/C][C]-0.5139[/C][C]0.304459[/C][/ROW]
[ROW][C]15[/C][C]0.1601[/C][C]1.349[/C][C]0.090807[/C][/ROW]
[ROW][C]16[/C][C]-0.03473[/C][C]-0.2926[/C][C]0.385326[/C][/ROW]
[ROW][C]17[/C][C]-0.073357[/C][C]-0.6181[/C][C]0.269238[/C][/ROW]
[ROW][C]18[/C][C]-0.243471[/C][C]-2.0515[/C][C]0.021953[/C][/ROW]
[ROW][C]19[/C][C]0.101976[/C][C]0.8593[/C][C]0.196543[/C][/ROW]
[ROW][C]20[/C][C]-0.018281[/C][C]-0.154[/C][C]0.43901[/C][/ROW]
[ROW][C]21[/C][C]0.000664[/C][C]0.0056[/C][C]0.497777[/C][/ROW]
[ROW][C]22[/C][C]-0.148679[/C][C]-1.2528[/C][C]0.107197[/C][/ROW]
[ROW][C]23[/C][C]0.247043[/C][C]2.0816[/C][C]0.020492[/C][/ROW]
[ROW][C]24[/C][C]0.008986[/C][C]0.0757[/C][C]0.469928[/C][/ROW]
[ROW][C]25[/C][C]0.018152[/C][C]0.153[/C][C]0.439434[/C][/ROW]
[ROW][C]26[/C][C]-0.189084[/C][C]-1.5932[/C][C]0.057774[/C][/ROW]
[ROW][C]27[/C][C]-0.043703[/C][C]-0.3682[/C][C]0.356893[/C][/ROW]
[ROW][C]28[/C][C]0.078081[/C][C]0.6579[/C][C]0.256357[/C][/ROW]
[ROW][C]29[/C][C]0.011378[/C][C]0.0959[/C][C]0.461945[/C][/ROW]
[ROW][C]30[/C][C]0.066354[/C][C]0.5591[/C][C]0.288923[/C][/ROW]
[ROW][C]31[/C][C]0.10465[/C][C]0.8818[/C][C]0.190431[/C][/ROW]
[ROW][C]32[/C][C]-0.128729[/C][C]-1.0847[/C][C]0.140864[/C][/ROW]
[ROW][C]33[/C][C]-0.018509[/C][C]-0.156[/C][C]0.438253[/C][/ROW]
[ROW][C]34[/C][C]-0.048822[/C][C]-0.4114[/C][C]0.341016[/C][/ROW]
[ROW][C]35[/C][C]0.09893[/C][C]0.8336[/C][C]0.203651[/C][/ROW]
[ROW][C]36[/C][C]0.034811[/C][C]0.2933[/C][C]0.385067[/C][/ROW]
[ROW][C]37[/C][C]-0.064272[/C][C]-0.5416[/C][C]0.294907[/C][/ROW]
[ROW][C]38[/C][C]-0.01248[/C][C]-0.1052[/C][C]0.458275[/C][/ROW]
[ROW][C]39[/C][C]0.106055[/C][C]0.8936[/C][C]0.187268[/C][/ROW]
[ROW][C]40[/C][C]-0.132521[/C][C]-1.1166[/C][C]0.133956[/C][/ROW]
[ROW][C]41[/C][C]-0.063046[/C][C]-0.5312[/C][C]0.298457[/C][/ROW]
[ROW][C]42[/C][C]-0.004952[/C][C]-0.0417[/C][C]0.483416[/C][/ROW]
[ROW][C]43[/C][C]0.033834[/C][C]0.2851[/C][C]0.388202[/C][/ROW]
[ROW][C]44[/C][C]0.016871[/C][C]0.1422[/C][C]0.443678[/C][/ROW]
[ROW][C]45[/C][C]0.047929[/C][C]0.4039[/C][C]0.343767[/C][/ROW]
[ROW][C]46[/C][C]-0.078242[/C][C]-0.6593[/C][C]0.255926[/C][/ROW]
[ROW][C]47[/C][C]-0.008796[/C][C]-0.0741[/C][C]0.470563[/C][/ROW]
[ROW][C]48[/C][C]0.000502[/C][C]0.0042[/C][C]0.498319[/C][/ROW]
[/TABLE]
Source: https://freestatistics.org/blog/index.php?pk=79205&T=1

Globally Unique Identifier (entire table): ba.freestatistics.org/blog/index.php?pk=79205&T=1

As an alternative you can also use a QR Code:  

The GUIDs for individual cells are displayed in the table below:

Autocorrelation Function
Time lag kACF(k)T-STATP-value
1-0.111525-0.93970.175272
20.0117520.0990.460698
3-0.198082-1.66910.049754
40.0732960.61760.269406
5-0.098098-0.82660.205619
60.0904280.7620.224304
7-0.089947-0.75790.225508
80.1138760.95950.170272
9-0.090124-0.75940.225063
10-0.024302-0.20480.419169
110.021840.1840.427258
120.0272880.22990.409402
130.0196640.16570.434434
14-0.060989-0.51390.304459
150.16011.3490.090807
16-0.03473-0.29260.385326
17-0.073357-0.61810.269238
18-0.243471-2.05150.021953
190.1019760.85930.196543
20-0.018281-0.1540.43901
210.0006640.00560.497777
22-0.148679-1.25280.107197
230.2470432.08160.020492
240.0089860.07570.469928
250.0181520.1530.439434
26-0.189084-1.59320.057774
27-0.043703-0.36820.356893
280.0780810.65790.256357
290.0113780.09590.461945
300.0663540.55910.288923
310.104650.88180.190431
32-0.128729-1.08470.140864
33-0.018509-0.1560.438253
34-0.048822-0.41140.341016
350.098930.83360.203651
360.0348110.29330.385067
37-0.064272-0.54160.294907
38-0.01248-0.10520.458275
390.1060550.89360.187268
40-0.132521-1.11660.133956
41-0.063046-0.53120.298457
42-0.004952-0.04170.483416
430.0338340.28510.388202
440.0168710.14220.443678
450.0479290.40390.343767
46-0.078242-0.65930.255926
47-0.008796-0.07410.470563
480.0005020.00420.498319


Partial Autocorrelation Function
Time lag kPACF(k)T-STATP-value
1-0.111525-0.93970.175272
2-0.000694-0.00580.497675
3-0.199327-1.67960.04872
40.0307930.25950.398012
5-0.093966-0.79180.215566
60.0355580.29960.382672
7-0.065658-0.55320.290918
80.0685690.57780.282622
9-0.049461-0.41680.339054
10-0.076715-0.64640.260048
110.0615420.51860.302838
12-0.017733-0.14940.440821
130.036550.3080.3795
14-0.069423-0.5850.280211
150.1782021.50160.068823
16-0.01091-0.09190.463506
17-0.097991-0.82570.205874
18-0.203831-1.71750.045122
190.019410.16360.435273
20-0.010825-0.09120.46379
21-0.12314-1.03760.151489
22-0.116823-0.98440.164139
230.1840521.55090.062692
240.083950.70740.240823
25-0.03776-0.31820.375643
26-0.133302-1.12320.132564
27-0.140007-1.17970.121025
280.1179310.99370.161872
29-0.025592-0.21560.414942
300.0646870.54510.29371
310.1051630.88610.189273
32-0.091555-0.77150.221498
330.1104140.93040.177666
34-0.101946-0.8590.196613
350.0225090.18970.425058
36-0.042256-0.35610.361428
37-0.00781-0.06580.473858
38-0.025843-0.21780.414121
390.035660.30050.382346
40-0.121512-1.02390.154685
410.0118070.09950.460516
420.042630.35920.360253
43-0.138679-1.16850.123251
44-0.051246-0.43180.333596
450.0837210.70540.24142
46-0.077545-0.65340.257802
47-0.072096-0.60750.272731
480.0287110.24190.404767

\begin{tabular}{lllllllll}
\hline
Partial Autocorrelation Function \tabularnewline
Time lag k & PACF(k) & T-STAT & P-value \tabularnewline
1 & -0.111525 & -0.9397 & 0.175272 \tabularnewline
2 & -0.000694 & -0.0058 & 0.497675 \tabularnewline
3 & -0.199327 & -1.6796 & 0.04872 \tabularnewline
4 & 0.030793 & 0.2595 & 0.398012 \tabularnewline
5 & -0.093966 & -0.7918 & 0.215566 \tabularnewline
6 & 0.035558 & 0.2996 & 0.382672 \tabularnewline
7 & -0.065658 & -0.5532 & 0.290918 \tabularnewline
8 & 0.068569 & 0.5778 & 0.282622 \tabularnewline
9 & -0.049461 & -0.4168 & 0.339054 \tabularnewline
10 & -0.076715 & -0.6464 & 0.260048 \tabularnewline
11 & 0.061542 & 0.5186 & 0.302838 \tabularnewline
12 & -0.017733 & -0.1494 & 0.440821 \tabularnewline
13 & 0.03655 & 0.308 & 0.3795 \tabularnewline
14 & -0.069423 & -0.585 & 0.280211 \tabularnewline
15 & 0.178202 & 1.5016 & 0.068823 \tabularnewline
16 & -0.01091 & -0.0919 & 0.463506 \tabularnewline
17 & -0.097991 & -0.8257 & 0.205874 \tabularnewline
18 & -0.203831 & -1.7175 & 0.045122 \tabularnewline
19 & 0.01941 & 0.1636 & 0.435273 \tabularnewline
20 & -0.010825 & -0.0912 & 0.46379 \tabularnewline
21 & -0.12314 & -1.0376 & 0.151489 \tabularnewline
22 & -0.116823 & -0.9844 & 0.164139 \tabularnewline
23 & 0.184052 & 1.5509 & 0.062692 \tabularnewline
24 & 0.08395 & 0.7074 & 0.240823 \tabularnewline
25 & -0.03776 & -0.3182 & 0.375643 \tabularnewline
26 & -0.133302 & -1.1232 & 0.132564 \tabularnewline
27 & -0.140007 & -1.1797 & 0.121025 \tabularnewline
28 & 0.117931 & 0.9937 & 0.161872 \tabularnewline
29 & -0.025592 & -0.2156 & 0.414942 \tabularnewline
30 & 0.064687 & 0.5451 & 0.29371 \tabularnewline
31 & 0.105163 & 0.8861 & 0.189273 \tabularnewline
32 & -0.091555 & -0.7715 & 0.221498 \tabularnewline
33 & 0.110414 & 0.9304 & 0.177666 \tabularnewline
34 & -0.101946 & -0.859 & 0.196613 \tabularnewline
35 & 0.022509 & 0.1897 & 0.425058 \tabularnewline
36 & -0.042256 & -0.3561 & 0.361428 \tabularnewline
37 & -0.00781 & -0.0658 & 0.473858 \tabularnewline
38 & -0.025843 & -0.2178 & 0.414121 \tabularnewline
39 & 0.03566 & 0.3005 & 0.382346 \tabularnewline
40 & -0.121512 & -1.0239 & 0.154685 \tabularnewline
41 & 0.011807 & 0.0995 & 0.460516 \tabularnewline
42 & 0.04263 & 0.3592 & 0.360253 \tabularnewline
43 & -0.138679 & -1.1685 & 0.123251 \tabularnewline
44 & -0.051246 & -0.4318 & 0.333596 \tabularnewline
45 & 0.083721 & 0.7054 & 0.24142 \tabularnewline
46 & -0.077545 & -0.6534 & 0.257802 \tabularnewline
47 & -0.072096 & -0.6075 & 0.272731 \tabularnewline
48 & 0.028711 & 0.2419 & 0.404767 \tabularnewline
\hline
\end{tabular}
%Source: https://freestatistics.org/blog/index.php?pk=79205&T=2

[TABLE]
[ROW][C]Partial Autocorrelation Function[/C][/ROW]
[ROW][C]Time lag k[/C][C]PACF(k)[/C][C]T-STAT[/C][C]P-value[/C][/ROW]
[ROW][C]1[/C][C]-0.111525[/C][C]-0.9397[/C][C]0.175272[/C][/ROW]
[ROW][C]2[/C][C]-0.000694[/C][C]-0.0058[/C][C]0.497675[/C][/ROW]
[ROW][C]3[/C][C]-0.199327[/C][C]-1.6796[/C][C]0.04872[/C][/ROW]
[ROW][C]4[/C][C]0.030793[/C][C]0.2595[/C][C]0.398012[/C][/ROW]
[ROW][C]5[/C][C]-0.093966[/C][C]-0.7918[/C][C]0.215566[/C][/ROW]
[ROW][C]6[/C][C]0.035558[/C][C]0.2996[/C][C]0.382672[/C][/ROW]
[ROW][C]7[/C][C]-0.065658[/C][C]-0.5532[/C][C]0.290918[/C][/ROW]
[ROW][C]8[/C][C]0.068569[/C][C]0.5778[/C][C]0.282622[/C][/ROW]
[ROW][C]9[/C][C]-0.049461[/C][C]-0.4168[/C][C]0.339054[/C][/ROW]
[ROW][C]10[/C][C]-0.076715[/C][C]-0.6464[/C][C]0.260048[/C][/ROW]
[ROW][C]11[/C][C]0.061542[/C][C]0.5186[/C][C]0.302838[/C][/ROW]
[ROW][C]12[/C][C]-0.017733[/C][C]-0.1494[/C][C]0.440821[/C][/ROW]
[ROW][C]13[/C][C]0.03655[/C][C]0.308[/C][C]0.3795[/C][/ROW]
[ROW][C]14[/C][C]-0.069423[/C][C]-0.585[/C][C]0.280211[/C][/ROW]
[ROW][C]15[/C][C]0.178202[/C][C]1.5016[/C][C]0.068823[/C][/ROW]
[ROW][C]16[/C][C]-0.01091[/C][C]-0.0919[/C][C]0.463506[/C][/ROW]
[ROW][C]17[/C][C]-0.097991[/C][C]-0.8257[/C][C]0.205874[/C][/ROW]
[ROW][C]18[/C][C]-0.203831[/C][C]-1.7175[/C][C]0.045122[/C][/ROW]
[ROW][C]19[/C][C]0.01941[/C][C]0.1636[/C][C]0.435273[/C][/ROW]
[ROW][C]20[/C][C]-0.010825[/C][C]-0.0912[/C][C]0.46379[/C][/ROW]
[ROW][C]21[/C][C]-0.12314[/C][C]-1.0376[/C][C]0.151489[/C][/ROW]
[ROW][C]22[/C][C]-0.116823[/C][C]-0.9844[/C][C]0.164139[/C][/ROW]
[ROW][C]23[/C][C]0.184052[/C][C]1.5509[/C][C]0.062692[/C][/ROW]
[ROW][C]24[/C][C]0.08395[/C][C]0.7074[/C][C]0.240823[/C][/ROW]
[ROW][C]25[/C][C]-0.03776[/C][C]-0.3182[/C][C]0.375643[/C][/ROW]
[ROW][C]26[/C][C]-0.133302[/C][C]-1.1232[/C][C]0.132564[/C][/ROW]
[ROW][C]27[/C][C]-0.140007[/C][C]-1.1797[/C][C]0.121025[/C][/ROW]
[ROW][C]28[/C][C]0.117931[/C][C]0.9937[/C][C]0.161872[/C][/ROW]
[ROW][C]29[/C][C]-0.025592[/C][C]-0.2156[/C][C]0.414942[/C][/ROW]
[ROW][C]30[/C][C]0.064687[/C][C]0.5451[/C][C]0.29371[/C][/ROW]
[ROW][C]31[/C][C]0.105163[/C][C]0.8861[/C][C]0.189273[/C][/ROW]
[ROW][C]32[/C][C]-0.091555[/C][C]-0.7715[/C][C]0.221498[/C][/ROW]
[ROW][C]33[/C][C]0.110414[/C][C]0.9304[/C][C]0.177666[/C][/ROW]
[ROW][C]34[/C][C]-0.101946[/C][C]-0.859[/C][C]0.196613[/C][/ROW]
[ROW][C]35[/C][C]0.022509[/C][C]0.1897[/C][C]0.425058[/C][/ROW]
[ROW][C]36[/C][C]-0.042256[/C][C]-0.3561[/C][C]0.361428[/C][/ROW]
[ROW][C]37[/C][C]-0.00781[/C][C]-0.0658[/C][C]0.473858[/C][/ROW]
[ROW][C]38[/C][C]-0.025843[/C][C]-0.2178[/C][C]0.414121[/C][/ROW]
[ROW][C]39[/C][C]0.03566[/C][C]0.3005[/C][C]0.382346[/C][/ROW]
[ROW][C]40[/C][C]-0.121512[/C][C]-1.0239[/C][C]0.154685[/C][/ROW]
[ROW][C]41[/C][C]0.011807[/C][C]0.0995[/C][C]0.460516[/C][/ROW]
[ROW][C]42[/C][C]0.04263[/C][C]0.3592[/C][C]0.360253[/C][/ROW]
[ROW][C]43[/C][C]-0.138679[/C][C]-1.1685[/C][C]0.123251[/C][/ROW]
[ROW][C]44[/C][C]-0.051246[/C][C]-0.4318[/C][C]0.333596[/C][/ROW]
[ROW][C]45[/C][C]0.083721[/C][C]0.7054[/C][C]0.24142[/C][/ROW]
[ROW][C]46[/C][C]-0.077545[/C][C]-0.6534[/C][C]0.257802[/C][/ROW]
[ROW][C]47[/C][C]-0.072096[/C][C]-0.6075[/C][C]0.272731[/C][/ROW]
[ROW][C]48[/C][C]0.028711[/C][C]0.2419[/C][C]0.404767[/C][/ROW]
[/TABLE]
Source: https://freestatistics.org/blog/index.php?pk=79205&T=2

Globally Unique Identifier (entire table): ba.freestatistics.org/blog/index.php?pk=79205&T=2

As an alternative you can also use a QR Code:  

The GUIDs for individual cells are displayed in the table below:

Partial Autocorrelation Function
Time lag kPACF(k)T-STATP-value
1-0.111525-0.93970.175272
2-0.000694-0.00580.497675
3-0.199327-1.67960.04872
40.0307930.25950.398012
5-0.093966-0.79180.215566
60.0355580.29960.382672
7-0.065658-0.55320.290918
80.0685690.57780.282622
9-0.049461-0.41680.339054
10-0.076715-0.64640.260048
110.0615420.51860.302838
12-0.017733-0.14940.440821
130.036550.3080.3795
14-0.069423-0.5850.280211
150.1782021.50160.068823
16-0.01091-0.09190.463506
17-0.097991-0.82570.205874
18-0.203831-1.71750.045122
190.019410.16360.435273
20-0.010825-0.09120.46379
21-0.12314-1.03760.151489
22-0.116823-0.98440.164139
230.1840521.55090.062692
240.083950.70740.240823
25-0.03776-0.31820.375643
26-0.133302-1.12320.132564
27-0.140007-1.17970.121025
280.1179310.99370.161872
29-0.025592-0.21560.414942
300.0646870.54510.29371
310.1051630.88610.189273
32-0.091555-0.77150.221498
330.1104140.93040.177666
34-0.101946-0.8590.196613
350.0225090.18970.425058
36-0.042256-0.35610.361428
37-0.00781-0.06580.473858
38-0.025843-0.21780.414121
390.035660.30050.382346
40-0.121512-1.02390.154685
410.0118070.09950.460516
420.042630.35920.360253
43-0.138679-1.16850.123251
44-0.051246-0.43180.333596
450.0837210.70540.24142
46-0.077545-0.65340.257802
47-0.072096-0.60750.272731
480.0287110.24190.404767


Parameters (Session):
par1 = 48 ; par2 = 1 ; par3 = 1 ; par4 = 1 ; par5 = 12 ; par6 = White Noise ; par7 = 0.95 ;
Parameters (R input):
par1 = 48 ; par2 = 1 ; par3 = 1 ; par4 = 1 ; par5 = 12 ; par6 = White Noise ; par7 = 0.95 ;
R code (references can be found in the software module):
if (par1 == 'Default') {
par1 = 10*log10(length(x))
} else {
par1 <- as.numeric(par1)
}
par2 <- as.numeric(par2)
par3 <- as.numeric(par3)
par4 <- as.numeric(par4)
par5 <- as.numeric(par5)
if (par6 == 'White Noise') par6 <- 'white' else par6 <- 'ma'
par7 <- as.numeric(par7)
if (par2 == 0) {
x <- log(x)
} else {
x <- (x ^ par2 - 1) / par2
}
if (par3 > 0) x <- diff(x,lag=1,difference=par3)
if (par4 > 0) x <- diff(x,lag=par5,difference=par4)
bitmap(file='pic1.png')
racf <- acf(x, par1, main='Autocorrelation', xlab='time lag', ylab='ACF', ci.type=par6, ci=par7, sub=paste('(lambda=',par2,', d=',par3,', D=',par4,', CI=', par7, ', CI type=',par6,')',sep=''))
dev.off()
bitmap(file='pic2.png')
rpacf <- pacf(x,par1,main='Partial Autocorrelation',xlab='lags',ylab='PACF')
dev.off()
(myacf <- c(racf$acf))
(mypacf <- c(rpacf$acf))
lengthx <- length(x)
sqrtn <- sqrt(lengthx)
load(file='createtable')
a<-table.start()
a<-table.row.start(a)
a<-table.element(a,'Autocorrelation Function',4,TRUE)
a<-table.row.end(a)
a<-table.row.start(a)
a<-table.element(a,'Time lag k',header=TRUE)
a<-table.element(a,hyperlink('basics.htm','ACF(k)','click here for more information about the Autocorrelation Function'),header=TRUE)
a<-table.element(a,'T-STAT',header=TRUE)
a<-table.element(a,'P-value',header=TRUE)
a<-table.row.end(a)
for (i in 2:(par1+1)) {
a<-table.row.start(a)
a<-table.element(a,i-1,header=TRUE)
a<-table.element(a,round(myacf[i],6))
mytstat <- myacf[i]*sqrtn
a<-table.element(a,round(mytstat,4))
a<-table.element(a,round(1-pt(abs(mytstat),lengthx),6))
a<-table.row.end(a)
}
a<-table.end(a)
table.save(a,file='mytable.tab')
a<-table.start()
a<-table.row.start(a)
a<-table.element(a,'Partial Autocorrelation Function',4,TRUE)
a<-table.row.end(a)
a<-table.row.start(a)
a<-table.element(a,'Time lag k',header=TRUE)
a<-table.element(a,hyperlink('basics.htm','PACF(k)','click here for more information about the Partial Autocorrelation Function'),header=TRUE)
a<-table.element(a,'T-STAT',header=TRUE)
a<-table.element(a,'P-value',header=TRUE)
a<-table.row.end(a)
for (i in 1:par1) {
a<-table.row.start(a)
a<-table.element(a,i,header=TRUE)
a<-table.element(a,round(mypacf[i],6))
mytstat <- mypacf[i]*sqrtn
a<-table.element(a,round(mytstat,4))
a<-table.element(a,round(1-pt(abs(mytstat),lengthx),6))
a<-table.row.end(a)
}
a<-table.end(a)
table.save(a,file='mytable1.tab')