Free Statistics

of Irreproducible Research!

Author's title

Author*Unverified author*
R Software Modulerwasp_smp.wasp
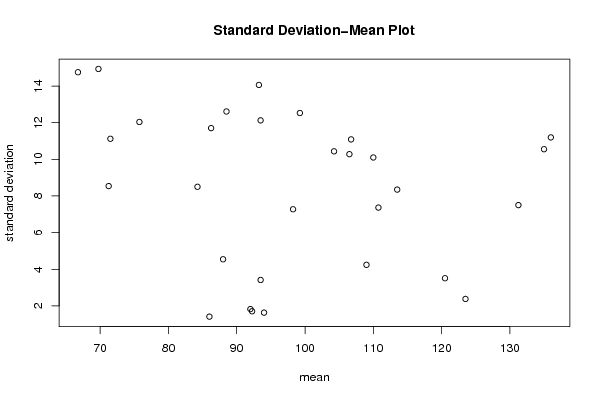
Title produced by softwareStandard Deviation-Mean Plot
Date of computationWed, 18 Aug 2010 00:53:46 +0000
Cite this page as followsStatistical Computations at FreeStatistics.org, Office for Research Development and Education, URL https://freestatistics.org/blog/index.php?v=date/2010/Aug/18/t1282092810hrbtaowj6xnh6qm.htm/, Retrieved Thu, 16 May 2024 08:07:41 +0000
Statistical Computations at FreeStatistics.org, Office for Research Development and Education, URL https://freestatistics.org/blog/index.php?pk=79174, Retrieved Thu, 16 May 2024 08:07:41 +0000
QR Codes:

Original text written by user:
IsPrivate?No (this computation is public)
User-defined keywords
Estimated Impact168
Family? (F = Feedback message, R = changed R code, M = changed R Module, P = changed Parameters, D = changed Data)
-     [Standard Deviation Plot] [] [2010-08-18 00:34:42] [0054c34847e75ef4340aed26951eb951]
- RMP     [Standard Deviation-Mean Plot] [] [2010-08-18 00:53:46] [ea4db07d8da34007b79212461ea6aa7b] [Current]
- RMPD      [Standard Deviation Plot] [] [2010-08-18 00:59:42] [0054c34847e75ef4340aed26951eb951]
-   PD      [Standard Deviation-Mean Plot] [] [2010-08-18 01:02:11] [0054c34847e75ef4340aed26951eb951]
Feedback Forum

Post a new message
Dataseries X:
94
93
92
90
110
109
94
84
85
85
86
88
93
94
90
91
104
103
88
79
82
88
93
89
94
96
94
92
113
122
107
98
103
110
113
110
123
124
118
117
139
146
134
121
123
122
127
122
139
136
127
123
140
146
138
120
122
115
115
102
119
114
108
102
121
109
102
95
98
92
94
90
113
111
103
90
108
99
95
91
85
72
90
90
114
115
104
93
101
90
79
75
71
61
84
87
107
99
93
74
87
71
67
61
63
52
80
84
102
93
87
72
83
72
66
64
64
47
77
79


Summary of computational transaction
Raw Inputview raw input (R code)
Raw Outputview raw output of R engine
Computing time1 seconds
R Server'Gwilym Jenkins' @ 72.249.127.135

\begin{tabular}{lllllllll}
\hline
Summary of computational transaction \tabularnewline
Raw Input & view raw input (R code)  \tabularnewline
Raw Output & view raw output of R engine  \tabularnewline
Computing time & 1 seconds \tabularnewline
R Server & 'Gwilym Jenkins' @ 72.249.127.135 \tabularnewline
\hline
\end{tabular}
%Source: https://freestatistics.org/blog/index.php?pk=79174&T=0

[TABLE]
[ROW][C]Summary of computational transaction[/C][/ROW]
[ROW][C]Raw Input[/C][C]view raw input (R code) [/C][/ROW]
[ROW][C]Raw Output[/C][C]view raw output of R engine [/C][/ROW]
[ROW][C]Computing time[/C][C]1 seconds[/C][/ROW]
[ROW][C]R Server[/C][C]'Gwilym Jenkins' @ 72.249.127.135[/C][/ROW]
[/TABLE]
Source: https://freestatistics.org/blog/index.php?pk=79174&T=0

Globally Unique Identifier (entire table): ba.freestatistics.org/blog/index.php?pk=79174&T=0

As an alternative you can also use a QR Code:  

The GUIDs for individual cells are displayed in the table below:

Summary of computational transaction
Raw Inputview raw input (R code)
Raw Outputview raw output of R engine
Computing time1 seconds
R Server'Gwilym Jenkins' @ 72.249.127.135


Standard Deviation-Mean Plot
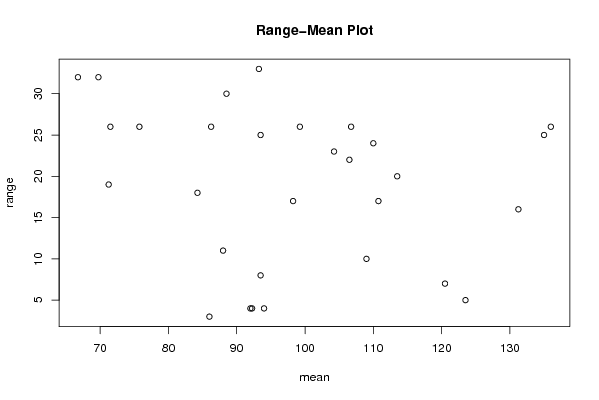
SectionMeanStandard DeviationRange
192.251.707825127659934
299.2512.526638282742426
3861.414213562373103
4921.825741858350554
593.512.124355652982125
6884.5460605656619511
7941.632993161855454
811010.099504938362124
91094.2426406871192810
10120.53.511884584284257
1113510.551461194229625
12123.52.380476142847625
13131.257.516
1413611.195237082497826
15113.58.3466560170326120
16110.757.3654599313281217
17106.7511.086778913041726
1893.53.415650255319878
19104.2510.436314802968823
2098.257.2743842809317317
2184.258.518
22106.510.279429296739522
2386.2511.701139545645426
2475.7512.038133853162926
2593.2514.056433876817233
2671.511.120551545074926
2769.7514.930394055974132
2888.512.609520212918530
2971.258.5391256382996719
3066.7514.750706197783732

\begin{tabular}{lllllllll}
\hline
Standard Deviation-Mean Plot \tabularnewline
Section & Mean & Standard Deviation & Range \tabularnewline
1 & 92.25 & 1.70782512765993 & 4 \tabularnewline
2 & 99.25 & 12.5266382827424 & 26 \tabularnewline
3 & 86 & 1.41421356237310 & 3 \tabularnewline
4 & 92 & 1.82574185835055 & 4 \tabularnewline
5 & 93.5 & 12.1243556529821 & 25 \tabularnewline
6 & 88 & 4.54606056566195 & 11 \tabularnewline
7 & 94 & 1.63299316185545 & 4 \tabularnewline
8 & 110 & 10.0995049383621 & 24 \tabularnewline
9 & 109 & 4.24264068711928 & 10 \tabularnewline
10 & 120.5 & 3.51188458428425 & 7 \tabularnewline
11 & 135 & 10.5514611942296 & 25 \tabularnewline
12 & 123.5 & 2.38047614284762 & 5 \tabularnewline
13 & 131.25 & 7.5 & 16 \tabularnewline
14 & 136 & 11.1952370824978 & 26 \tabularnewline
15 & 113.5 & 8.34665601703261 & 20 \tabularnewline
16 & 110.75 & 7.36545993132812 & 17 \tabularnewline
17 & 106.75 & 11.0867789130417 & 26 \tabularnewline
18 & 93.5 & 3.41565025531987 & 8 \tabularnewline
19 & 104.25 & 10.4363148029688 & 23 \tabularnewline
20 & 98.25 & 7.27438428093173 & 17 \tabularnewline
21 & 84.25 & 8.5 & 18 \tabularnewline
22 & 106.5 & 10.2794292967395 & 22 \tabularnewline
23 & 86.25 & 11.7011395456454 & 26 \tabularnewline
24 & 75.75 & 12.0381338531629 & 26 \tabularnewline
25 & 93.25 & 14.0564338768172 & 33 \tabularnewline
26 & 71.5 & 11.1205515450749 & 26 \tabularnewline
27 & 69.75 & 14.9303940559741 & 32 \tabularnewline
28 & 88.5 & 12.6095202129185 & 30 \tabularnewline
29 & 71.25 & 8.53912563829967 & 19 \tabularnewline
30 & 66.75 & 14.7507061977837 & 32 \tabularnewline
\hline
\end{tabular}
%Source: https://freestatistics.org/blog/index.php?pk=79174&T=1

[TABLE]
[ROW][C]Standard Deviation-Mean Plot[/C][/ROW]
[ROW][C]Section[/C][C]Mean[/C][C]Standard Deviation[/C][C]Range[/C][/ROW]
[ROW][C]1[/C][C]92.25[/C][C]1.70782512765993[/C][C]4[/C][/ROW]
[ROW][C]2[/C][C]99.25[/C][C]12.5266382827424[/C][C]26[/C][/ROW]
[ROW][C]3[/C][C]86[/C][C]1.41421356237310[/C][C]3[/C][/ROW]
[ROW][C]4[/C][C]92[/C][C]1.82574185835055[/C][C]4[/C][/ROW]
[ROW][C]5[/C][C]93.5[/C][C]12.1243556529821[/C][C]25[/C][/ROW]
[ROW][C]6[/C][C]88[/C][C]4.54606056566195[/C][C]11[/C][/ROW]
[ROW][C]7[/C][C]94[/C][C]1.63299316185545[/C][C]4[/C][/ROW]
[ROW][C]8[/C][C]110[/C][C]10.0995049383621[/C][C]24[/C][/ROW]
[ROW][C]9[/C][C]109[/C][C]4.24264068711928[/C][C]10[/C][/ROW]
[ROW][C]10[/C][C]120.5[/C][C]3.51188458428425[/C][C]7[/C][/ROW]
[ROW][C]11[/C][C]135[/C][C]10.5514611942296[/C][C]25[/C][/ROW]
[ROW][C]12[/C][C]123.5[/C][C]2.38047614284762[/C][C]5[/C][/ROW]
[ROW][C]13[/C][C]131.25[/C][C]7.5[/C][C]16[/C][/ROW]
[ROW][C]14[/C][C]136[/C][C]11.1952370824978[/C][C]26[/C][/ROW]
[ROW][C]15[/C][C]113.5[/C][C]8.34665601703261[/C][C]20[/C][/ROW]
[ROW][C]16[/C][C]110.75[/C][C]7.36545993132812[/C][C]17[/C][/ROW]
[ROW][C]17[/C][C]106.75[/C][C]11.0867789130417[/C][C]26[/C][/ROW]
[ROW][C]18[/C][C]93.5[/C][C]3.41565025531987[/C][C]8[/C][/ROW]
[ROW][C]19[/C][C]104.25[/C][C]10.4363148029688[/C][C]23[/C][/ROW]
[ROW][C]20[/C][C]98.25[/C][C]7.27438428093173[/C][C]17[/C][/ROW]
[ROW][C]21[/C][C]84.25[/C][C]8.5[/C][C]18[/C][/ROW]
[ROW][C]22[/C][C]106.5[/C][C]10.2794292967395[/C][C]22[/C][/ROW]
[ROW][C]23[/C][C]86.25[/C][C]11.7011395456454[/C][C]26[/C][/ROW]
[ROW][C]24[/C][C]75.75[/C][C]12.0381338531629[/C][C]26[/C][/ROW]
[ROW][C]25[/C][C]93.25[/C][C]14.0564338768172[/C][C]33[/C][/ROW]
[ROW][C]26[/C][C]71.5[/C][C]11.1205515450749[/C][C]26[/C][/ROW]
[ROW][C]27[/C][C]69.75[/C][C]14.9303940559741[/C][C]32[/C][/ROW]
[ROW][C]28[/C][C]88.5[/C][C]12.6095202129185[/C][C]30[/C][/ROW]
[ROW][C]29[/C][C]71.25[/C][C]8.53912563829967[/C][C]19[/C][/ROW]
[ROW][C]30[/C][C]66.75[/C][C]14.7507061977837[/C][C]32[/C][/ROW]
[/TABLE]
Source: https://freestatistics.org/blog/index.php?pk=79174&T=1

Globally Unique Identifier (entire table): ba.freestatistics.org/blog/index.php?pk=79174&T=1

As an alternative you can also use a QR Code:  

The GUIDs for individual cells are displayed in the table below:

Standard Deviation-Mean Plot
SectionMeanStandard DeviationRange
192.251.707825127659934
299.2512.526638282742426
3861.414213562373103
4921.825741858350554
593.512.124355652982125
6884.5460605656619511
7941.632993161855454
811010.099504938362124
91094.2426406871192810
10120.53.511884584284257
1113510.551461194229625
12123.52.380476142847625
13131.257.516
1413611.195237082497826
15113.58.3466560170326120
16110.757.3654599313281217
17106.7511.086778913041726
1893.53.415650255319878
19104.2510.436314802968823
2098.257.2743842809317317
2184.258.518
22106.510.279429296739522
2386.2511.701139545645426
2475.7512.038133853162926
2593.2514.056433876817233
2671.511.120551545074926
2769.7514.930394055974132
2888.512.609520212918530
2971.258.5391256382996719
3066.7514.750706197783732


Regression: S.E.(k) = alpha + beta * Mean(k)
alpha13.1404442873218
beta-0.0482899414963233
S.D.0.0415490211757219
T-STAT-1.16224017148544
p-value0.254949001968249

\begin{tabular}{lllllllll}
\hline
Regression: S.E.(k) = alpha + beta * Mean(k) \tabularnewline
alpha & 13.1404442873218 \tabularnewline
beta & -0.0482899414963233 \tabularnewline
S.D. & 0.0415490211757219 \tabularnewline
T-STAT & -1.16224017148544 \tabularnewline
p-value & 0.254949001968249 \tabularnewline
\hline
\end{tabular}
%Source: https://freestatistics.org/blog/index.php?pk=79174&T=2

[TABLE]
[ROW][C]Regression: S.E.(k) = alpha + beta * Mean(k)[/C][/ROW]
[ROW][C]alpha[/C][C]13.1404442873218[/C][/ROW]
[ROW][C]beta[/C][C]-0.0482899414963233[/C][/ROW]
[ROW][C]S.D.[/C][C]0.0415490211757219[/C][/ROW]
[ROW][C]T-STAT[/C][C]-1.16224017148544[/C][/ROW]
[ROW][C]p-value[/C][C]0.254949001968249[/C][/ROW]
[/TABLE]
Source: https://freestatistics.org/blog/index.php?pk=79174&T=2

Globally Unique Identifier (entire table): ba.freestatistics.org/blog/index.php?pk=79174&T=2

As an alternative you can also use a QR Code:  

The GUIDs for individual cells are displayed in the table below:

Regression: S.E.(k) = alpha + beta * Mean(k)
alpha13.1404442873218
beta-0.0482899414963233
S.D.0.0415490211757219
T-STAT-1.16224017148544
p-value0.254949001968249


Regression: ln S.E.(k) = alpha + beta * ln Mean(k)
alpha4.26879912544983
beta-0.512387006672243
S.D.0.708123831830356
T-STAT-0.72358390388843
p-value0.475323357359544
Lambda1.51238700667224

\begin{tabular}{lllllllll}
\hline
Regression: ln S.E.(k) = alpha + beta * ln Mean(k) \tabularnewline
alpha & 4.26879912544983 \tabularnewline
beta & -0.512387006672243 \tabularnewline
S.D. & 0.708123831830356 \tabularnewline
T-STAT & -0.72358390388843 \tabularnewline
p-value & 0.475323357359544 \tabularnewline
Lambda & 1.51238700667224 \tabularnewline
\hline
\end{tabular}
%Source: https://freestatistics.org/blog/index.php?pk=79174&T=3

[TABLE]
[ROW][C]Regression: ln S.E.(k) = alpha + beta * ln Mean(k)[/C][/ROW]
[ROW][C]alpha[/C][C]4.26879912544983[/C][/ROW]
[ROW][C]beta[/C][C]-0.512387006672243[/C][/ROW]
[ROW][C]S.D.[/C][C]0.708123831830356[/C][/ROW]
[ROW][C]T-STAT[/C][C]-0.72358390388843[/C][/ROW]
[ROW][C]p-value[/C][C]0.475323357359544[/C][/ROW]
[ROW][C]Lambda[/C][C]1.51238700667224[/C][/ROW]
[/TABLE]
Source: https://freestatistics.org/blog/index.php?pk=79174&T=3

Globally Unique Identifier (entire table): ba.freestatistics.org/blog/index.php?pk=79174&T=3

As an alternative you can also use a QR Code:  

The GUIDs for individual cells are displayed in the table below:

Regression: ln S.E.(k) = alpha + beta * ln Mean(k)
alpha4.26879912544983
beta-0.512387006672243
S.D.0.708123831830356
T-STAT-0.72358390388843
p-value0.475323357359544
Lambda1.51238700667224


Parameters (Session):
par1 = 4 ;
Parameters (R input):
par1 = 4 ;
R code (references can be found in the software module):
par1 <- as.numeric(par1)
(n <- length(x))
(np <- floor(n / par1))
arr <- array(NA,dim=c(par1,np))
j <- 0
k <- 1
for (i in 1:(np*par1))
{
j = j + 1
arr[j,k] <- x[i]
if (j == par1) {
j = 0
k=k+1
}
}
arr
arr.mean <- array(NA,dim=np)
arr.sd <- array(NA,dim=np)
arr.range <- array(NA,dim=np)
for (j in 1:np)
{
arr.mean[j] <- mean(arr[,j],na.rm=TRUE)
arr.sd[j] <- sd(arr[,j],na.rm=TRUE)
arr.range[j] <- max(arr[,j],na.rm=TRUE) - min(arr[,j],na.rm=TRUE)
}
arr.mean
arr.sd
arr.range
(lm1 <- lm(arr.sd~arr.mean))
(lnlm1 <- lm(log(arr.sd)~log(arr.mean)))
(lm2 <- lm(arr.range~arr.mean))
bitmap(file='test1.png')
plot(arr.mean,arr.sd,main='Standard Deviation-Mean Plot',xlab='mean',ylab='standard deviation')
dev.off()
bitmap(file='test2.png')
plot(arr.mean,arr.range,main='Range-Mean Plot',xlab='mean',ylab='range')
dev.off()
load(file='createtable')
a<-table.start()
a<-table.row.start(a)
a<-table.element(a,'Standard Deviation-Mean Plot',4,TRUE)
a<-table.row.end(a)
a<-table.row.start(a)
a<-table.element(a,'Section',header=TRUE)
a<-table.element(a,'Mean',header=TRUE)
a<-table.element(a,'Standard Deviation',header=TRUE)
a<-table.element(a,'Range',header=TRUE)
a<-table.row.end(a)
for (j in 1:np) {
a<-table.row.start(a)
a<-table.element(a,j,header=TRUE)
a<-table.element(a,arr.mean[j])
a<-table.element(a,arr.sd[j] )
a<-table.element(a,arr.range[j] )
a<-table.row.end(a)
}
a<-table.end(a)
table.save(a,file='mytable.tab')
a<-table.start()
a<-table.row.start(a)
a<-table.element(a,'Regression: S.E.(k) = alpha + beta * Mean(k)',2,TRUE)
a<-table.row.end(a)
a<-table.row.start(a)
a<-table.element(a,'alpha',header=TRUE)
a<-table.element(a,lm1$coefficients[[1]])
a<-table.row.end(a)
a<-table.row.start(a)
a<-table.element(a,'beta',header=TRUE)
a<-table.element(a,lm1$coefficients[[2]])
a<-table.row.end(a)
a<-table.row.start(a)
a<-table.element(a,'S.D.',header=TRUE)
a<-table.element(a,summary(lm1)$coefficients[2,2])
a<-table.row.end(a)
a<-table.row.start(a)
a<-table.element(a,'T-STAT',header=TRUE)
a<-table.element(a,summary(lm1)$coefficients[2,3])
a<-table.row.end(a)
a<-table.row.start(a)
a<-table.element(a,'p-value',header=TRUE)
a<-table.element(a,summary(lm1)$coefficients[2,4])
a<-table.row.end(a)
a<-table.end(a)
table.save(a,file='mytable1.tab')
a<-table.start()
a<-table.row.start(a)
a<-table.element(a,'Regression: ln S.E.(k) = alpha + beta * ln Mean(k)',2,TRUE)
a<-table.row.end(a)
a<-table.row.start(a)
a<-table.element(a,'alpha',header=TRUE)
a<-table.element(a,lnlm1$coefficients[[1]])
a<-table.row.end(a)
a<-table.row.start(a)
a<-table.element(a,'beta',header=TRUE)
a<-table.element(a,lnlm1$coefficients[[2]])
a<-table.row.end(a)
a<-table.row.start(a)
a<-table.element(a,'S.D.',header=TRUE)
a<-table.element(a,summary(lnlm1)$coefficients[2,2])
a<-table.row.end(a)
a<-table.row.start(a)
a<-table.element(a,'T-STAT',header=TRUE)
a<-table.element(a,summary(lnlm1)$coefficients[2,3])
a<-table.row.end(a)
a<-table.row.start(a)
a<-table.element(a,'p-value',header=TRUE)
a<-table.element(a,summary(lnlm1)$coefficients[2,4])
a<-table.row.end(a)
a<-table.row.start(a)
a<-table.element(a,'Lambda',header=TRUE)
a<-table.element(a,1-lnlm1$coefficients[[2]])
a<-table.row.end(a)
a<-table.end(a)
table.save(a,file='mytable2.tab')