Free Statistics

of Irreproducible Research!

Author's title

Author*Unverified author*
R Software Modulerwasp_autocorrelation.wasp
Title produced by software(Partial) Autocorrelation Function
Date of computationWed, 18 Aug 2010 00:15:20 +0000
Cite this page as followsStatistical Computations at FreeStatistics.org, Office for Research Development and Education, URL https://freestatistics.org/blog/index.php?v=date/2010/Aug/18/t1282090628ylj1hr197v9kyhe.htm/, Retrieved Thu, 16 May 2024 04:08:37 +0000
Statistical Computations at FreeStatistics.org, Office for Research Development and Education, URL https://freestatistics.org/blog/index.php?pk=79169, Retrieved Thu, 16 May 2024 04:08:37 +0000
QR Codes:

Original text written by user:
IsPrivate?No (this computation is public)
User-defined keywords
Estimated Impact150
Family? (F = Feedback message, R = changed R code, M = changed R Module, P = changed Parameters, D = changed Data)
-       [(Partial) Autocorrelation Function] [] [2010-08-18 00:15:20] [ea4db07d8da34007b79212461ea6aa7b] [Current]
Feedback Forum

Post a new message
Dataseries X:
158
157
156
154
152
151
152
154
155
155
156
158
155
151
152
156
147
159
152
148
146
148
142
141
139
143
146
150
141
153
142
139
134
152
142
139
137
132
137
134
127
140
127
120
112
128
119
117
115
104
108
104
98
111
104
98
91
94
82
81
70
64
71
73
71
80
72
68
60
71
62
69
55
58
67
69
71
85
76
79
69
95
94
99


Summary of computational transaction
Raw Inputview raw input (R code)
Raw Outputview raw output of R engine
Computing time1 seconds
R Server'Gwilym Jenkins' @ 72.249.127.135

\begin{tabular}{lllllllll}
\hline
Summary of computational transaction \tabularnewline
Raw Input & view raw input (R code)  \tabularnewline
Raw Output & view raw output of R engine  \tabularnewline
Computing time & 1 seconds \tabularnewline
R Server & 'Gwilym Jenkins' @ 72.249.127.135 \tabularnewline
\hline
\end{tabular}
%Source: https://freestatistics.org/blog/index.php?pk=79169&T=0

[TABLE]
[ROW][C]Summary of computational transaction[/C][/ROW]
[ROW][C]Raw Input[/C][C]view raw input (R code) [/C][/ROW]
[ROW][C]Raw Output[/C][C]view raw output of R engine [/C][/ROW]
[ROW][C]Computing time[/C][C]1 seconds[/C][/ROW]
[ROW][C]R Server[/C][C]'Gwilym Jenkins' @ 72.249.127.135[/C][/ROW]
[/TABLE]
Source: https://freestatistics.org/blog/index.php?pk=79169&T=0

Globally Unique Identifier (entire table): ba.freestatistics.org/blog/index.php?pk=79169&T=0

As an alternative you can also use a QR Code:  

The GUIDs for individual cells are displayed in the table below:

Summary of computational transaction
Raw Inputview raw input (R code)
Raw Outputview raw output of R engine
Computing time1 seconds
R Server'Gwilym Jenkins' @ 72.249.127.135


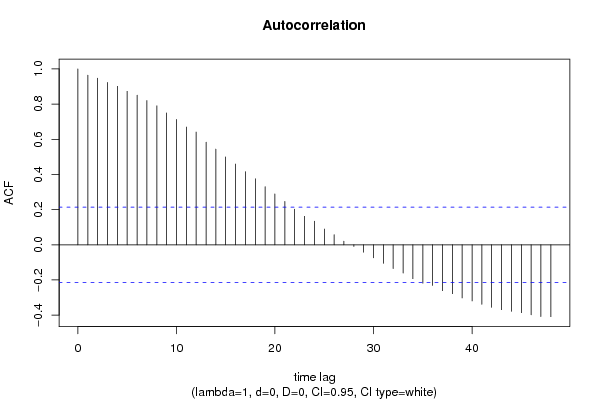
Autocorrelation Function
Time lag kACF(k)T-STATP-value
10.964218.83710
20.9477718.68650
30.9233738.46290
40.9013488.2610
50.8728247.99960
60.8507127.79690
70.8203267.51840
80.7903977.24410
90.7494996.86930
100.7126566.53160
110.669686.13770
120.6411125.87590
130.5836615.34930
140.5439824.98572e-06
150.4997434.58028e-06
160.45884.2053.2e-05
170.4158363.81120.000131
180.374923.43620.00046
190.3303033.02730.001638
200.289252.6510.004795
210.2466382.26050.013189
220.2025681.85660.033439
230.1621471.48610.070498
240.1341791.22980.111108
250.089050.81620.208359
260.0571130.52340.301021
270.0202090.18520.426752
28-0.009555-0.08760.465211
29-0.042174-0.38650.35004
30-0.07401-0.67830.249718
31-0.10574-0.96910.167634
32-0.135106-1.23830.109534
33-0.160828-1.4740.072108
34-0.192846-1.76750.040391
35-0.218835-2.00570.024056
36-0.231637-2.1230.018349
37-0.261357-2.39540.009413
38-0.278326-2.55090.006279
39-0.302615-2.77350.003415
40-0.319375-2.92710.0022
41-0.338422-3.10170.00131
42-0.355611-3.25920.000807
43-0.369492-3.38650.00054
44-0.37852-3.46920.000413
45-0.38627-3.54020.000327
46-0.398583-3.65310.000225
47-0.408187-3.74110.000167
48-0.408857-3.74720.000164

\begin{tabular}{lllllllll}
\hline
Autocorrelation Function \tabularnewline
Time lag k & ACF(k) & T-STAT & P-value \tabularnewline
1 & 0.96421 & 8.8371 & 0 \tabularnewline
2 & 0.947771 & 8.6865 & 0 \tabularnewline
3 & 0.923373 & 8.4629 & 0 \tabularnewline
4 & 0.901348 & 8.261 & 0 \tabularnewline
5 & 0.872824 & 7.9996 & 0 \tabularnewline
6 & 0.850712 & 7.7969 & 0 \tabularnewline
7 & 0.820326 & 7.5184 & 0 \tabularnewline
8 & 0.790397 & 7.2441 & 0 \tabularnewline
9 & 0.749499 & 6.8693 & 0 \tabularnewline
10 & 0.712656 & 6.5316 & 0 \tabularnewline
11 & 0.66968 & 6.1377 & 0 \tabularnewline
12 & 0.641112 & 5.8759 & 0 \tabularnewline
13 & 0.583661 & 5.3493 & 0 \tabularnewline
14 & 0.543982 & 4.9857 & 2e-06 \tabularnewline
15 & 0.499743 & 4.5802 & 8e-06 \tabularnewline
16 & 0.4588 & 4.205 & 3.2e-05 \tabularnewline
17 & 0.415836 & 3.8112 & 0.000131 \tabularnewline
18 & 0.37492 & 3.4362 & 0.00046 \tabularnewline
19 & 0.330303 & 3.0273 & 0.001638 \tabularnewline
20 & 0.28925 & 2.651 & 0.004795 \tabularnewline
21 & 0.246638 & 2.2605 & 0.013189 \tabularnewline
22 & 0.202568 & 1.8566 & 0.033439 \tabularnewline
23 & 0.162147 & 1.4861 & 0.070498 \tabularnewline
24 & 0.134179 & 1.2298 & 0.111108 \tabularnewline
25 & 0.08905 & 0.8162 & 0.208359 \tabularnewline
26 & 0.057113 & 0.5234 & 0.301021 \tabularnewline
27 & 0.020209 & 0.1852 & 0.426752 \tabularnewline
28 & -0.009555 & -0.0876 & 0.465211 \tabularnewline
29 & -0.042174 & -0.3865 & 0.35004 \tabularnewline
30 & -0.07401 & -0.6783 & 0.249718 \tabularnewline
31 & -0.10574 & -0.9691 & 0.167634 \tabularnewline
32 & -0.135106 & -1.2383 & 0.109534 \tabularnewline
33 & -0.160828 & -1.474 & 0.072108 \tabularnewline
34 & -0.192846 & -1.7675 & 0.040391 \tabularnewline
35 & -0.218835 & -2.0057 & 0.024056 \tabularnewline
36 & -0.231637 & -2.123 & 0.018349 \tabularnewline
37 & -0.261357 & -2.3954 & 0.009413 \tabularnewline
38 & -0.278326 & -2.5509 & 0.006279 \tabularnewline
39 & -0.302615 & -2.7735 & 0.003415 \tabularnewline
40 & -0.319375 & -2.9271 & 0.0022 \tabularnewline
41 & -0.338422 & -3.1017 & 0.00131 \tabularnewline
42 & -0.355611 & -3.2592 & 0.000807 \tabularnewline
43 & -0.369492 & -3.3865 & 0.00054 \tabularnewline
44 & -0.37852 & -3.4692 & 0.000413 \tabularnewline
45 & -0.38627 & -3.5402 & 0.000327 \tabularnewline
46 & -0.398583 & -3.6531 & 0.000225 \tabularnewline
47 & -0.408187 & -3.7411 & 0.000167 \tabularnewline
48 & -0.408857 & -3.7472 & 0.000164 \tabularnewline
\hline
\end{tabular}
%Source: https://freestatistics.org/blog/index.php?pk=79169&T=1

[TABLE]
[ROW][C]Autocorrelation Function[/C][/ROW]
[ROW][C]Time lag k[/C][C]ACF(k)[/C][C]T-STAT[/C][C]P-value[/C][/ROW]
[ROW][C]1[/C][C]0.96421[/C][C]8.8371[/C][C]0[/C][/ROW]
[ROW][C]2[/C][C]0.947771[/C][C]8.6865[/C][C]0[/C][/ROW]
[ROW][C]3[/C][C]0.923373[/C][C]8.4629[/C][C]0[/C][/ROW]
[ROW][C]4[/C][C]0.901348[/C][C]8.261[/C][C]0[/C][/ROW]
[ROW][C]5[/C][C]0.872824[/C][C]7.9996[/C][C]0[/C][/ROW]
[ROW][C]6[/C][C]0.850712[/C][C]7.7969[/C][C]0[/C][/ROW]
[ROW][C]7[/C][C]0.820326[/C][C]7.5184[/C][C]0[/C][/ROW]
[ROW][C]8[/C][C]0.790397[/C][C]7.2441[/C][C]0[/C][/ROW]
[ROW][C]9[/C][C]0.749499[/C][C]6.8693[/C][C]0[/C][/ROW]
[ROW][C]10[/C][C]0.712656[/C][C]6.5316[/C][C]0[/C][/ROW]
[ROW][C]11[/C][C]0.66968[/C][C]6.1377[/C][C]0[/C][/ROW]
[ROW][C]12[/C][C]0.641112[/C][C]5.8759[/C][C]0[/C][/ROW]
[ROW][C]13[/C][C]0.583661[/C][C]5.3493[/C][C]0[/C][/ROW]
[ROW][C]14[/C][C]0.543982[/C][C]4.9857[/C][C]2e-06[/C][/ROW]
[ROW][C]15[/C][C]0.499743[/C][C]4.5802[/C][C]8e-06[/C][/ROW]
[ROW][C]16[/C][C]0.4588[/C][C]4.205[/C][C]3.2e-05[/C][/ROW]
[ROW][C]17[/C][C]0.415836[/C][C]3.8112[/C][C]0.000131[/C][/ROW]
[ROW][C]18[/C][C]0.37492[/C][C]3.4362[/C][C]0.00046[/C][/ROW]
[ROW][C]19[/C][C]0.330303[/C][C]3.0273[/C][C]0.001638[/C][/ROW]
[ROW][C]20[/C][C]0.28925[/C][C]2.651[/C][C]0.004795[/C][/ROW]
[ROW][C]21[/C][C]0.246638[/C][C]2.2605[/C][C]0.013189[/C][/ROW]
[ROW][C]22[/C][C]0.202568[/C][C]1.8566[/C][C]0.033439[/C][/ROW]
[ROW][C]23[/C][C]0.162147[/C][C]1.4861[/C][C]0.070498[/C][/ROW]
[ROW][C]24[/C][C]0.134179[/C][C]1.2298[/C][C]0.111108[/C][/ROW]
[ROW][C]25[/C][C]0.08905[/C][C]0.8162[/C][C]0.208359[/C][/ROW]
[ROW][C]26[/C][C]0.057113[/C][C]0.5234[/C][C]0.301021[/C][/ROW]
[ROW][C]27[/C][C]0.020209[/C][C]0.1852[/C][C]0.426752[/C][/ROW]
[ROW][C]28[/C][C]-0.009555[/C][C]-0.0876[/C][C]0.465211[/C][/ROW]
[ROW][C]29[/C][C]-0.042174[/C][C]-0.3865[/C][C]0.35004[/C][/ROW]
[ROW][C]30[/C][C]-0.07401[/C][C]-0.6783[/C][C]0.249718[/C][/ROW]
[ROW][C]31[/C][C]-0.10574[/C][C]-0.9691[/C][C]0.167634[/C][/ROW]
[ROW][C]32[/C][C]-0.135106[/C][C]-1.2383[/C][C]0.109534[/C][/ROW]
[ROW][C]33[/C][C]-0.160828[/C][C]-1.474[/C][C]0.072108[/C][/ROW]
[ROW][C]34[/C][C]-0.192846[/C][C]-1.7675[/C][C]0.040391[/C][/ROW]
[ROW][C]35[/C][C]-0.218835[/C][C]-2.0057[/C][C]0.024056[/C][/ROW]
[ROW][C]36[/C][C]-0.231637[/C][C]-2.123[/C][C]0.018349[/C][/ROW]
[ROW][C]37[/C][C]-0.261357[/C][C]-2.3954[/C][C]0.009413[/C][/ROW]
[ROW][C]38[/C][C]-0.278326[/C][C]-2.5509[/C][C]0.006279[/C][/ROW]
[ROW][C]39[/C][C]-0.302615[/C][C]-2.7735[/C][C]0.003415[/C][/ROW]
[ROW][C]40[/C][C]-0.319375[/C][C]-2.9271[/C][C]0.0022[/C][/ROW]
[ROW][C]41[/C][C]-0.338422[/C][C]-3.1017[/C][C]0.00131[/C][/ROW]
[ROW][C]42[/C][C]-0.355611[/C][C]-3.2592[/C][C]0.000807[/C][/ROW]
[ROW][C]43[/C][C]-0.369492[/C][C]-3.3865[/C][C]0.00054[/C][/ROW]
[ROW][C]44[/C][C]-0.37852[/C][C]-3.4692[/C][C]0.000413[/C][/ROW]
[ROW][C]45[/C][C]-0.38627[/C][C]-3.5402[/C][C]0.000327[/C][/ROW]
[ROW][C]46[/C][C]-0.398583[/C][C]-3.6531[/C][C]0.000225[/C][/ROW]
[ROW][C]47[/C][C]-0.408187[/C][C]-3.7411[/C][C]0.000167[/C][/ROW]
[ROW][C]48[/C][C]-0.408857[/C][C]-3.7472[/C][C]0.000164[/C][/ROW]
[/TABLE]
Source: https://freestatistics.org/blog/index.php?pk=79169&T=1

Globally Unique Identifier (entire table): ba.freestatistics.org/blog/index.php?pk=79169&T=1

As an alternative you can also use a QR Code:  

The GUIDs for individual cells are displayed in the table below:

Autocorrelation Function
Time lag kACF(k)T-STATP-value
10.964218.83710
20.9477718.68650
30.9233738.46290
40.9013488.2610
50.8728247.99960
60.8507127.79690
70.8203267.51840
80.7903977.24410
90.7494996.86930
100.7126566.53160
110.669686.13770
120.6411125.87590
130.5836615.34930
140.5439824.98572e-06
150.4997434.58028e-06
160.45884.2053.2e-05
170.4158363.81120.000131
180.374923.43620.00046
190.3303033.02730.001638
200.289252.6510.004795
210.2466382.26050.013189
220.2025681.85660.033439
230.1621471.48610.070498
240.1341791.22980.111108
250.089050.81620.208359
260.0571130.52340.301021
270.0202090.18520.426752
28-0.009555-0.08760.465211
29-0.042174-0.38650.35004
30-0.07401-0.67830.249718
31-0.10574-0.96910.167634
32-0.135106-1.23830.109534
33-0.160828-1.4740.072108
34-0.192846-1.76750.040391
35-0.218835-2.00570.024056
36-0.231637-2.1230.018349
37-0.261357-2.39540.009413
38-0.278326-2.55090.006279
39-0.302615-2.77350.003415
40-0.319375-2.92710.0022
41-0.338422-3.10170.00131
42-0.355611-3.25920.000807
43-0.369492-3.38650.00054
44-0.37852-3.46920.000413
45-0.38627-3.54020.000327
46-0.398583-3.65310.000225
47-0.408187-3.74110.000167
48-0.408857-3.74720.000164


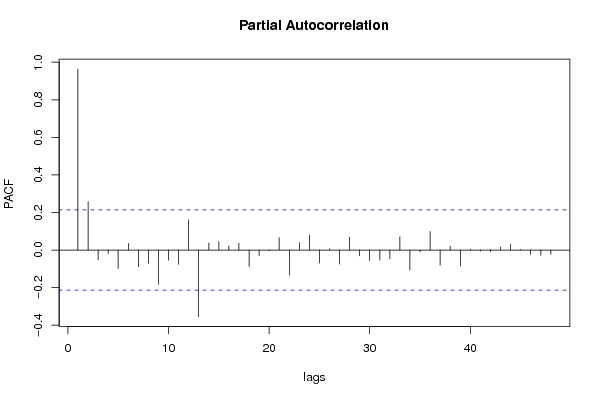
Partial Autocorrelation Function
Time lag kPACF(k)T-STATP-value
10.964218.83710
20.2570492.35590.010404
3-0.052124-0.47770.317043
4-0.01905-0.17460.430909
5-0.098747-0.9050.184019
60.0350560.32130.374393
7-0.089169-0.81730.208049
8-0.070404-0.64530.260258
9-0.182435-1.6720.049119
10-0.053933-0.49430.311191
11-0.076046-0.6970.243871
120.1609091.47480.072009
13-0.354929-3.2530.000823
140.0370090.33920.367655
150.0452180.41440.339807
160.0215890.19790.421815
170.035780.32790.371889
18-0.088401-0.81020.210055
19-0.029428-0.26970.394022
20-0.003376-0.03090.487696
210.0655770.6010.274721
22-0.133996-1.22810.111422
230.0397060.36390.35842
240.0802970.73590.231912
25-0.069668-0.63850.262437
260.0063410.05810.476897
27-0.074443-0.68230.248469
280.0682340.62540.266711
29-0.03122-0.28610.38774
30-0.056293-0.51590.303628
31-0.054378-0.49840.309759
32-0.046247-0.42390.336376
330.070040.64190.261334
34-0.106954-0.98030.164888
35-0.009744-0.08930.464527
360.0992070.90920.182911
37-0.080794-0.74050.230533
380.0206290.18910.425249
39-0.085058-0.77960.218919
400.0041270.03780.484959
41-0.005757-0.05280.479022
42-0.008591-0.07870.468714
430.0164750.1510.440169
440.0294460.26990.393957
450.0026670.02440.490277
46-0.024337-0.22310.412018
47-0.028123-0.25770.398616
48-0.023075-0.21150.416512

\begin{tabular}{lllllllll}
\hline
Partial Autocorrelation Function \tabularnewline
Time lag k & PACF(k) & T-STAT & P-value \tabularnewline
1 & 0.96421 & 8.8371 & 0 \tabularnewline
2 & 0.257049 & 2.3559 & 0.010404 \tabularnewline
3 & -0.052124 & -0.4777 & 0.317043 \tabularnewline
4 & -0.01905 & -0.1746 & 0.430909 \tabularnewline
5 & -0.098747 & -0.905 & 0.184019 \tabularnewline
6 & 0.035056 & 0.3213 & 0.374393 \tabularnewline
7 & -0.089169 & -0.8173 & 0.208049 \tabularnewline
8 & -0.070404 & -0.6453 & 0.260258 \tabularnewline
9 & -0.182435 & -1.672 & 0.049119 \tabularnewline
10 & -0.053933 & -0.4943 & 0.311191 \tabularnewline
11 & -0.076046 & -0.697 & 0.243871 \tabularnewline
12 & 0.160909 & 1.4748 & 0.072009 \tabularnewline
13 & -0.354929 & -3.253 & 0.000823 \tabularnewline
14 & 0.037009 & 0.3392 & 0.367655 \tabularnewline
15 & 0.045218 & 0.4144 & 0.339807 \tabularnewline
16 & 0.021589 & 0.1979 & 0.421815 \tabularnewline
17 & 0.03578 & 0.3279 & 0.371889 \tabularnewline
18 & -0.088401 & -0.8102 & 0.210055 \tabularnewline
19 & -0.029428 & -0.2697 & 0.394022 \tabularnewline
20 & -0.003376 & -0.0309 & 0.487696 \tabularnewline
21 & 0.065577 & 0.601 & 0.274721 \tabularnewline
22 & -0.133996 & -1.2281 & 0.111422 \tabularnewline
23 & 0.039706 & 0.3639 & 0.35842 \tabularnewline
24 & 0.080297 & 0.7359 & 0.231912 \tabularnewline
25 & -0.069668 & -0.6385 & 0.262437 \tabularnewline
26 & 0.006341 & 0.0581 & 0.476897 \tabularnewline
27 & -0.074443 & -0.6823 & 0.248469 \tabularnewline
28 & 0.068234 & 0.6254 & 0.266711 \tabularnewline
29 & -0.03122 & -0.2861 & 0.38774 \tabularnewline
30 & -0.056293 & -0.5159 & 0.303628 \tabularnewline
31 & -0.054378 & -0.4984 & 0.309759 \tabularnewline
32 & -0.046247 & -0.4239 & 0.336376 \tabularnewline
33 & 0.07004 & 0.6419 & 0.261334 \tabularnewline
34 & -0.106954 & -0.9803 & 0.164888 \tabularnewline
35 & -0.009744 & -0.0893 & 0.464527 \tabularnewline
36 & 0.099207 & 0.9092 & 0.182911 \tabularnewline
37 & -0.080794 & -0.7405 & 0.230533 \tabularnewline
38 & 0.020629 & 0.1891 & 0.425249 \tabularnewline
39 & -0.085058 & -0.7796 & 0.218919 \tabularnewline
40 & 0.004127 & 0.0378 & 0.484959 \tabularnewline
41 & -0.005757 & -0.0528 & 0.479022 \tabularnewline
42 & -0.008591 & -0.0787 & 0.468714 \tabularnewline
43 & 0.016475 & 0.151 & 0.440169 \tabularnewline
44 & 0.029446 & 0.2699 & 0.393957 \tabularnewline
45 & 0.002667 & 0.0244 & 0.490277 \tabularnewline
46 & -0.024337 & -0.2231 & 0.412018 \tabularnewline
47 & -0.028123 & -0.2577 & 0.398616 \tabularnewline
48 & -0.023075 & -0.2115 & 0.416512 \tabularnewline
\hline
\end{tabular}
%Source: https://freestatistics.org/blog/index.php?pk=79169&T=2

[TABLE]
[ROW][C]Partial Autocorrelation Function[/C][/ROW]
[ROW][C]Time lag k[/C][C]PACF(k)[/C][C]T-STAT[/C][C]P-value[/C][/ROW]
[ROW][C]1[/C][C]0.96421[/C][C]8.8371[/C][C]0[/C][/ROW]
[ROW][C]2[/C][C]0.257049[/C][C]2.3559[/C][C]0.010404[/C][/ROW]
[ROW][C]3[/C][C]-0.052124[/C][C]-0.4777[/C][C]0.317043[/C][/ROW]
[ROW][C]4[/C][C]-0.01905[/C][C]-0.1746[/C][C]0.430909[/C][/ROW]
[ROW][C]5[/C][C]-0.098747[/C][C]-0.905[/C][C]0.184019[/C][/ROW]
[ROW][C]6[/C][C]0.035056[/C][C]0.3213[/C][C]0.374393[/C][/ROW]
[ROW][C]7[/C][C]-0.089169[/C][C]-0.8173[/C][C]0.208049[/C][/ROW]
[ROW][C]8[/C][C]-0.070404[/C][C]-0.6453[/C][C]0.260258[/C][/ROW]
[ROW][C]9[/C][C]-0.182435[/C][C]-1.672[/C][C]0.049119[/C][/ROW]
[ROW][C]10[/C][C]-0.053933[/C][C]-0.4943[/C][C]0.311191[/C][/ROW]
[ROW][C]11[/C][C]-0.076046[/C][C]-0.697[/C][C]0.243871[/C][/ROW]
[ROW][C]12[/C][C]0.160909[/C][C]1.4748[/C][C]0.072009[/C][/ROW]
[ROW][C]13[/C][C]-0.354929[/C][C]-3.253[/C][C]0.000823[/C][/ROW]
[ROW][C]14[/C][C]0.037009[/C][C]0.3392[/C][C]0.367655[/C][/ROW]
[ROW][C]15[/C][C]0.045218[/C][C]0.4144[/C][C]0.339807[/C][/ROW]
[ROW][C]16[/C][C]0.021589[/C][C]0.1979[/C][C]0.421815[/C][/ROW]
[ROW][C]17[/C][C]0.03578[/C][C]0.3279[/C][C]0.371889[/C][/ROW]
[ROW][C]18[/C][C]-0.088401[/C][C]-0.8102[/C][C]0.210055[/C][/ROW]
[ROW][C]19[/C][C]-0.029428[/C][C]-0.2697[/C][C]0.394022[/C][/ROW]
[ROW][C]20[/C][C]-0.003376[/C][C]-0.0309[/C][C]0.487696[/C][/ROW]
[ROW][C]21[/C][C]0.065577[/C][C]0.601[/C][C]0.274721[/C][/ROW]
[ROW][C]22[/C][C]-0.133996[/C][C]-1.2281[/C][C]0.111422[/C][/ROW]
[ROW][C]23[/C][C]0.039706[/C][C]0.3639[/C][C]0.35842[/C][/ROW]
[ROW][C]24[/C][C]0.080297[/C][C]0.7359[/C][C]0.231912[/C][/ROW]
[ROW][C]25[/C][C]-0.069668[/C][C]-0.6385[/C][C]0.262437[/C][/ROW]
[ROW][C]26[/C][C]0.006341[/C][C]0.0581[/C][C]0.476897[/C][/ROW]
[ROW][C]27[/C][C]-0.074443[/C][C]-0.6823[/C][C]0.248469[/C][/ROW]
[ROW][C]28[/C][C]0.068234[/C][C]0.6254[/C][C]0.266711[/C][/ROW]
[ROW][C]29[/C][C]-0.03122[/C][C]-0.2861[/C][C]0.38774[/C][/ROW]
[ROW][C]30[/C][C]-0.056293[/C][C]-0.5159[/C][C]0.303628[/C][/ROW]
[ROW][C]31[/C][C]-0.054378[/C][C]-0.4984[/C][C]0.309759[/C][/ROW]
[ROW][C]32[/C][C]-0.046247[/C][C]-0.4239[/C][C]0.336376[/C][/ROW]
[ROW][C]33[/C][C]0.07004[/C][C]0.6419[/C][C]0.261334[/C][/ROW]
[ROW][C]34[/C][C]-0.106954[/C][C]-0.9803[/C][C]0.164888[/C][/ROW]
[ROW][C]35[/C][C]-0.009744[/C][C]-0.0893[/C][C]0.464527[/C][/ROW]
[ROW][C]36[/C][C]0.099207[/C][C]0.9092[/C][C]0.182911[/C][/ROW]
[ROW][C]37[/C][C]-0.080794[/C][C]-0.7405[/C][C]0.230533[/C][/ROW]
[ROW][C]38[/C][C]0.020629[/C][C]0.1891[/C][C]0.425249[/C][/ROW]
[ROW][C]39[/C][C]-0.085058[/C][C]-0.7796[/C][C]0.218919[/C][/ROW]
[ROW][C]40[/C][C]0.004127[/C][C]0.0378[/C][C]0.484959[/C][/ROW]
[ROW][C]41[/C][C]-0.005757[/C][C]-0.0528[/C][C]0.479022[/C][/ROW]
[ROW][C]42[/C][C]-0.008591[/C][C]-0.0787[/C][C]0.468714[/C][/ROW]
[ROW][C]43[/C][C]0.016475[/C][C]0.151[/C][C]0.440169[/C][/ROW]
[ROW][C]44[/C][C]0.029446[/C][C]0.2699[/C][C]0.393957[/C][/ROW]
[ROW][C]45[/C][C]0.002667[/C][C]0.0244[/C][C]0.490277[/C][/ROW]
[ROW][C]46[/C][C]-0.024337[/C][C]-0.2231[/C][C]0.412018[/C][/ROW]
[ROW][C]47[/C][C]-0.028123[/C][C]-0.2577[/C][C]0.398616[/C][/ROW]
[ROW][C]48[/C][C]-0.023075[/C][C]-0.2115[/C][C]0.416512[/C][/ROW]
[/TABLE]
Source: https://freestatistics.org/blog/index.php?pk=79169&T=2

Globally Unique Identifier (entire table): ba.freestatistics.org/blog/index.php?pk=79169&T=2

As an alternative you can also use a QR Code:  

The GUIDs for individual cells are displayed in the table below:

Partial Autocorrelation Function
Time lag kPACF(k)T-STATP-value
10.964218.83710
20.2570492.35590.010404
3-0.052124-0.47770.317043
4-0.01905-0.17460.430909
5-0.098747-0.9050.184019
60.0350560.32130.374393
7-0.089169-0.81730.208049
8-0.070404-0.64530.260258
9-0.182435-1.6720.049119
10-0.053933-0.49430.311191
11-0.076046-0.6970.243871
120.1609091.47480.072009
13-0.354929-3.2530.000823
140.0370090.33920.367655
150.0452180.41440.339807
160.0215890.19790.421815
170.035780.32790.371889
18-0.088401-0.81020.210055
19-0.029428-0.26970.394022
20-0.003376-0.03090.487696
210.0655770.6010.274721
22-0.133996-1.22810.111422
230.0397060.36390.35842
240.0802970.73590.231912
25-0.069668-0.63850.262437
260.0063410.05810.476897
27-0.074443-0.68230.248469
280.0682340.62540.266711
29-0.03122-0.28610.38774
30-0.056293-0.51590.303628
31-0.054378-0.49840.309759
32-0.046247-0.42390.336376
330.070040.64190.261334
34-0.106954-0.98030.164888
35-0.009744-0.08930.464527
360.0992070.90920.182911
37-0.080794-0.74050.230533
380.0206290.18910.425249
39-0.085058-0.77960.218919
400.0041270.03780.484959
41-0.005757-0.05280.479022
42-0.008591-0.07870.468714
430.0164750.1510.440169
440.0294460.26990.393957
450.0026670.02440.490277
46-0.024337-0.22310.412018
47-0.028123-0.25770.398616
48-0.023075-0.21150.416512


Parameters (Session):
par1 = 48 ; par2 = 1 ; par3 = 0 ; par4 = 0 ; par5 = 12 ; par6 = White Noise ; par7 = 0.95 ;
Parameters (R input):
par1 = 48 ; par2 = 1 ; par3 = 0 ; par4 = 0 ; par5 = 12 ; par6 = White Noise ; par7 = 0.95 ;
R code (references can be found in the software module):
if (par1 == 'Default') {
par1 = 10*log10(length(x))
} else {
par1 <- as.numeric(par1)
}
par2 <- as.numeric(par2)
par3 <- as.numeric(par3)
par4 <- as.numeric(par4)
par5 <- as.numeric(par5)
if (par6 == 'White Noise') par6 <- 'white' else par6 <- 'ma'
par7 <- as.numeric(par7)
if (par2 == 0) {
x <- log(x)
} else {
x <- (x ^ par2 - 1) / par2
}
if (par3 > 0) x <- diff(x,lag=1,difference=par3)
if (par4 > 0) x <- diff(x,lag=par5,difference=par4)
bitmap(file='pic1.png')
racf <- acf(x, par1, main='Autocorrelation', xlab='time lag', ylab='ACF', ci.type=par6, ci=par7, sub=paste('(lambda=',par2,', d=',par3,', D=',par4,', CI=', par7, ', CI type=',par6,')',sep=''))
dev.off()
bitmap(file='pic2.png')
rpacf <- pacf(x,par1,main='Partial Autocorrelation',xlab='lags',ylab='PACF')
dev.off()
(myacf <- c(racf$acf))
(mypacf <- c(rpacf$acf))
lengthx <- length(x)
sqrtn <- sqrt(lengthx)
load(file='createtable')
a<-table.start()
a<-table.row.start(a)
a<-table.element(a,'Autocorrelation Function',4,TRUE)
a<-table.row.end(a)
a<-table.row.start(a)
a<-table.element(a,'Time lag k',header=TRUE)
a<-table.element(a,hyperlink('basics.htm','ACF(k)','click here for more information about the Autocorrelation Function'),header=TRUE)
a<-table.element(a,'T-STAT',header=TRUE)
a<-table.element(a,'P-value',header=TRUE)
a<-table.row.end(a)
for (i in 2:(par1+1)) {
a<-table.row.start(a)
a<-table.element(a,i-1,header=TRUE)
a<-table.element(a,round(myacf[i],6))
mytstat <- myacf[i]*sqrtn
a<-table.element(a,round(mytstat,4))
a<-table.element(a,round(1-pt(abs(mytstat),lengthx),6))
a<-table.row.end(a)
}
a<-table.end(a)
table.save(a,file='mytable.tab')
a<-table.start()
a<-table.row.start(a)
a<-table.element(a,'Partial Autocorrelation Function',4,TRUE)
a<-table.row.end(a)
a<-table.row.start(a)
a<-table.element(a,'Time lag k',header=TRUE)
a<-table.element(a,hyperlink('basics.htm','PACF(k)','click here for more information about the Partial Autocorrelation Function'),header=TRUE)
a<-table.element(a,'T-STAT',header=TRUE)
a<-table.element(a,'P-value',header=TRUE)
a<-table.row.end(a)
for (i in 1:par1) {
a<-table.row.start(a)
a<-table.element(a,i,header=TRUE)
a<-table.element(a,round(mypacf[i],6))
mytstat <- mypacf[i]*sqrtn
a<-table.element(a,round(mytstat,4))
a<-table.element(a,round(1-pt(abs(mytstat),lengthx),6))
a<-table.row.end(a)
}
a<-table.end(a)
table.save(a,file='mytable1.tab')