Free Statistics

of Irreproducible Research!

Author's title

Author*Unverified author*
R Software Modulerwasp_autocorrelation.wasp
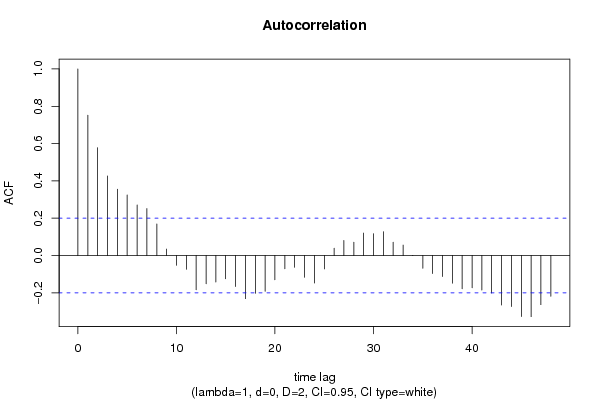
Title produced by software(Partial) Autocorrelation Function
Date of computationMon, 16 Aug 2010 18:08:10 +0000
Cite this page as followsStatistical Computations at FreeStatistics.org, Office for Research Development and Education, URL https://freestatistics.org/blog/index.php?v=date/2010/Aug/16/t1281982066qb77i2570r940xs.htm/, Retrieved Thu, 16 May 2024 19:21:45 +0000
Statistical Computations at FreeStatistics.org, Office for Research Development and Education, URL https://freestatistics.org/blog/index.php?pk=79034, Retrieved Thu, 16 May 2024 19:21:45 +0000
QR Codes:

Original text written by user:
IsPrivate?No (this computation is public)
User-defined keywordsmattias debbaut
Estimated Impact113
Family? (F = Feedback message, R = changed R code, M = changed R Module, P = changed Parameters, D = changed Data)
-       [(Partial) Autocorrelation Function] [autocorrelation F...] [2010-08-16 18:08:10] [59fa324537f53fb6459bc6951db20f7b] [Current]
Feedback Forum

Post a new message
Dataseries X:
900
899
898
896
916
915
900
890
891
891
892
894
896
889
878
883
901
897
881
866
867
866
862
871
865
856
847
859
870
872
856
839
829
825
822
827
822
812
810
816
820
823
810
793
777
772
765
765
753
742
736
740
742
742
728
707
699
696
689
692
673
653
642
648
654
653
630
609
598
601
592
591
568
538
523
530
529
534
513
491
480
478
462
461
437
411
400
405
395
407
385
366
349
343
332
327
306
276
269
268
260
274
247
226
212
199
188
179
155
124
117
116
105
112
86
64
53
42
32
24


Summary of computational transaction
Raw Inputview raw input (R code)
Raw Outputview raw output of R engine
Computing time2 seconds
R Server'Sir Ronald Aylmer Fisher' @ 193.190.124.24

\begin{tabular}{lllllllll}
\hline
Summary of computational transaction \tabularnewline
Raw Input & view raw input (R code)  \tabularnewline
Raw Output & view raw output of R engine  \tabularnewline
Computing time & 2 seconds \tabularnewline
R Server & 'Sir Ronald Aylmer Fisher' @ 193.190.124.24 \tabularnewline
\hline
\end{tabular}
%Source: https://freestatistics.org/blog/index.php?pk=79034&T=0

[TABLE]
[ROW][C]Summary of computational transaction[/C][/ROW]
[ROW][C]Raw Input[/C][C]view raw input (R code) [/C][/ROW]
[ROW][C]Raw Output[/C][C]view raw output of R engine [/C][/ROW]
[ROW][C]Computing time[/C][C]2 seconds[/C][/ROW]
[ROW][C]R Server[/C][C]'Sir Ronald Aylmer Fisher' @ 193.190.124.24[/C][/ROW]
[/TABLE]
Source: https://freestatistics.org/blog/index.php?pk=79034&T=0

Globally Unique Identifier (entire table): ba.freestatistics.org/blog/index.php?pk=79034&T=0

As an alternative you can also use a QR Code:  

The GUIDs for individual cells are displayed in the table below:

Summary of computational transaction
Raw Inputview raw input (R code)
Raw Outputview raw output of R engine
Computing time2 seconds
R Server'Sir Ronald Aylmer Fisher' @ 193.190.124.24


Autocorrelation Function
Time lag kACF(k)T-STATP-value
10.7515647.36380
20.5777725.6610
30.4264644.17853.2e-05
40.3552143.48040.000377
50.3247223.18160.000987
60.2706532.65180.004683
70.2517222.46640.007711
80.1692631.65840.050247
90.0345370.33840.367902
10-0.052303-0.51250.304753
11-0.074032-0.72540.234998
12-0.183127-1.79430.037959
13-0.15169-1.48630.070245
14-0.142232-1.39360.083331
15-0.124772-1.22250.112254
16-0.165888-1.62540.053681
17-0.230974-2.26310.012942
18-0.202619-1.98530.024985
19-0.191808-1.87930.031617
20-0.129407-1.26790.103946
21-0.070919-0.69490.244411
22-0.063014-0.61740.269215
23-0.116676-1.14320.127902
24-0.146977-1.44010.076549
25-0.071538-0.70090.242522
260.0389630.38180.351743
270.0809940.79360.214699
280.0714670.70020.24274
290.1202311.1780.12085
300.1171681.1480.126909
310.1273281.24760.107615
320.0717370.70290.241916
330.0560280.5490.292154
34-0.000725-0.00710.497175
35-0.068493-0.67110.251887
36-0.096917-0.94960.172353
37-0.112203-1.09940.13718
38-0.148121-1.45130.07498
39-0.177859-1.74270.042298
40-0.172789-1.6930.046851
41-0.184648-1.80920.036777
42-0.201411-1.97340.025662
43-0.265434-2.60070.005387
44-0.273063-2.67550.004387
45-0.326823-3.20220.000925
46-0.327511-3.20890.000906
47-0.263178-2.57860.005719
48-0.21831-2.1390.017487

\begin{tabular}{lllllllll}
\hline
Autocorrelation Function \tabularnewline
Time lag k & ACF(k) & T-STAT & P-value \tabularnewline
1 & 0.751564 & 7.3638 & 0 \tabularnewline
2 & 0.577772 & 5.661 & 0 \tabularnewline
3 & 0.426464 & 4.1785 & 3.2e-05 \tabularnewline
4 & 0.355214 & 3.4804 & 0.000377 \tabularnewline
5 & 0.324722 & 3.1816 & 0.000987 \tabularnewline
6 & 0.270653 & 2.6518 & 0.004683 \tabularnewline
7 & 0.251722 & 2.4664 & 0.007711 \tabularnewline
8 & 0.169263 & 1.6584 & 0.050247 \tabularnewline
9 & 0.034537 & 0.3384 & 0.367902 \tabularnewline
10 & -0.052303 & -0.5125 & 0.304753 \tabularnewline
11 & -0.074032 & -0.7254 & 0.234998 \tabularnewline
12 & -0.183127 & -1.7943 & 0.037959 \tabularnewline
13 & -0.15169 & -1.4863 & 0.070245 \tabularnewline
14 & -0.142232 & -1.3936 & 0.083331 \tabularnewline
15 & -0.124772 & -1.2225 & 0.112254 \tabularnewline
16 & -0.165888 & -1.6254 & 0.053681 \tabularnewline
17 & -0.230974 & -2.2631 & 0.012942 \tabularnewline
18 & -0.202619 & -1.9853 & 0.024985 \tabularnewline
19 & -0.191808 & -1.8793 & 0.031617 \tabularnewline
20 & -0.129407 & -1.2679 & 0.103946 \tabularnewline
21 & -0.070919 & -0.6949 & 0.244411 \tabularnewline
22 & -0.063014 & -0.6174 & 0.269215 \tabularnewline
23 & -0.116676 & -1.1432 & 0.127902 \tabularnewline
24 & -0.146977 & -1.4401 & 0.076549 \tabularnewline
25 & -0.071538 & -0.7009 & 0.242522 \tabularnewline
26 & 0.038963 & 0.3818 & 0.351743 \tabularnewline
27 & 0.080994 & 0.7936 & 0.214699 \tabularnewline
28 & 0.071467 & 0.7002 & 0.24274 \tabularnewline
29 & 0.120231 & 1.178 & 0.12085 \tabularnewline
30 & 0.117168 & 1.148 & 0.126909 \tabularnewline
31 & 0.127328 & 1.2476 & 0.107615 \tabularnewline
32 & 0.071737 & 0.7029 & 0.241916 \tabularnewline
33 & 0.056028 & 0.549 & 0.292154 \tabularnewline
34 & -0.000725 & -0.0071 & 0.497175 \tabularnewline
35 & -0.068493 & -0.6711 & 0.251887 \tabularnewline
36 & -0.096917 & -0.9496 & 0.172353 \tabularnewline
37 & -0.112203 & -1.0994 & 0.13718 \tabularnewline
38 & -0.148121 & -1.4513 & 0.07498 \tabularnewline
39 & -0.177859 & -1.7427 & 0.042298 \tabularnewline
40 & -0.172789 & -1.693 & 0.046851 \tabularnewline
41 & -0.184648 & -1.8092 & 0.036777 \tabularnewline
42 & -0.201411 & -1.9734 & 0.025662 \tabularnewline
43 & -0.265434 & -2.6007 & 0.005387 \tabularnewline
44 & -0.273063 & -2.6755 & 0.004387 \tabularnewline
45 & -0.326823 & -3.2022 & 0.000925 \tabularnewline
46 & -0.327511 & -3.2089 & 0.000906 \tabularnewline
47 & -0.263178 & -2.5786 & 0.005719 \tabularnewline
48 & -0.21831 & -2.139 & 0.017487 \tabularnewline
\hline
\end{tabular}
%Source: https://freestatistics.org/blog/index.php?pk=79034&T=1

[TABLE]
[ROW][C]Autocorrelation Function[/C][/ROW]
[ROW][C]Time lag k[/C][C]ACF(k)[/C][C]T-STAT[/C][C]P-value[/C][/ROW]
[ROW][C]1[/C][C]0.751564[/C][C]7.3638[/C][C]0[/C][/ROW]
[ROW][C]2[/C][C]0.577772[/C][C]5.661[/C][C]0[/C][/ROW]
[ROW][C]3[/C][C]0.426464[/C][C]4.1785[/C][C]3.2e-05[/C][/ROW]
[ROW][C]4[/C][C]0.355214[/C][C]3.4804[/C][C]0.000377[/C][/ROW]
[ROW][C]5[/C][C]0.324722[/C][C]3.1816[/C][C]0.000987[/C][/ROW]
[ROW][C]6[/C][C]0.270653[/C][C]2.6518[/C][C]0.004683[/C][/ROW]
[ROW][C]7[/C][C]0.251722[/C][C]2.4664[/C][C]0.007711[/C][/ROW]
[ROW][C]8[/C][C]0.169263[/C][C]1.6584[/C][C]0.050247[/C][/ROW]
[ROW][C]9[/C][C]0.034537[/C][C]0.3384[/C][C]0.367902[/C][/ROW]
[ROW][C]10[/C][C]-0.052303[/C][C]-0.5125[/C][C]0.304753[/C][/ROW]
[ROW][C]11[/C][C]-0.074032[/C][C]-0.7254[/C][C]0.234998[/C][/ROW]
[ROW][C]12[/C][C]-0.183127[/C][C]-1.7943[/C][C]0.037959[/C][/ROW]
[ROW][C]13[/C][C]-0.15169[/C][C]-1.4863[/C][C]0.070245[/C][/ROW]
[ROW][C]14[/C][C]-0.142232[/C][C]-1.3936[/C][C]0.083331[/C][/ROW]
[ROW][C]15[/C][C]-0.124772[/C][C]-1.2225[/C][C]0.112254[/C][/ROW]
[ROW][C]16[/C][C]-0.165888[/C][C]-1.6254[/C][C]0.053681[/C][/ROW]
[ROW][C]17[/C][C]-0.230974[/C][C]-2.2631[/C][C]0.012942[/C][/ROW]
[ROW][C]18[/C][C]-0.202619[/C][C]-1.9853[/C][C]0.024985[/C][/ROW]
[ROW][C]19[/C][C]-0.191808[/C][C]-1.8793[/C][C]0.031617[/C][/ROW]
[ROW][C]20[/C][C]-0.129407[/C][C]-1.2679[/C][C]0.103946[/C][/ROW]
[ROW][C]21[/C][C]-0.070919[/C][C]-0.6949[/C][C]0.244411[/C][/ROW]
[ROW][C]22[/C][C]-0.063014[/C][C]-0.6174[/C][C]0.269215[/C][/ROW]
[ROW][C]23[/C][C]-0.116676[/C][C]-1.1432[/C][C]0.127902[/C][/ROW]
[ROW][C]24[/C][C]-0.146977[/C][C]-1.4401[/C][C]0.076549[/C][/ROW]
[ROW][C]25[/C][C]-0.071538[/C][C]-0.7009[/C][C]0.242522[/C][/ROW]
[ROW][C]26[/C][C]0.038963[/C][C]0.3818[/C][C]0.351743[/C][/ROW]
[ROW][C]27[/C][C]0.080994[/C][C]0.7936[/C][C]0.214699[/C][/ROW]
[ROW][C]28[/C][C]0.071467[/C][C]0.7002[/C][C]0.24274[/C][/ROW]
[ROW][C]29[/C][C]0.120231[/C][C]1.178[/C][C]0.12085[/C][/ROW]
[ROW][C]30[/C][C]0.117168[/C][C]1.148[/C][C]0.126909[/C][/ROW]
[ROW][C]31[/C][C]0.127328[/C][C]1.2476[/C][C]0.107615[/C][/ROW]
[ROW][C]32[/C][C]0.071737[/C][C]0.7029[/C][C]0.241916[/C][/ROW]
[ROW][C]33[/C][C]0.056028[/C][C]0.549[/C][C]0.292154[/C][/ROW]
[ROW][C]34[/C][C]-0.000725[/C][C]-0.0071[/C][C]0.497175[/C][/ROW]
[ROW][C]35[/C][C]-0.068493[/C][C]-0.6711[/C][C]0.251887[/C][/ROW]
[ROW][C]36[/C][C]-0.096917[/C][C]-0.9496[/C][C]0.172353[/C][/ROW]
[ROW][C]37[/C][C]-0.112203[/C][C]-1.0994[/C][C]0.13718[/C][/ROW]
[ROW][C]38[/C][C]-0.148121[/C][C]-1.4513[/C][C]0.07498[/C][/ROW]
[ROW][C]39[/C][C]-0.177859[/C][C]-1.7427[/C][C]0.042298[/C][/ROW]
[ROW][C]40[/C][C]-0.172789[/C][C]-1.693[/C][C]0.046851[/C][/ROW]
[ROW][C]41[/C][C]-0.184648[/C][C]-1.8092[/C][C]0.036777[/C][/ROW]
[ROW][C]42[/C][C]-0.201411[/C][C]-1.9734[/C][C]0.025662[/C][/ROW]
[ROW][C]43[/C][C]-0.265434[/C][C]-2.6007[/C][C]0.005387[/C][/ROW]
[ROW][C]44[/C][C]-0.273063[/C][C]-2.6755[/C][C]0.004387[/C][/ROW]
[ROW][C]45[/C][C]-0.326823[/C][C]-3.2022[/C][C]0.000925[/C][/ROW]
[ROW][C]46[/C][C]-0.327511[/C][C]-3.2089[/C][C]0.000906[/C][/ROW]
[ROW][C]47[/C][C]-0.263178[/C][C]-2.5786[/C][C]0.005719[/C][/ROW]
[ROW][C]48[/C][C]-0.21831[/C][C]-2.139[/C][C]0.017487[/C][/ROW]
[/TABLE]
Source: https://freestatistics.org/blog/index.php?pk=79034&T=1

Globally Unique Identifier (entire table): ba.freestatistics.org/blog/index.php?pk=79034&T=1

As an alternative you can also use a QR Code:  

The GUIDs for individual cells are displayed in the table below:

Autocorrelation Function
Time lag kACF(k)T-STATP-value
10.7515647.36380
20.5777725.6610
30.4264644.17853.2e-05
40.3552143.48040.000377
50.3247223.18160.000987
60.2706532.65180.004683
70.2517222.46640.007711
80.1692631.65840.050247
90.0345370.33840.367902
10-0.052303-0.51250.304753
11-0.074032-0.72540.234998
12-0.183127-1.79430.037959
13-0.15169-1.48630.070245
14-0.142232-1.39360.083331
15-0.124772-1.22250.112254
16-0.165888-1.62540.053681
17-0.230974-2.26310.012942
18-0.202619-1.98530.024985
19-0.191808-1.87930.031617
20-0.129407-1.26790.103946
21-0.070919-0.69490.244411
22-0.063014-0.61740.269215
23-0.116676-1.14320.127902
24-0.146977-1.44010.076549
25-0.071538-0.70090.242522
260.0389630.38180.351743
270.0809940.79360.214699
280.0714670.70020.24274
290.1202311.1780.12085
300.1171681.1480.126909
310.1273281.24760.107615
320.0717370.70290.241916
330.0560280.5490.292154
34-0.000725-0.00710.497175
35-0.068493-0.67110.251887
36-0.096917-0.94960.172353
37-0.112203-1.09940.13718
38-0.148121-1.45130.07498
39-0.177859-1.74270.042298
40-0.172789-1.6930.046851
41-0.184648-1.80920.036777
42-0.201411-1.97340.025662
43-0.265434-2.60070.005387
44-0.273063-2.67550.004387
45-0.326823-3.20220.000925
46-0.327511-3.20890.000906
47-0.263178-2.57860.005719
48-0.21831-2.1390.017487


Partial Autocorrelation Function
Time lag kPACF(k)T-STATP-value
10.7515647.36380
20.0296990.2910.385842
3-0.039544-0.38740.349641
40.0912620.89420.186729
50.0791510.77550.219971
6-0.043943-0.43060.333878
70.0657740.64450.260409
8-0.116489-1.14140.128281
9-0.204963-2.00820.023715
10-0.018993-0.18610.426382
110.0578250.56660.286165
12-0.298707-2.92670.002138
130.2191882.14760.017132
140.0232890.22820.409994
15-0.072969-0.71490.238188
16-0.052838-0.51770.302927
17-0.028499-0.27920.390334
180.0203340.19920.421252
190.0117980.11560.454106
200.1108931.08650.139984
21-0.039345-0.38550.350358
22-0.106115-1.03970.150544
23-0.042017-0.41170.340747
24-0.070051-0.68640.247072
250.2391572.34330.01059
260.1017560.9970.160634
27-0.089162-0.87360.192257
28-0.088082-0.8630.195138
290.1758981.72340.044014
30-0.006288-0.06160.475501
31-0.017818-0.17460.430889
32-0.130559-1.27920.101953
33-0.067066-0.65710.25634
34-0.181684-1.78010.039109
35-0.039454-0.38660.349967
36-0.093586-0.91690.180733
370.0829560.81280.209171
380.0059730.05850.476727
390.0241510.23660.406725
40-0.084645-0.82930.204484
410.0149460.14640.441941
42-0.022241-0.21790.413978
43-0.059776-0.58570.279732
44-0.068169-0.66790.252894
45-0.170038-1.6660.049484
46-0.103377-1.01290.156832
470.0847640.83050.204155
48-0.024823-0.24320.404181

\begin{tabular}{lllllllll}
\hline
Partial Autocorrelation Function \tabularnewline
Time lag k & PACF(k) & T-STAT & P-value \tabularnewline
1 & 0.751564 & 7.3638 & 0 \tabularnewline
2 & 0.029699 & 0.291 & 0.385842 \tabularnewline
3 & -0.039544 & -0.3874 & 0.349641 \tabularnewline
4 & 0.091262 & 0.8942 & 0.186729 \tabularnewline
5 & 0.079151 & 0.7755 & 0.219971 \tabularnewline
6 & -0.043943 & -0.4306 & 0.333878 \tabularnewline
7 & 0.065774 & 0.6445 & 0.260409 \tabularnewline
8 & -0.116489 & -1.1414 & 0.128281 \tabularnewline
9 & -0.204963 & -2.0082 & 0.023715 \tabularnewline
10 & -0.018993 & -0.1861 & 0.426382 \tabularnewline
11 & 0.057825 & 0.5666 & 0.286165 \tabularnewline
12 & -0.298707 & -2.9267 & 0.002138 \tabularnewline
13 & 0.219188 & 2.1476 & 0.017132 \tabularnewline
14 & 0.023289 & 0.2282 & 0.409994 \tabularnewline
15 & -0.072969 & -0.7149 & 0.238188 \tabularnewline
16 & -0.052838 & -0.5177 & 0.302927 \tabularnewline
17 & -0.028499 & -0.2792 & 0.390334 \tabularnewline
18 & 0.020334 & 0.1992 & 0.421252 \tabularnewline
19 & 0.011798 & 0.1156 & 0.454106 \tabularnewline
20 & 0.110893 & 1.0865 & 0.139984 \tabularnewline
21 & -0.039345 & -0.3855 & 0.350358 \tabularnewline
22 & -0.106115 & -1.0397 & 0.150544 \tabularnewline
23 & -0.042017 & -0.4117 & 0.340747 \tabularnewline
24 & -0.070051 & -0.6864 & 0.247072 \tabularnewline
25 & 0.239157 & 2.3433 & 0.01059 \tabularnewline
26 & 0.101756 & 0.997 & 0.160634 \tabularnewline
27 & -0.089162 & -0.8736 & 0.192257 \tabularnewline
28 & -0.088082 & -0.863 & 0.195138 \tabularnewline
29 & 0.175898 & 1.7234 & 0.044014 \tabularnewline
30 & -0.006288 & -0.0616 & 0.475501 \tabularnewline
31 & -0.017818 & -0.1746 & 0.430889 \tabularnewline
32 & -0.130559 & -1.2792 & 0.101953 \tabularnewline
33 & -0.067066 & -0.6571 & 0.25634 \tabularnewline
34 & -0.181684 & -1.7801 & 0.039109 \tabularnewline
35 & -0.039454 & -0.3866 & 0.349967 \tabularnewline
36 & -0.093586 & -0.9169 & 0.180733 \tabularnewline
37 & 0.082956 & 0.8128 & 0.209171 \tabularnewline
38 & 0.005973 & 0.0585 & 0.476727 \tabularnewline
39 & 0.024151 & 0.2366 & 0.406725 \tabularnewline
40 & -0.084645 & -0.8293 & 0.204484 \tabularnewline
41 & 0.014946 & 0.1464 & 0.441941 \tabularnewline
42 & -0.022241 & -0.2179 & 0.413978 \tabularnewline
43 & -0.059776 & -0.5857 & 0.279732 \tabularnewline
44 & -0.068169 & -0.6679 & 0.252894 \tabularnewline
45 & -0.170038 & -1.666 & 0.049484 \tabularnewline
46 & -0.103377 & -1.0129 & 0.156832 \tabularnewline
47 & 0.084764 & 0.8305 & 0.204155 \tabularnewline
48 & -0.024823 & -0.2432 & 0.404181 \tabularnewline
\hline
\end{tabular}
%Source: https://freestatistics.org/blog/index.php?pk=79034&T=2

[TABLE]
[ROW][C]Partial Autocorrelation Function[/C][/ROW]
[ROW][C]Time lag k[/C][C]PACF(k)[/C][C]T-STAT[/C][C]P-value[/C][/ROW]
[ROW][C]1[/C][C]0.751564[/C][C]7.3638[/C][C]0[/C][/ROW]
[ROW][C]2[/C][C]0.029699[/C][C]0.291[/C][C]0.385842[/C][/ROW]
[ROW][C]3[/C][C]-0.039544[/C][C]-0.3874[/C][C]0.349641[/C][/ROW]
[ROW][C]4[/C][C]0.091262[/C][C]0.8942[/C][C]0.186729[/C][/ROW]
[ROW][C]5[/C][C]0.079151[/C][C]0.7755[/C][C]0.219971[/C][/ROW]
[ROW][C]6[/C][C]-0.043943[/C][C]-0.4306[/C][C]0.333878[/C][/ROW]
[ROW][C]7[/C][C]0.065774[/C][C]0.6445[/C][C]0.260409[/C][/ROW]
[ROW][C]8[/C][C]-0.116489[/C][C]-1.1414[/C][C]0.128281[/C][/ROW]
[ROW][C]9[/C][C]-0.204963[/C][C]-2.0082[/C][C]0.023715[/C][/ROW]
[ROW][C]10[/C][C]-0.018993[/C][C]-0.1861[/C][C]0.426382[/C][/ROW]
[ROW][C]11[/C][C]0.057825[/C][C]0.5666[/C][C]0.286165[/C][/ROW]
[ROW][C]12[/C][C]-0.298707[/C][C]-2.9267[/C][C]0.002138[/C][/ROW]
[ROW][C]13[/C][C]0.219188[/C][C]2.1476[/C][C]0.017132[/C][/ROW]
[ROW][C]14[/C][C]0.023289[/C][C]0.2282[/C][C]0.409994[/C][/ROW]
[ROW][C]15[/C][C]-0.072969[/C][C]-0.7149[/C][C]0.238188[/C][/ROW]
[ROW][C]16[/C][C]-0.052838[/C][C]-0.5177[/C][C]0.302927[/C][/ROW]
[ROW][C]17[/C][C]-0.028499[/C][C]-0.2792[/C][C]0.390334[/C][/ROW]
[ROW][C]18[/C][C]0.020334[/C][C]0.1992[/C][C]0.421252[/C][/ROW]
[ROW][C]19[/C][C]0.011798[/C][C]0.1156[/C][C]0.454106[/C][/ROW]
[ROW][C]20[/C][C]0.110893[/C][C]1.0865[/C][C]0.139984[/C][/ROW]
[ROW][C]21[/C][C]-0.039345[/C][C]-0.3855[/C][C]0.350358[/C][/ROW]
[ROW][C]22[/C][C]-0.106115[/C][C]-1.0397[/C][C]0.150544[/C][/ROW]
[ROW][C]23[/C][C]-0.042017[/C][C]-0.4117[/C][C]0.340747[/C][/ROW]
[ROW][C]24[/C][C]-0.070051[/C][C]-0.6864[/C][C]0.247072[/C][/ROW]
[ROW][C]25[/C][C]0.239157[/C][C]2.3433[/C][C]0.01059[/C][/ROW]
[ROW][C]26[/C][C]0.101756[/C][C]0.997[/C][C]0.160634[/C][/ROW]
[ROW][C]27[/C][C]-0.089162[/C][C]-0.8736[/C][C]0.192257[/C][/ROW]
[ROW][C]28[/C][C]-0.088082[/C][C]-0.863[/C][C]0.195138[/C][/ROW]
[ROW][C]29[/C][C]0.175898[/C][C]1.7234[/C][C]0.044014[/C][/ROW]
[ROW][C]30[/C][C]-0.006288[/C][C]-0.0616[/C][C]0.475501[/C][/ROW]
[ROW][C]31[/C][C]-0.017818[/C][C]-0.1746[/C][C]0.430889[/C][/ROW]
[ROW][C]32[/C][C]-0.130559[/C][C]-1.2792[/C][C]0.101953[/C][/ROW]
[ROW][C]33[/C][C]-0.067066[/C][C]-0.6571[/C][C]0.25634[/C][/ROW]
[ROW][C]34[/C][C]-0.181684[/C][C]-1.7801[/C][C]0.039109[/C][/ROW]
[ROW][C]35[/C][C]-0.039454[/C][C]-0.3866[/C][C]0.349967[/C][/ROW]
[ROW][C]36[/C][C]-0.093586[/C][C]-0.9169[/C][C]0.180733[/C][/ROW]
[ROW][C]37[/C][C]0.082956[/C][C]0.8128[/C][C]0.209171[/C][/ROW]
[ROW][C]38[/C][C]0.005973[/C][C]0.0585[/C][C]0.476727[/C][/ROW]
[ROW][C]39[/C][C]0.024151[/C][C]0.2366[/C][C]0.406725[/C][/ROW]
[ROW][C]40[/C][C]-0.084645[/C][C]-0.8293[/C][C]0.204484[/C][/ROW]
[ROW][C]41[/C][C]0.014946[/C][C]0.1464[/C][C]0.441941[/C][/ROW]
[ROW][C]42[/C][C]-0.022241[/C][C]-0.2179[/C][C]0.413978[/C][/ROW]
[ROW][C]43[/C][C]-0.059776[/C][C]-0.5857[/C][C]0.279732[/C][/ROW]
[ROW][C]44[/C][C]-0.068169[/C][C]-0.6679[/C][C]0.252894[/C][/ROW]
[ROW][C]45[/C][C]-0.170038[/C][C]-1.666[/C][C]0.049484[/C][/ROW]
[ROW][C]46[/C][C]-0.103377[/C][C]-1.0129[/C][C]0.156832[/C][/ROW]
[ROW][C]47[/C][C]0.084764[/C][C]0.8305[/C][C]0.204155[/C][/ROW]
[ROW][C]48[/C][C]-0.024823[/C][C]-0.2432[/C][C]0.404181[/C][/ROW]
[/TABLE]
Source: https://freestatistics.org/blog/index.php?pk=79034&T=2

Globally Unique Identifier (entire table): ba.freestatistics.org/blog/index.php?pk=79034&T=2

As an alternative you can also use a QR Code:  

The GUIDs for individual cells are displayed in the table below:

Partial Autocorrelation Function
Time lag kPACF(k)T-STATP-value
10.7515647.36380
20.0296990.2910.385842
3-0.039544-0.38740.349641
40.0912620.89420.186729
50.0791510.77550.219971
6-0.043943-0.43060.333878
70.0657740.64450.260409
8-0.116489-1.14140.128281
9-0.204963-2.00820.023715
10-0.018993-0.18610.426382
110.0578250.56660.286165
12-0.298707-2.92670.002138
130.2191882.14760.017132
140.0232890.22820.409994
15-0.072969-0.71490.238188
16-0.052838-0.51770.302927
17-0.028499-0.27920.390334
180.0203340.19920.421252
190.0117980.11560.454106
200.1108931.08650.139984
21-0.039345-0.38550.350358
22-0.106115-1.03970.150544
23-0.042017-0.41170.340747
24-0.070051-0.68640.247072
250.2391572.34330.01059
260.1017560.9970.160634
27-0.089162-0.87360.192257
28-0.088082-0.8630.195138
290.1758981.72340.044014
30-0.006288-0.06160.475501
31-0.017818-0.17460.430889
32-0.130559-1.27920.101953
33-0.067066-0.65710.25634
34-0.181684-1.78010.039109
35-0.039454-0.38660.349967
36-0.093586-0.91690.180733
370.0829560.81280.209171
380.0059730.05850.476727
390.0241510.23660.406725
40-0.084645-0.82930.204484
410.0149460.14640.441941
42-0.022241-0.21790.413978
43-0.059776-0.58570.279732
44-0.068169-0.66790.252894
45-0.170038-1.6660.049484
46-0.103377-1.01290.156832
470.0847640.83050.204155
48-0.024823-0.24320.404181


Parameters (Session):
par1 = 48 ; par2 = 1 ; par3 = 0 ; par4 = 2 ; par5 = 12 ; par6 = White Noise ; par7 = 0.95 ;
Parameters (R input):
par1 = 48 ; par2 = 1 ; par3 = 0 ; par4 = 2 ; par5 = 12 ; par6 = White Noise ; par7 = 0.95 ;
R code (references can be found in the software module):
if (par1 == 'Default') {
par1 = 10*log10(length(x))
} else {
par1 <- as.numeric(par1)
}
par2 <- as.numeric(par2)
par3 <- as.numeric(par3)
par4 <- as.numeric(par4)
par5 <- as.numeric(par5)
if (par6 == 'White Noise') par6 <- 'white' else par6 <- 'ma'
par7 <- as.numeric(par7)
if (par2 == 0) {
x <- log(x)
} else {
x <- (x ^ par2 - 1) / par2
}
if (par3 > 0) x <- diff(x,lag=1,difference=par3)
if (par4 > 0) x <- diff(x,lag=par5,difference=par4)
bitmap(file='pic1.png')
racf <- acf(x, par1, main='Autocorrelation', xlab='time lag', ylab='ACF', ci.type=par6, ci=par7, sub=paste('(lambda=',par2,', d=',par3,', D=',par4,', CI=', par7, ', CI type=',par6,')',sep=''))
dev.off()
bitmap(file='pic2.png')
rpacf <- pacf(x,par1,main='Partial Autocorrelation',xlab='lags',ylab='PACF')
dev.off()
(myacf <- c(racf$acf))
(mypacf <- c(rpacf$acf))
lengthx <- length(x)
sqrtn <- sqrt(lengthx)
load(file='createtable')
a<-table.start()
a<-table.row.start(a)
a<-table.element(a,'Autocorrelation Function',4,TRUE)
a<-table.row.end(a)
a<-table.row.start(a)
a<-table.element(a,'Time lag k',header=TRUE)
a<-table.element(a,hyperlink('basics.htm','ACF(k)','click here for more information about the Autocorrelation Function'),header=TRUE)
a<-table.element(a,'T-STAT',header=TRUE)
a<-table.element(a,'P-value',header=TRUE)
a<-table.row.end(a)
for (i in 2:(par1+1)) {
a<-table.row.start(a)
a<-table.element(a,i-1,header=TRUE)
a<-table.element(a,round(myacf[i],6))
mytstat <- myacf[i]*sqrtn
a<-table.element(a,round(mytstat,4))
a<-table.element(a,round(1-pt(abs(mytstat),lengthx),6))
a<-table.row.end(a)
}
a<-table.end(a)
table.save(a,file='mytable.tab')
a<-table.start()
a<-table.row.start(a)
a<-table.element(a,'Partial Autocorrelation Function',4,TRUE)
a<-table.row.end(a)
a<-table.row.start(a)
a<-table.element(a,'Time lag k',header=TRUE)
a<-table.element(a,hyperlink('basics.htm','PACF(k)','click here for more information about the Partial Autocorrelation Function'),header=TRUE)
a<-table.element(a,'T-STAT',header=TRUE)
a<-table.element(a,'P-value',header=TRUE)
a<-table.row.end(a)
for (i in 1:par1) {
a<-table.row.start(a)
a<-table.element(a,i,header=TRUE)
a<-table.element(a,round(mypacf[i],6))
mytstat <- mypacf[i]*sqrtn
a<-table.element(a,round(mytstat,4))
a<-table.element(a,round(1-pt(abs(mytstat),lengthx),6))
a<-table.row.end(a)
}
a<-table.end(a)
table.save(a,file='mytable1.tab')