Free Statistics

of Irreproducible Research!

Author's title

Author*Unverified author*
R Software Modulerwasp_autocorrelation.wasp
Title produced by software(Partial) Autocorrelation Function
Date of computationMon, 16 Aug 2010 15:36:59 +0000
Cite this page as followsStatistical Computations at FreeStatistics.org, Office for Research Development and Education, URL https://freestatistics.org/blog/index.php?v=date/2010/Aug/16/t1281973728het7lfx8fmrvesl.htm/, Retrieved Thu, 16 May 2024 13:45:28 +0000
Statistical Computations at FreeStatistics.org, Office for Research Development and Education, URL https://freestatistics.org/blog/index.php?pk=79021, Retrieved Thu, 16 May 2024 13:45:28 +0000
QR Codes:

Original text written by user:
IsPrivate?No (this computation is public)
User-defined keywords
Estimated Impact102
Family? (F = Feedback message, R = changed R code, M = changed R Module, P = changed Parameters, D = changed Data)
-       [(Partial) Autocorrelation Function] [Autocorrelation G...] [2010-08-16 15:36:59] [d41d8cd98f00b204e9800998ecf8427e] [Current]
Feedback Forum

Post a new message
Dataseries X:
257
256
255
253
251
250
251
253
254
254
255
257
260
251
255
252
245
239
240
247
251
255
259
260
259
266
261
243
232
225
229
238
240
241
239
246
242
251
246
219
203
192
197
203
208
207
208
212
208
215
200
170
162
150
148
152
155
150
146
147
142
146
130
102
98
90
86
104
108
94
88
92
93
95
81
50
49
34
27
45
47
42
32


Summary of computational transaction
Raw Inputview raw input (R code)
Raw Outputview raw output of R engine
Computing time2 seconds
R Server'Sir Ronald Aylmer Fisher' @ 193.190.124.24

\begin{tabular}{lllllllll}
\hline
Summary of computational transaction \tabularnewline
Raw Input & view raw input (R code)  \tabularnewline
Raw Output & view raw output of R engine  \tabularnewline
Computing time & 2 seconds \tabularnewline
R Server & 'Sir Ronald Aylmer Fisher' @ 193.190.124.24 \tabularnewline
\hline
\end{tabular}
%Source: https://freestatistics.org/blog/index.php?pk=79021&T=0

[TABLE]
[ROW][C]Summary of computational transaction[/C][/ROW]
[ROW][C]Raw Input[/C][C]view raw input (R code) [/C][/ROW]
[ROW][C]Raw Output[/C][C]view raw output of R engine [/C][/ROW]
[ROW][C]Computing time[/C][C]2 seconds[/C][/ROW]
[ROW][C]R Server[/C][C]'Sir Ronald Aylmer Fisher' @ 193.190.124.24[/C][/ROW]
[/TABLE]
Source: https://freestatistics.org/blog/index.php?pk=79021&T=0

Globally Unique Identifier (entire table): ba.freestatistics.org/blog/index.php?pk=79021&T=0

As an alternative you can also use a QR Code:  

The GUIDs for individual cells are displayed in the table below:

Summary of computational transaction
Raw Inputview raw input (R code)
Raw Outputview raw output of R engine
Computing time2 seconds
R Server'Sir Ronald Aylmer Fisher' @ 193.190.124.24


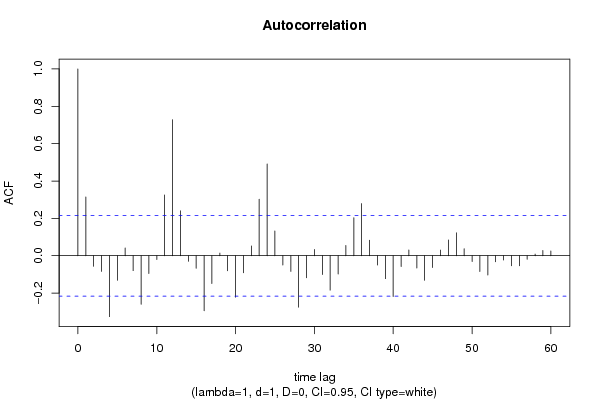
Autocorrelation Function
Time lag kACF(k)T-STATP-value
10.3148452.8510.002755
2-0.05648-0.51150.305205
3-0.083868-0.75950.224877
4-0.3261-2.9530.002052
5-0.131229-1.18830.119068
60.0411930.3730.355048
7-0.079713-0.72180.236225
8-0.259736-2.3520.010535
9-0.095014-0.86040.196041
10-0.020455-0.18520.426755
110.3256192.94860.002079
120.7280626.59290
130.2404742.17760.016155
14-0.030036-0.2720.393156
15-0.066975-0.60650.272933
16-0.29472-2.66880.004587
17-0.148299-1.34290.091504
180.0140690.12740.449469
19-0.080469-0.72870.234138
20-0.221626-2.00690.024027
21-0.091114-0.82510.205862
220.051910.47010.31978
230.302862.74250.003742
240.4910564.44671.4e-05
250.1324131.19910.116981
26-0.049626-0.44940.32717
27-0.083964-0.76030.224619
28-0.275335-2.49330.007335
29-0.118271-1.0710.143658
300.0331640.30030.382349
31-0.100381-0.9090.18301
32-0.184305-1.6690.049471
33-0.097594-0.88370.189708
340.054470.49320.311577
350.2035551.84330.034452
360.279312.52930.006673
370.0833420.75470.226297
38-0.049592-0.44910.327282
39-0.122542-1.10970.135193
40-0.218871-1.9820.025417
41-0.057337-0.51920.302506
420.0309790.28050.389891
43-0.065786-0.59570.276503
44-0.131763-1.19320.118123
45-0.063059-0.5710.284773
460.0300650.27230.393056
470.0841750.76220.224052
480.1225621.10980.135155
490.0379770.34390.365902
50-0.030608-0.27720.391175
51-0.08446-0.76480.223287
52-0.10295-0.93220.176972
53-0.03185-0.28840.386878
54-0.022964-0.2080.417891
55-0.053373-0.48330.315081
56-0.053863-0.48770.313515
57-0.018865-0.17080.432389
580.0087710.07940.468443
590.0285970.2590.398159
600.0257560.23320.408081

\begin{tabular}{lllllllll}
\hline
Autocorrelation Function \tabularnewline
Time lag k & ACF(k) & T-STAT & P-value \tabularnewline
1 & 0.314845 & 2.851 & 0.002755 \tabularnewline
2 & -0.05648 & -0.5115 & 0.305205 \tabularnewline
3 & -0.083868 & -0.7595 & 0.224877 \tabularnewline
4 & -0.3261 & -2.953 & 0.002052 \tabularnewline
5 & -0.131229 & -1.1883 & 0.119068 \tabularnewline
6 & 0.041193 & 0.373 & 0.355048 \tabularnewline
7 & -0.079713 & -0.7218 & 0.236225 \tabularnewline
8 & -0.259736 & -2.352 & 0.010535 \tabularnewline
9 & -0.095014 & -0.8604 & 0.196041 \tabularnewline
10 & -0.020455 & -0.1852 & 0.426755 \tabularnewline
11 & 0.325619 & 2.9486 & 0.002079 \tabularnewline
12 & 0.728062 & 6.5929 & 0 \tabularnewline
13 & 0.240474 & 2.1776 & 0.016155 \tabularnewline
14 & -0.030036 & -0.272 & 0.393156 \tabularnewline
15 & -0.066975 & -0.6065 & 0.272933 \tabularnewline
16 & -0.29472 & -2.6688 & 0.004587 \tabularnewline
17 & -0.148299 & -1.3429 & 0.091504 \tabularnewline
18 & 0.014069 & 0.1274 & 0.449469 \tabularnewline
19 & -0.080469 & -0.7287 & 0.234138 \tabularnewline
20 & -0.221626 & -2.0069 & 0.024027 \tabularnewline
21 & -0.091114 & -0.8251 & 0.205862 \tabularnewline
22 & 0.05191 & 0.4701 & 0.31978 \tabularnewline
23 & 0.30286 & 2.7425 & 0.003742 \tabularnewline
24 & 0.491056 & 4.4467 & 1.4e-05 \tabularnewline
25 & 0.132413 & 1.1991 & 0.116981 \tabularnewline
26 & -0.049626 & -0.4494 & 0.32717 \tabularnewline
27 & -0.083964 & -0.7603 & 0.224619 \tabularnewline
28 & -0.275335 & -2.4933 & 0.007335 \tabularnewline
29 & -0.118271 & -1.071 & 0.143658 \tabularnewline
30 & 0.033164 & 0.3003 & 0.382349 \tabularnewline
31 & -0.100381 & -0.909 & 0.18301 \tabularnewline
32 & -0.184305 & -1.669 & 0.049471 \tabularnewline
33 & -0.097594 & -0.8837 & 0.189708 \tabularnewline
34 & 0.05447 & 0.4932 & 0.311577 \tabularnewline
35 & 0.203555 & 1.8433 & 0.034452 \tabularnewline
36 & 0.27931 & 2.5293 & 0.006673 \tabularnewline
37 & 0.083342 & 0.7547 & 0.226297 \tabularnewline
38 & -0.049592 & -0.4491 & 0.327282 \tabularnewline
39 & -0.122542 & -1.1097 & 0.135193 \tabularnewline
40 & -0.218871 & -1.982 & 0.025417 \tabularnewline
41 & -0.057337 & -0.5192 & 0.302506 \tabularnewline
42 & 0.030979 & 0.2805 & 0.389891 \tabularnewline
43 & -0.065786 & -0.5957 & 0.276503 \tabularnewline
44 & -0.131763 & -1.1932 & 0.118123 \tabularnewline
45 & -0.063059 & -0.571 & 0.284773 \tabularnewline
46 & 0.030065 & 0.2723 & 0.393056 \tabularnewline
47 & 0.084175 & 0.7622 & 0.224052 \tabularnewline
48 & 0.122562 & 1.1098 & 0.135155 \tabularnewline
49 & 0.037977 & 0.3439 & 0.365902 \tabularnewline
50 & -0.030608 & -0.2772 & 0.391175 \tabularnewline
51 & -0.08446 & -0.7648 & 0.223287 \tabularnewline
52 & -0.10295 & -0.9322 & 0.176972 \tabularnewline
53 & -0.03185 & -0.2884 & 0.386878 \tabularnewline
54 & -0.022964 & -0.208 & 0.417891 \tabularnewline
55 & -0.053373 & -0.4833 & 0.315081 \tabularnewline
56 & -0.053863 & -0.4877 & 0.313515 \tabularnewline
57 & -0.018865 & -0.1708 & 0.432389 \tabularnewline
58 & 0.008771 & 0.0794 & 0.468443 \tabularnewline
59 & 0.028597 & 0.259 & 0.398159 \tabularnewline
60 & 0.025756 & 0.2332 & 0.408081 \tabularnewline
\hline
\end{tabular}
%Source: https://freestatistics.org/blog/index.php?pk=79021&T=1

[TABLE]
[ROW][C]Autocorrelation Function[/C][/ROW]
[ROW][C]Time lag k[/C][C]ACF(k)[/C][C]T-STAT[/C][C]P-value[/C][/ROW]
[ROW][C]1[/C][C]0.314845[/C][C]2.851[/C][C]0.002755[/C][/ROW]
[ROW][C]2[/C][C]-0.05648[/C][C]-0.5115[/C][C]0.305205[/C][/ROW]
[ROW][C]3[/C][C]-0.083868[/C][C]-0.7595[/C][C]0.224877[/C][/ROW]
[ROW][C]4[/C][C]-0.3261[/C][C]-2.953[/C][C]0.002052[/C][/ROW]
[ROW][C]5[/C][C]-0.131229[/C][C]-1.1883[/C][C]0.119068[/C][/ROW]
[ROW][C]6[/C][C]0.041193[/C][C]0.373[/C][C]0.355048[/C][/ROW]
[ROW][C]7[/C][C]-0.079713[/C][C]-0.7218[/C][C]0.236225[/C][/ROW]
[ROW][C]8[/C][C]-0.259736[/C][C]-2.352[/C][C]0.010535[/C][/ROW]
[ROW][C]9[/C][C]-0.095014[/C][C]-0.8604[/C][C]0.196041[/C][/ROW]
[ROW][C]10[/C][C]-0.020455[/C][C]-0.1852[/C][C]0.426755[/C][/ROW]
[ROW][C]11[/C][C]0.325619[/C][C]2.9486[/C][C]0.002079[/C][/ROW]
[ROW][C]12[/C][C]0.728062[/C][C]6.5929[/C][C]0[/C][/ROW]
[ROW][C]13[/C][C]0.240474[/C][C]2.1776[/C][C]0.016155[/C][/ROW]
[ROW][C]14[/C][C]-0.030036[/C][C]-0.272[/C][C]0.393156[/C][/ROW]
[ROW][C]15[/C][C]-0.066975[/C][C]-0.6065[/C][C]0.272933[/C][/ROW]
[ROW][C]16[/C][C]-0.29472[/C][C]-2.6688[/C][C]0.004587[/C][/ROW]
[ROW][C]17[/C][C]-0.148299[/C][C]-1.3429[/C][C]0.091504[/C][/ROW]
[ROW][C]18[/C][C]0.014069[/C][C]0.1274[/C][C]0.449469[/C][/ROW]
[ROW][C]19[/C][C]-0.080469[/C][C]-0.7287[/C][C]0.234138[/C][/ROW]
[ROW][C]20[/C][C]-0.221626[/C][C]-2.0069[/C][C]0.024027[/C][/ROW]
[ROW][C]21[/C][C]-0.091114[/C][C]-0.8251[/C][C]0.205862[/C][/ROW]
[ROW][C]22[/C][C]0.05191[/C][C]0.4701[/C][C]0.31978[/C][/ROW]
[ROW][C]23[/C][C]0.30286[/C][C]2.7425[/C][C]0.003742[/C][/ROW]
[ROW][C]24[/C][C]0.491056[/C][C]4.4467[/C][C]1.4e-05[/C][/ROW]
[ROW][C]25[/C][C]0.132413[/C][C]1.1991[/C][C]0.116981[/C][/ROW]
[ROW][C]26[/C][C]-0.049626[/C][C]-0.4494[/C][C]0.32717[/C][/ROW]
[ROW][C]27[/C][C]-0.083964[/C][C]-0.7603[/C][C]0.224619[/C][/ROW]
[ROW][C]28[/C][C]-0.275335[/C][C]-2.4933[/C][C]0.007335[/C][/ROW]
[ROW][C]29[/C][C]-0.118271[/C][C]-1.071[/C][C]0.143658[/C][/ROW]
[ROW][C]30[/C][C]0.033164[/C][C]0.3003[/C][C]0.382349[/C][/ROW]
[ROW][C]31[/C][C]-0.100381[/C][C]-0.909[/C][C]0.18301[/C][/ROW]
[ROW][C]32[/C][C]-0.184305[/C][C]-1.669[/C][C]0.049471[/C][/ROW]
[ROW][C]33[/C][C]-0.097594[/C][C]-0.8837[/C][C]0.189708[/C][/ROW]
[ROW][C]34[/C][C]0.05447[/C][C]0.4932[/C][C]0.311577[/C][/ROW]
[ROW][C]35[/C][C]0.203555[/C][C]1.8433[/C][C]0.034452[/C][/ROW]
[ROW][C]36[/C][C]0.27931[/C][C]2.5293[/C][C]0.006673[/C][/ROW]
[ROW][C]37[/C][C]0.083342[/C][C]0.7547[/C][C]0.226297[/C][/ROW]
[ROW][C]38[/C][C]-0.049592[/C][C]-0.4491[/C][C]0.327282[/C][/ROW]
[ROW][C]39[/C][C]-0.122542[/C][C]-1.1097[/C][C]0.135193[/C][/ROW]
[ROW][C]40[/C][C]-0.218871[/C][C]-1.982[/C][C]0.025417[/C][/ROW]
[ROW][C]41[/C][C]-0.057337[/C][C]-0.5192[/C][C]0.302506[/C][/ROW]
[ROW][C]42[/C][C]0.030979[/C][C]0.2805[/C][C]0.389891[/C][/ROW]
[ROW][C]43[/C][C]-0.065786[/C][C]-0.5957[/C][C]0.276503[/C][/ROW]
[ROW][C]44[/C][C]-0.131763[/C][C]-1.1932[/C][C]0.118123[/C][/ROW]
[ROW][C]45[/C][C]-0.063059[/C][C]-0.571[/C][C]0.284773[/C][/ROW]
[ROW][C]46[/C][C]0.030065[/C][C]0.2723[/C][C]0.393056[/C][/ROW]
[ROW][C]47[/C][C]0.084175[/C][C]0.7622[/C][C]0.224052[/C][/ROW]
[ROW][C]48[/C][C]0.122562[/C][C]1.1098[/C][C]0.135155[/C][/ROW]
[ROW][C]49[/C][C]0.037977[/C][C]0.3439[/C][C]0.365902[/C][/ROW]
[ROW][C]50[/C][C]-0.030608[/C][C]-0.2772[/C][C]0.391175[/C][/ROW]
[ROW][C]51[/C][C]-0.08446[/C][C]-0.7648[/C][C]0.223287[/C][/ROW]
[ROW][C]52[/C][C]-0.10295[/C][C]-0.9322[/C][C]0.176972[/C][/ROW]
[ROW][C]53[/C][C]-0.03185[/C][C]-0.2884[/C][C]0.386878[/C][/ROW]
[ROW][C]54[/C][C]-0.022964[/C][C]-0.208[/C][C]0.417891[/C][/ROW]
[ROW][C]55[/C][C]-0.053373[/C][C]-0.4833[/C][C]0.315081[/C][/ROW]
[ROW][C]56[/C][C]-0.053863[/C][C]-0.4877[/C][C]0.313515[/C][/ROW]
[ROW][C]57[/C][C]-0.018865[/C][C]-0.1708[/C][C]0.432389[/C][/ROW]
[ROW][C]58[/C][C]0.008771[/C][C]0.0794[/C][C]0.468443[/C][/ROW]
[ROW][C]59[/C][C]0.028597[/C][C]0.259[/C][C]0.398159[/C][/ROW]
[ROW][C]60[/C][C]0.025756[/C][C]0.2332[/C][C]0.408081[/C][/ROW]
[/TABLE]
Source: https://freestatistics.org/blog/index.php?pk=79021&T=1

Globally Unique Identifier (entire table): ba.freestatistics.org/blog/index.php?pk=79021&T=1

As an alternative you can also use a QR Code:  

The GUIDs for individual cells are displayed in the table below:

Autocorrelation Function
Time lag kACF(k)T-STATP-value
10.3148452.8510.002755
2-0.05648-0.51150.305205
3-0.083868-0.75950.224877
4-0.3261-2.9530.002052
5-0.131229-1.18830.119068
60.0411930.3730.355048
7-0.079713-0.72180.236225
8-0.259736-2.3520.010535
9-0.095014-0.86040.196041
10-0.020455-0.18520.426755
110.3256192.94860.002079
120.7280626.59290
130.2404742.17760.016155
14-0.030036-0.2720.393156
15-0.066975-0.60650.272933
16-0.29472-2.66880.004587
17-0.148299-1.34290.091504
180.0140690.12740.449469
19-0.080469-0.72870.234138
20-0.221626-2.00690.024027
21-0.091114-0.82510.205862
220.051910.47010.31978
230.302862.74250.003742
240.4910564.44671.4e-05
250.1324131.19910.116981
26-0.049626-0.44940.32717
27-0.083964-0.76030.224619
28-0.275335-2.49330.007335
29-0.118271-1.0710.143658
300.0331640.30030.382349
31-0.100381-0.9090.18301
32-0.184305-1.6690.049471
33-0.097594-0.88370.189708
340.054470.49320.311577
350.2035551.84330.034452
360.279312.52930.006673
370.0833420.75470.226297
38-0.049592-0.44910.327282
39-0.122542-1.10970.135193
40-0.218871-1.9820.025417
41-0.057337-0.51920.302506
420.0309790.28050.389891
43-0.065786-0.59570.276503
44-0.131763-1.19320.118123
45-0.063059-0.5710.284773
460.0300650.27230.393056
470.0841750.76220.224052
480.1225621.10980.135155
490.0379770.34390.365902
50-0.030608-0.27720.391175
51-0.08446-0.76480.223287
52-0.10295-0.93220.176972
53-0.03185-0.28840.386878
54-0.022964-0.2080.417891
55-0.053373-0.48330.315081
56-0.053863-0.48770.313515
57-0.018865-0.17080.432389
580.0087710.07940.468443
590.0285970.2590.398159
600.0257560.23320.408081


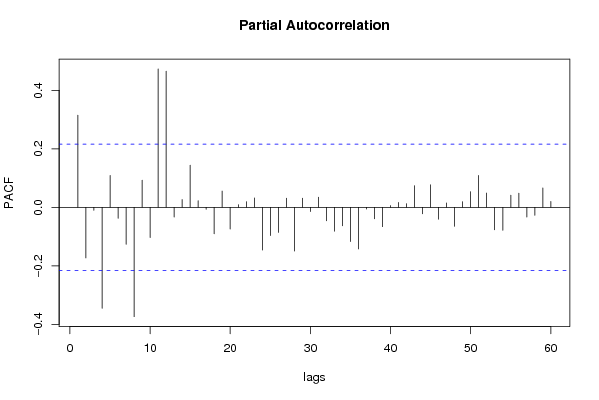
Partial Autocorrelation Function
Time lag kPACF(k)T-STATP-value
10.3148452.8510.002755
2-0.17273-1.56410.060818
3-0.009875-0.08940.464481
4-0.34525-3.12640.001224
50.1087920.98520.163724
6-0.037499-0.33960.367526
7-0.126536-1.14580.127598
8-0.373607-3.38320.00055
90.0925480.83810.202218
10-0.103388-0.93620.175956
110.4730284.28342.5e-05
120.4650644.21133.2e-05
13-0.033267-0.30120.381994
140.0265550.24050.405285
150.1441071.30490.097782
160.0226310.20490.419066
17-0.006508-0.05890.476574
18-0.090668-0.8210.207003
190.0554610.50220.308428
20-0.074147-0.67140.251918
210.0092930.08410.466572
220.019030.17230.431803
230.0322630.29220.385452
24-0.145762-1.31990.095266
25-0.096416-0.87310.192584
26-0.0856-0.77510.220243
270.0312510.2830.38895
28-0.149416-1.3530.089885
290.0313440.28380.388628
30-0.014508-0.13140.447901
310.0344890.31230.3778
32-0.046139-0.41780.338589
33-0.081319-0.73640.231803
34-0.063092-0.57130.284673
35-0.117071-1.06010.146101
36-0.142088-1.28670.100916
37-0.006024-0.05450.478316
38-0.038805-0.35140.363096
39-0.065905-0.59680.276143
400.0059070.05350.478736
410.0167810.1520.439798
420.0125380.11350.454941
430.0737020.66740.253195
44-0.022149-0.20060.420768
450.0769210.69650.244027
46-0.040287-0.36480.358096
470.015220.13780.445359
48-0.064839-0.58710.279362
490.0190040.17210.431898
500.0534710.48420.314766
510.1087360.98460.163847
520.0486540.44060.330337
53-0.076652-0.69410.244787
54-0.078323-0.70920.240093
550.0413630.37460.354477
560.0484680.43890.330947
57-0.033164-0.30030.38235
58-0.026872-0.24330.404178
590.0664390.60160.274539
600.0203440.18420.427147

\begin{tabular}{lllllllll}
\hline
Partial Autocorrelation Function \tabularnewline
Time lag k & PACF(k) & T-STAT & P-value \tabularnewline
1 & 0.314845 & 2.851 & 0.002755 \tabularnewline
2 & -0.17273 & -1.5641 & 0.060818 \tabularnewline
3 & -0.009875 & -0.0894 & 0.464481 \tabularnewline
4 & -0.34525 & -3.1264 & 0.001224 \tabularnewline
5 & 0.108792 & 0.9852 & 0.163724 \tabularnewline
6 & -0.037499 & -0.3396 & 0.367526 \tabularnewline
7 & -0.126536 & -1.1458 & 0.127598 \tabularnewline
8 & -0.373607 & -3.3832 & 0.00055 \tabularnewline
9 & 0.092548 & 0.8381 & 0.202218 \tabularnewline
10 & -0.103388 & -0.9362 & 0.175956 \tabularnewline
11 & 0.473028 & 4.2834 & 2.5e-05 \tabularnewline
12 & 0.465064 & 4.2113 & 3.2e-05 \tabularnewline
13 & -0.033267 & -0.3012 & 0.381994 \tabularnewline
14 & 0.026555 & 0.2405 & 0.405285 \tabularnewline
15 & 0.144107 & 1.3049 & 0.097782 \tabularnewline
16 & 0.022631 & 0.2049 & 0.419066 \tabularnewline
17 & -0.006508 & -0.0589 & 0.476574 \tabularnewline
18 & -0.090668 & -0.821 & 0.207003 \tabularnewline
19 & 0.055461 & 0.5022 & 0.308428 \tabularnewline
20 & -0.074147 & -0.6714 & 0.251918 \tabularnewline
21 & 0.009293 & 0.0841 & 0.466572 \tabularnewline
22 & 0.01903 & 0.1723 & 0.431803 \tabularnewline
23 & 0.032263 & 0.2922 & 0.385452 \tabularnewline
24 & -0.145762 & -1.3199 & 0.095266 \tabularnewline
25 & -0.096416 & -0.8731 & 0.192584 \tabularnewline
26 & -0.0856 & -0.7751 & 0.220243 \tabularnewline
27 & 0.031251 & 0.283 & 0.38895 \tabularnewline
28 & -0.149416 & -1.353 & 0.089885 \tabularnewline
29 & 0.031344 & 0.2838 & 0.388628 \tabularnewline
30 & -0.014508 & -0.1314 & 0.447901 \tabularnewline
31 & 0.034489 & 0.3123 & 0.3778 \tabularnewline
32 & -0.046139 & -0.4178 & 0.338589 \tabularnewline
33 & -0.081319 & -0.7364 & 0.231803 \tabularnewline
34 & -0.063092 & -0.5713 & 0.284673 \tabularnewline
35 & -0.117071 & -1.0601 & 0.146101 \tabularnewline
36 & -0.142088 & -1.2867 & 0.100916 \tabularnewline
37 & -0.006024 & -0.0545 & 0.478316 \tabularnewline
38 & -0.038805 & -0.3514 & 0.363096 \tabularnewline
39 & -0.065905 & -0.5968 & 0.276143 \tabularnewline
40 & 0.005907 & 0.0535 & 0.478736 \tabularnewline
41 & 0.016781 & 0.152 & 0.439798 \tabularnewline
42 & 0.012538 & 0.1135 & 0.454941 \tabularnewline
43 & 0.073702 & 0.6674 & 0.253195 \tabularnewline
44 & -0.022149 & -0.2006 & 0.420768 \tabularnewline
45 & 0.076921 & 0.6965 & 0.244027 \tabularnewline
46 & -0.040287 & -0.3648 & 0.358096 \tabularnewline
47 & 0.01522 & 0.1378 & 0.445359 \tabularnewline
48 & -0.064839 & -0.5871 & 0.279362 \tabularnewline
49 & 0.019004 & 0.1721 & 0.431898 \tabularnewline
50 & 0.053471 & 0.4842 & 0.314766 \tabularnewline
51 & 0.108736 & 0.9846 & 0.163847 \tabularnewline
52 & 0.048654 & 0.4406 & 0.330337 \tabularnewline
53 & -0.076652 & -0.6941 & 0.244787 \tabularnewline
54 & -0.078323 & -0.7092 & 0.240093 \tabularnewline
55 & 0.041363 & 0.3746 & 0.354477 \tabularnewline
56 & 0.048468 & 0.4389 & 0.330947 \tabularnewline
57 & -0.033164 & -0.3003 & 0.38235 \tabularnewline
58 & -0.026872 & -0.2433 & 0.404178 \tabularnewline
59 & 0.066439 & 0.6016 & 0.274539 \tabularnewline
60 & 0.020344 & 0.1842 & 0.427147 \tabularnewline
\hline
\end{tabular}
%Source: https://freestatistics.org/blog/index.php?pk=79021&T=2

[TABLE]
[ROW][C]Partial Autocorrelation Function[/C][/ROW]
[ROW][C]Time lag k[/C][C]PACF(k)[/C][C]T-STAT[/C][C]P-value[/C][/ROW]
[ROW][C]1[/C][C]0.314845[/C][C]2.851[/C][C]0.002755[/C][/ROW]
[ROW][C]2[/C][C]-0.17273[/C][C]-1.5641[/C][C]0.060818[/C][/ROW]
[ROW][C]3[/C][C]-0.009875[/C][C]-0.0894[/C][C]0.464481[/C][/ROW]
[ROW][C]4[/C][C]-0.34525[/C][C]-3.1264[/C][C]0.001224[/C][/ROW]
[ROW][C]5[/C][C]0.108792[/C][C]0.9852[/C][C]0.163724[/C][/ROW]
[ROW][C]6[/C][C]-0.037499[/C][C]-0.3396[/C][C]0.367526[/C][/ROW]
[ROW][C]7[/C][C]-0.126536[/C][C]-1.1458[/C][C]0.127598[/C][/ROW]
[ROW][C]8[/C][C]-0.373607[/C][C]-3.3832[/C][C]0.00055[/C][/ROW]
[ROW][C]9[/C][C]0.092548[/C][C]0.8381[/C][C]0.202218[/C][/ROW]
[ROW][C]10[/C][C]-0.103388[/C][C]-0.9362[/C][C]0.175956[/C][/ROW]
[ROW][C]11[/C][C]0.473028[/C][C]4.2834[/C][C]2.5e-05[/C][/ROW]
[ROW][C]12[/C][C]0.465064[/C][C]4.2113[/C][C]3.2e-05[/C][/ROW]
[ROW][C]13[/C][C]-0.033267[/C][C]-0.3012[/C][C]0.381994[/C][/ROW]
[ROW][C]14[/C][C]0.026555[/C][C]0.2405[/C][C]0.405285[/C][/ROW]
[ROW][C]15[/C][C]0.144107[/C][C]1.3049[/C][C]0.097782[/C][/ROW]
[ROW][C]16[/C][C]0.022631[/C][C]0.2049[/C][C]0.419066[/C][/ROW]
[ROW][C]17[/C][C]-0.006508[/C][C]-0.0589[/C][C]0.476574[/C][/ROW]
[ROW][C]18[/C][C]-0.090668[/C][C]-0.821[/C][C]0.207003[/C][/ROW]
[ROW][C]19[/C][C]0.055461[/C][C]0.5022[/C][C]0.308428[/C][/ROW]
[ROW][C]20[/C][C]-0.074147[/C][C]-0.6714[/C][C]0.251918[/C][/ROW]
[ROW][C]21[/C][C]0.009293[/C][C]0.0841[/C][C]0.466572[/C][/ROW]
[ROW][C]22[/C][C]0.01903[/C][C]0.1723[/C][C]0.431803[/C][/ROW]
[ROW][C]23[/C][C]0.032263[/C][C]0.2922[/C][C]0.385452[/C][/ROW]
[ROW][C]24[/C][C]-0.145762[/C][C]-1.3199[/C][C]0.095266[/C][/ROW]
[ROW][C]25[/C][C]-0.096416[/C][C]-0.8731[/C][C]0.192584[/C][/ROW]
[ROW][C]26[/C][C]-0.0856[/C][C]-0.7751[/C][C]0.220243[/C][/ROW]
[ROW][C]27[/C][C]0.031251[/C][C]0.283[/C][C]0.38895[/C][/ROW]
[ROW][C]28[/C][C]-0.149416[/C][C]-1.353[/C][C]0.089885[/C][/ROW]
[ROW][C]29[/C][C]0.031344[/C][C]0.2838[/C][C]0.388628[/C][/ROW]
[ROW][C]30[/C][C]-0.014508[/C][C]-0.1314[/C][C]0.447901[/C][/ROW]
[ROW][C]31[/C][C]0.034489[/C][C]0.3123[/C][C]0.3778[/C][/ROW]
[ROW][C]32[/C][C]-0.046139[/C][C]-0.4178[/C][C]0.338589[/C][/ROW]
[ROW][C]33[/C][C]-0.081319[/C][C]-0.7364[/C][C]0.231803[/C][/ROW]
[ROW][C]34[/C][C]-0.063092[/C][C]-0.5713[/C][C]0.284673[/C][/ROW]
[ROW][C]35[/C][C]-0.117071[/C][C]-1.0601[/C][C]0.146101[/C][/ROW]
[ROW][C]36[/C][C]-0.142088[/C][C]-1.2867[/C][C]0.100916[/C][/ROW]
[ROW][C]37[/C][C]-0.006024[/C][C]-0.0545[/C][C]0.478316[/C][/ROW]
[ROW][C]38[/C][C]-0.038805[/C][C]-0.3514[/C][C]0.363096[/C][/ROW]
[ROW][C]39[/C][C]-0.065905[/C][C]-0.5968[/C][C]0.276143[/C][/ROW]
[ROW][C]40[/C][C]0.005907[/C][C]0.0535[/C][C]0.478736[/C][/ROW]
[ROW][C]41[/C][C]0.016781[/C][C]0.152[/C][C]0.439798[/C][/ROW]
[ROW][C]42[/C][C]0.012538[/C][C]0.1135[/C][C]0.454941[/C][/ROW]
[ROW][C]43[/C][C]0.073702[/C][C]0.6674[/C][C]0.253195[/C][/ROW]
[ROW][C]44[/C][C]-0.022149[/C][C]-0.2006[/C][C]0.420768[/C][/ROW]
[ROW][C]45[/C][C]0.076921[/C][C]0.6965[/C][C]0.244027[/C][/ROW]
[ROW][C]46[/C][C]-0.040287[/C][C]-0.3648[/C][C]0.358096[/C][/ROW]
[ROW][C]47[/C][C]0.01522[/C][C]0.1378[/C][C]0.445359[/C][/ROW]
[ROW][C]48[/C][C]-0.064839[/C][C]-0.5871[/C][C]0.279362[/C][/ROW]
[ROW][C]49[/C][C]0.019004[/C][C]0.1721[/C][C]0.431898[/C][/ROW]
[ROW][C]50[/C][C]0.053471[/C][C]0.4842[/C][C]0.314766[/C][/ROW]
[ROW][C]51[/C][C]0.108736[/C][C]0.9846[/C][C]0.163847[/C][/ROW]
[ROW][C]52[/C][C]0.048654[/C][C]0.4406[/C][C]0.330337[/C][/ROW]
[ROW][C]53[/C][C]-0.076652[/C][C]-0.6941[/C][C]0.244787[/C][/ROW]
[ROW][C]54[/C][C]-0.078323[/C][C]-0.7092[/C][C]0.240093[/C][/ROW]
[ROW][C]55[/C][C]0.041363[/C][C]0.3746[/C][C]0.354477[/C][/ROW]
[ROW][C]56[/C][C]0.048468[/C][C]0.4389[/C][C]0.330947[/C][/ROW]
[ROW][C]57[/C][C]-0.033164[/C][C]-0.3003[/C][C]0.38235[/C][/ROW]
[ROW][C]58[/C][C]-0.026872[/C][C]-0.2433[/C][C]0.404178[/C][/ROW]
[ROW][C]59[/C][C]0.066439[/C][C]0.6016[/C][C]0.274539[/C][/ROW]
[ROW][C]60[/C][C]0.020344[/C][C]0.1842[/C][C]0.427147[/C][/ROW]
[/TABLE]
Source: https://freestatistics.org/blog/index.php?pk=79021&T=2

Globally Unique Identifier (entire table): ba.freestatistics.org/blog/index.php?pk=79021&T=2

As an alternative you can also use a QR Code:  

The GUIDs for individual cells are displayed in the table below:

Partial Autocorrelation Function
Time lag kPACF(k)T-STATP-value
10.3148452.8510.002755
2-0.17273-1.56410.060818
3-0.009875-0.08940.464481
4-0.34525-3.12640.001224
50.1087920.98520.163724
6-0.037499-0.33960.367526
7-0.126536-1.14580.127598
8-0.373607-3.38320.00055
90.0925480.83810.202218
10-0.103388-0.93620.175956
110.4730284.28342.5e-05
120.4650644.21133.2e-05
13-0.033267-0.30120.381994
140.0265550.24050.405285
150.1441071.30490.097782
160.0226310.20490.419066
17-0.006508-0.05890.476574
18-0.090668-0.8210.207003
190.0554610.50220.308428
20-0.074147-0.67140.251918
210.0092930.08410.466572
220.019030.17230.431803
230.0322630.29220.385452
24-0.145762-1.31990.095266
25-0.096416-0.87310.192584
26-0.0856-0.77510.220243
270.0312510.2830.38895
28-0.149416-1.3530.089885
290.0313440.28380.388628
30-0.014508-0.13140.447901
310.0344890.31230.3778
32-0.046139-0.41780.338589
33-0.081319-0.73640.231803
34-0.063092-0.57130.284673
35-0.117071-1.06010.146101
36-0.142088-1.28670.100916
37-0.006024-0.05450.478316
38-0.038805-0.35140.363096
39-0.065905-0.59680.276143
400.0059070.05350.478736
410.0167810.1520.439798
420.0125380.11350.454941
430.0737020.66740.253195
44-0.022149-0.20060.420768
450.0769210.69650.244027
46-0.040287-0.36480.358096
470.015220.13780.445359
48-0.064839-0.58710.279362
490.0190040.17210.431898
500.0534710.48420.314766
510.1087360.98460.163847
520.0486540.44060.330337
53-0.076652-0.69410.244787
54-0.078323-0.70920.240093
550.0413630.37460.354477
560.0484680.43890.330947
57-0.033164-0.30030.38235
58-0.026872-0.24330.404178
590.0664390.60160.274539
600.0203440.18420.427147


Parameters (Session):
par1 = 0.1 ; par2 = 0.9 ; par3 = 0.1 ;
Parameters (R input):
par1 = 60 ; par2 = 1 ; par3 = 1 ; par4 = 0 ; par5 = 12 ; par6 = White Noise ; par7 = 0.95 ;
R code (references can be found in the software module):
if (par1 == 'Default') {
par1 = 10*log10(length(x))
} else {
par1 <- as.numeric(par1)
}
par2 <- as.numeric(par2)
par3 <- as.numeric(par3)
par4 <- as.numeric(par4)
par5 <- as.numeric(par5)
if (par6 == 'White Noise') par6 <- 'white' else par6 <- 'ma'
par7 <- as.numeric(par7)
if (par2 == 0) {
x <- log(x)
} else {
x <- (x ^ par2 - 1) / par2
}
if (par3 > 0) x <- diff(x,lag=1,difference=par3)
if (par4 > 0) x <- diff(x,lag=par5,difference=par4)
bitmap(file='pic1.png')
racf <- acf(x, par1, main='Autocorrelation', xlab='time lag', ylab='ACF', ci.type=par6, ci=par7, sub=paste('(lambda=',par2,', d=',par3,', D=',par4,', CI=', par7, ', CI type=',par6,')',sep=''))
dev.off()
bitmap(file='pic2.png')
rpacf <- pacf(x,par1,main='Partial Autocorrelation',xlab='lags',ylab='PACF')
dev.off()
(myacf <- c(racf$acf))
(mypacf <- c(rpacf$acf))
lengthx <- length(x)
sqrtn <- sqrt(lengthx)
load(file='createtable')
a<-table.start()
a<-table.row.start(a)
a<-table.element(a,'Autocorrelation Function',4,TRUE)
a<-table.row.end(a)
a<-table.row.start(a)
a<-table.element(a,'Time lag k',header=TRUE)
a<-table.element(a,hyperlink('basics.htm','ACF(k)','click here for more information about the Autocorrelation Function'),header=TRUE)
a<-table.element(a,'T-STAT',header=TRUE)
a<-table.element(a,'P-value',header=TRUE)
a<-table.row.end(a)
for (i in 2:(par1+1)) {
a<-table.row.start(a)
a<-table.element(a,i-1,header=TRUE)
a<-table.element(a,round(myacf[i],6))
mytstat <- myacf[i]*sqrtn
a<-table.element(a,round(mytstat,4))
a<-table.element(a,round(1-pt(abs(mytstat),lengthx),6))
a<-table.row.end(a)
}
a<-table.end(a)
table.save(a,file='mytable.tab')
a<-table.start()
a<-table.row.start(a)
a<-table.element(a,'Partial Autocorrelation Function',4,TRUE)
a<-table.row.end(a)
a<-table.row.start(a)
a<-table.element(a,'Time lag k',header=TRUE)
a<-table.element(a,hyperlink('basics.htm','PACF(k)','click here for more information about the Partial Autocorrelation Function'),header=TRUE)
a<-table.element(a,'T-STAT',header=TRUE)
a<-table.element(a,'P-value',header=TRUE)
a<-table.row.end(a)
for (i in 1:par1) {
a<-table.row.start(a)
a<-table.element(a,i,header=TRUE)
a<-table.element(a,round(mypacf[i],6))
mytstat <- mypacf[i]*sqrtn
a<-table.element(a,round(mytstat,4))
a<-table.element(a,round(1-pt(abs(mytstat),lengthx),6))
a<-table.row.end(a)
}
a<-table.end(a)
table.save(a,file='mytable1.tab')