Free Statistics

of Irreproducible Research!

Author's title

Author*Unverified author*
R Software Modulerwasp_autocorrelation.wasp
Title produced by software(Partial) Autocorrelation Function
Date of computationMon, 16 Aug 2010 15:21:52 +0000
Cite this page as followsStatistical Computations at FreeStatistics.org, Office for Research Development and Education, URL https://freestatistics.org/blog/index.php?v=date/2010/Aug/16/t12819720722i4bqj0ckd88u0v.htm/, Retrieved Thu, 16 May 2024 12:02:44 +0000
Statistical Computations at FreeStatistics.org, Office for Research Development and Education, URL https://freestatistics.org/blog/index.php?pk=79018, Retrieved Thu, 16 May 2024 12:02:44 +0000
QR Codes:

Original text written by user:
IsPrivate?No (this computation is public)
User-defined keywords
Estimated Impact104
Family? (F = Feedback message, R = changed R code, M = changed R Module, P = changed Parameters, D = changed Data)
-       [(Partial) Autocorrelation Function] [Autocorrelation] [2010-08-16 15:21:52] [d41d8cd98f00b204e9800998ecf8427e] [Current]
Feedback Forum

Post a new message
Dataseries X:
257
256
255
253
251
250
251
253
254
254
255
257
260
251
255
252
245
239
240
247
251
255
259
260
259
266
261
243
232
225
229
238
240
241
239
246
242
251
246
219
203
192
197
203
208
207
208
212
208
215
200
170
162
150
148
152
155
150
146
147
142
146
130
102
98
90
86
104
108
94
88
92
93
95
81
50
49
34
27
45
47
42
32


Summary of computational transaction
Raw Inputview raw input (R code)
Raw Outputview raw output of R engine
Computing time2 seconds
R Server'RServer@AstonUniversity' @ vre.aston.ac.uk

\begin{tabular}{lllllllll}
\hline
Summary of computational transaction \tabularnewline
Raw Input & view raw input (R code)  \tabularnewline
Raw Output & view raw output of R engine  \tabularnewline
Computing time & 2 seconds \tabularnewline
R Server & 'RServer@AstonUniversity' @ vre.aston.ac.uk \tabularnewline
\hline
\end{tabular}
%Source: https://freestatistics.org/blog/index.php?pk=79018&T=0

[TABLE]
[ROW][C]Summary of computational transaction[/C][/ROW]
[ROW][C]Raw Input[/C][C]view raw input (R code) [/C][/ROW]
[ROW][C]Raw Output[/C][C]view raw output of R engine [/C][/ROW]
[ROW][C]Computing time[/C][C]2 seconds[/C][/ROW]
[ROW][C]R Server[/C][C]'RServer@AstonUniversity' @ vre.aston.ac.uk[/C][/ROW]
[/TABLE]
Source: https://freestatistics.org/blog/index.php?pk=79018&T=0

Globally Unique Identifier (entire table): ba.freestatistics.org/blog/index.php?pk=79018&T=0

As an alternative you can also use a QR Code:  

The GUIDs for individual cells are displayed in the table below:

Summary of computational transaction
Raw Inputview raw input (R code)
Raw Outputview raw output of R engine
Computing time2 seconds
R Server'RServer@AstonUniversity' @ vre.aston.ac.uk


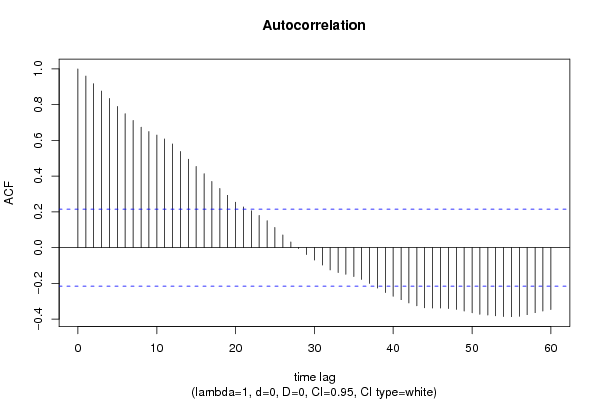
Autocorrelation Function
Time lag kACF(k)T-STATP-value
10.9598868.7450
20.9172288.35630
30.8759957.98070
40.8343587.60140
50.790447.20120
60.7496686.82980
70.7118986.48570
80.6740216.14060
90.6493235.91560
100.6297285.73710
110.6084575.54330
120.5803885.28760
130.5381584.90282e-06
140.4945534.50561.1e-05
150.4544234.144.1e-05
160.4132733.76510.000155
170.3703433.3740.000564
180.3307873.01360.001711
190.2924252.66410.004636
200.2543572.31730.011475
210.2275112.07270.02065
220.2058671.87550.032118
230.1803651.64320.052062
240.1507311.37320.086691
250.112351.02360.154509
260.0710980.64770.259471
270.0320140.29170.385635
28-0.004992-0.04550.481917
29-0.038421-0.350.363602
30-0.069207-0.63050.265049
31-0.097942-0.89230.187408
32-0.124763-1.13660.12948
33-0.139642-1.27220.103427
34-0.148788-1.35550.089464
35-0.16159-1.47220.072381
36-0.178014-1.62180.054321
37-0.200233-1.82420.035859
38-0.226357-2.06220.021158
39-0.251464-2.29090.012251
40-0.27292-2.48640.007454
41-0.291282-2.65370.00477
42-0.309433-2.81910.00301
43-0.325753-2.96780.001959
44-0.337179-3.07180.001438
45-0.338683-3.08560.00138
46-0.337849-3.0780.001412
47-0.341256-3.1090.001286
48-0.345786-3.15030.001134
49-0.35455-3.23010.000887
50-0.364968-3.3250.000659
51-0.373498-3.40270.000515
52-0.377154-3.4360.000462
53-0.381514-3.47580.000406
54-0.385298-3.51020.000363
55-0.386422-3.52050.000351
56-0.383976-3.49820.000378
57-0.375335-3.41950.000488
58-0.364164-3.31770.000674
59-0.355164-3.23570.000872
60-0.346713-3.15870.001105

\begin{tabular}{lllllllll}
\hline
Autocorrelation Function \tabularnewline
Time lag k & ACF(k) & T-STAT & P-value \tabularnewline
1 & 0.959886 & 8.745 & 0 \tabularnewline
2 & 0.917228 & 8.3563 & 0 \tabularnewline
3 & 0.875995 & 7.9807 & 0 \tabularnewline
4 & 0.834358 & 7.6014 & 0 \tabularnewline
5 & 0.79044 & 7.2012 & 0 \tabularnewline
6 & 0.749668 & 6.8298 & 0 \tabularnewline
7 & 0.711898 & 6.4857 & 0 \tabularnewline
8 & 0.674021 & 6.1406 & 0 \tabularnewline
9 & 0.649323 & 5.9156 & 0 \tabularnewline
10 & 0.629728 & 5.7371 & 0 \tabularnewline
11 & 0.608457 & 5.5433 & 0 \tabularnewline
12 & 0.580388 & 5.2876 & 0 \tabularnewline
13 & 0.538158 & 4.9028 & 2e-06 \tabularnewline
14 & 0.494553 & 4.5056 & 1.1e-05 \tabularnewline
15 & 0.454423 & 4.14 & 4.1e-05 \tabularnewline
16 & 0.413273 & 3.7651 & 0.000155 \tabularnewline
17 & 0.370343 & 3.374 & 0.000564 \tabularnewline
18 & 0.330787 & 3.0136 & 0.001711 \tabularnewline
19 & 0.292425 & 2.6641 & 0.004636 \tabularnewline
20 & 0.254357 & 2.3173 & 0.011475 \tabularnewline
21 & 0.227511 & 2.0727 & 0.02065 \tabularnewline
22 & 0.205867 & 1.8755 & 0.032118 \tabularnewline
23 & 0.180365 & 1.6432 & 0.052062 \tabularnewline
24 & 0.150731 & 1.3732 & 0.086691 \tabularnewline
25 & 0.11235 & 1.0236 & 0.154509 \tabularnewline
26 & 0.071098 & 0.6477 & 0.259471 \tabularnewline
27 & 0.032014 & 0.2917 & 0.385635 \tabularnewline
28 & -0.004992 & -0.0455 & 0.481917 \tabularnewline
29 & -0.038421 & -0.35 & 0.363602 \tabularnewline
30 & -0.069207 & -0.6305 & 0.265049 \tabularnewline
31 & -0.097942 & -0.8923 & 0.187408 \tabularnewline
32 & -0.124763 & -1.1366 & 0.12948 \tabularnewline
33 & -0.139642 & -1.2722 & 0.103427 \tabularnewline
34 & -0.148788 & -1.3555 & 0.089464 \tabularnewline
35 & -0.16159 & -1.4722 & 0.072381 \tabularnewline
36 & -0.178014 & -1.6218 & 0.054321 \tabularnewline
37 & -0.200233 & -1.8242 & 0.035859 \tabularnewline
38 & -0.226357 & -2.0622 & 0.021158 \tabularnewline
39 & -0.251464 & -2.2909 & 0.012251 \tabularnewline
40 & -0.27292 & -2.4864 & 0.007454 \tabularnewline
41 & -0.291282 & -2.6537 & 0.00477 \tabularnewline
42 & -0.309433 & -2.8191 & 0.00301 \tabularnewline
43 & -0.325753 & -2.9678 & 0.001959 \tabularnewline
44 & -0.337179 & -3.0718 & 0.001438 \tabularnewline
45 & -0.338683 & -3.0856 & 0.00138 \tabularnewline
46 & -0.337849 & -3.078 & 0.001412 \tabularnewline
47 & -0.341256 & -3.109 & 0.001286 \tabularnewline
48 & -0.345786 & -3.1503 & 0.001134 \tabularnewline
49 & -0.35455 & -3.2301 & 0.000887 \tabularnewline
50 & -0.364968 & -3.325 & 0.000659 \tabularnewline
51 & -0.373498 & -3.4027 & 0.000515 \tabularnewline
52 & -0.377154 & -3.436 & 0.000462 \tabularnewline
53 & -0.381514 & -3.4758 & 0.000406 \tabularnewline
54 & -0.385298 & -3.5102 & 0.000363 \tabularnewline
55 & -0.386422 & -3.5205 & 0.000351 \tabularnewline
56 & -0.383976 & -3.4982 & 0.000378 \tabularnewline
57 & -0.375335 & -3.4195 & 0.000488 \tabularnewline
58 & -0.364164 & -3.3177 & 0.000674 \tabularnewline
59 & -0.355164 & -3.2357 & 0.000872 \tabularnewline
60 & -0.346713 & -3.1587 & 0.001105 \tabularnewline
\hline
\end{tabular}
%Source: https://freestatistics.org/blog/index.php?pk=79018&T=1

[TABLE]
[ROW][C]Autocorrelation Function[/C][/ROW]
[ROW][C]Time lag k[/C][C]ACF(k)[/C][C]T-STAT[/C][C]P-value[/C][/ROW]
[ROW][C]1[/C][C]0.959886[/C][C]8.745[/C][C]0[/C][/ROW]
[ROW][C]2[/C][C]0.917228[/C][C]8.3563[/C][C]0[/C][/ROW]
[ROW][C]3[/C][C]0.875995[/C][C]7.9807[/C][C]0[/C][/ROW]
[ROW][C]4[/C][C]0.834358[/C][C]7.6014[/C][C]0[/C][/ROW]
[ROW][C]5[/C][C]0.79044[/C][C]7.2012[/C][C]0[/C][/ROW]
[ROW][C]6[/C][C]0.749668[/C][C]6.8298[/C][C]0[/C][/ROW]
[ROW][C]7[/C][C]0.711898[/C][C]6.4857[/C][C]0[/C][/ROW]
[ROW][C]8[/C][C]0.674021[/C][C]6.1406[/C][C]0[/C][/ROW]
[ROW][C]9[/C][C]0.649323[/C][C]5.9156[/C][C]0[/C][/ROW]
[ROW][C]10[/C][C]0.629728[/C][C]5.7371[/C][C]0[/C][/ROW]
[ROW][C]11[/C][C]0.608457[/C][C]5.5433[/C][C]0[/C][/ROW]
[ROW][C]12[/C][C]0.580388[/C][C]5.2876[/C][C]0[/C][/ROW]
[ROW][C]13[/C][C]0.538158[/C][C]4.9028[/C][C]2e-06[/C][/ROW]
[ROW][C]14[/C][C]0.494553[/C][C]4.5056[/C][C]1.1e-05[/C][/ROW]
[ROW][C]15[/C][C]0.454423[/C][C]4.14[/C][C]4.1e-05[/C][/ROW]
[ROW][C]16[/C][C]0.413273[/C][C]3.7651[/C][C]0.000155[/C][/ROW]
[ROW][C]17[/C][C]0.370343[/C][C]3.374[/C][C]0.000564[/C][/ROW]
[ROW][C]18[/C][C]0.330787[/C][C]3.0136[/C][C]0.001711[/C][/ROW]
[ROW][C]19[/C][C]0.292425[/C][C]2.6641[/C][C]0.004636[/C][/ROW]
[ROW][C]20[/C][C]0.254357[/C][C]2.3173[/C][C]0.011475[/C][/ROW]
[ROW][C]21[/C][C]0.227511[/C][C]2.0727[/C][C]0.02065[/C][/ROW]
[ROW][C]22[/C][C]0.205867[/C][C]1.8755[/C][C]0.032118[/C][/ROW]
[ROW][C]23[/C][C]0.180365[/C][C]1.6432[/C][C]0.052062[/C][/ROW]
[ROW][C]24[/C][C]0.150731[/C][C]1.3732[/C][C]0.086691[/C][/ROW]
[ROW][C]25[/C][C]0.11235[/C][C]1.0236[/C][C]0.154509[/C][/ROW]
[ROW][C]26[/C][C]0.071098[/C][C]0.6477[/C][C]0.259471[/C][/ROW]
[ROW][C]27[/C][C]0.032014[/C][C]0.2917[/C][C]0.385635[/C][/ROW]
[ROW][C]28[/C][C]-0.004992[/C][C]-0.0455[/C][C]0.481917[/C][/ROW]
[ROW][C]29[/C][C]-0.038421[/C][C]-0.35[/C][C]0.363602[/C][/ROW]
[ROW][C]30[/C][C]-0.069207[/C][C]-0.6305[/C][C]0.265049[/C][/ROW]
[ROW][C]31[/C][C]-0.097942[/C][C]-0.8923[/C][C]0.187408[/C][/ROW]
[ROW][C]32[/C][C]-0.124763[/C][C]-1.1366[/C][C]0.12948[/C][/ROW]
[ROW][C]33[/C][C]-0.139642[/C][C]-1.2722[/C][C]0.103427[/C][/ROW]
[ROW][C]34[/C][C]-0.148788[/C][C]-1.3555[/C][C]0.089464[/C][/ROW]
[ROW][C]35[/C][C]-0.16159[/C][C]-1.4722[/C][C]0.072381[/C][/ROW]
[ROW][C]36[/C][C]-0.178014[/C][C]-1.6218[/C][C]0.054321[/C][/ROW]
[ROW][C]37[/C][C]-0.200233[/C][C]-1.8242[/C][C]0.035859[/C][/ROW]
[ROW][C]38[/C][C]-0.226357[/C][C]-2.0622[/C][C]0.021158[/C][/ROW]
[ROW][C]39[/C][C]-0.251464[/C][C]-2.2909[/C][C]0.012251[/C][/ROW]
[ROW][C]40[/C][C]-0.27292[/C][C]-2.4864[/C][C]0.007454[/C][/ROW]
[ROW][C]41[/C][C]-0.291282[/C][C]-2.6537[/C][C]0.00477[/C][/ROW]
[ROW][C]42[/C][C]-0.309433[/C][C]-2.8191[/C][C]0.00301[/C][/ROW]
[ROW][C]43[/C][C]-0.325753[/C][C]-2.9678[/C][C]0.001959[/C][/ROW]
[ROW][C]44[/C][C]-0.337179[/C][C]-3.0718[/C][C]0.001438[/C][/ROW]
[ROW][C]45[/C][C]-0.338683[/C][C]-3.0856[/C][C]0.00138[/C][/ROW]
[ROW][C]46[/C][C]-0.337849[/C][C]-3.078[/C][C]0.001412[/C][/ROW]
[ROW][C]47[/C][C]-0.341256[/C][C]-3.109[/C][C]0.001286[/C][/ROW]
[ROW][C]48[/C][C]-0.345786[/C][C]-3.1503[/C][C]0.001134[/C][/ROW]
[ROW][C]49[/C][C]-0.35455[/C][C]-3.2301[/C][C]0.000887[/C][/ROW]
[ROW][C]50[/C][C]-0.364968[/C][C]-3.325[/C][C]0.000659[/C][/ROW]
[ROW][C]51[/C][C]-0.373498[/C][C]-3.4027[/C][C]0.000515[/C][/ROW]
[ROW][C]52[/C][C]-0.377154[/C][C]-3.436[/C][C]0.000462[/C][/ROW]
[ROW][C]53[/C][C]-0.381514[/C][C]-3.4758[/C][C]0.000406[/C][/ROW]
[ROW][C]54[/C][C]-0.385298[/C][C]-3.5102[/C][C]0.000363[/C][/ROW]
[ROW][C]55[/C][C]-0.386422[/C][C]-3.5205[/C][C]0.000351[/C][/ROW]
[ROW][C]56[/C][C]-0.383976[/C][C]-3.4982[/C][C]0.000378[/C][/ROW]
[ROW][C]57[/C][C]-0.375335[/C][C]-3.4195[/C][C]0.000488[/C][/ROW]
[ROW][C]58[/C][C]-0.364164[/C][C]-3.3177[/C][C]0.000674[/C][/ROW]
[ROW][C]59[/C][C]-0.355164[/C][C]-3.2357[/C][C]0.000872[/C][/ROW]
[ROW][C]60[/C][C]-0.346713[/C][C]-3.1587[/C][C]0.001105[/C][/ROW]
[/TABLE]
Source: https://freestatistics.org/blog/index.php?pk=79018&T=1

Globally Unique Identifier (entire table): ba.freestatistics.org/blog/index.php?pk=79018&T=1

As an alternative you can also use a QR Code:  

The GUIDs for individual cells are displayed in the table below:

Autocorrelation Function
Time lag kACF(k)T-STATP-value
10.9598868.7450
20.9172288.35630
30.8759957.98070
40.8343587.60140
50.790447.20120
60.7496686.82980
70.7118986.48570
80.6740216.14060
90.6493235.91560
100.6297285.73710
110.6084575.54330
120.5803885.28760
130.5381584.90282e-06
140.4945534.50561.1e-05
150.4544234.144.1e-05
160.4132733.76510.000155
170.3703433.3740.000564
180.3307873.01360.001711
190.2924252.66410.004636
200.2543572.31730.011475
210.2275112.07270.02065
220.2058671.87550.032118
230.1803651.64320.052062
240.1507311.37320.086691
250.112351.02360.154509
260.0710980.64770.259471
270.0320140.29170.385635
28-0.004992-0.04550.481917
29-0.038421-0.350.363602
30-0.069207-0.63050.265049
31-0.097942-0.89230.187408
32-0.124763-1.13660.12948
33-0.139642-1.27220.103427
34-0.148788-1.35550.089464
35-0.16159-1.47220.072381
36-0.178014-1.62180.054321
37-0.200233-1.82420.035859
38-0.226357-2.06220.021158
39-0.251464-2.29090.012251
40-0.27292-2.48640.007454
41-0.291282-2.65370.00477
42-0.309433-2.81910.00301
43-0.325753-2.96780.001959
44-0.337179-3.07180.001438
45-0.338683-3.08560.00138
46-0.337849-3.0780.001412
47-0.341256-3.1090.001286
48-0.345786-3.15030.001134
49-0.35455-3.23010.000887
50-0.364968-3.3250.000659
51-0.373498-3.40270.000515
52-0.377154-3.4360.000462
53-0.381514-3.47580.000406
54-0.385298-3.51020.000363
55-0.386422-3.52050.000351
56-0.383976-3.49820.000378
57-0.375335-3.41950.000488
58-0.364164-3.31770.000674
59-0.355164-3.23570.000872
60-0.346713-3.15870.001105


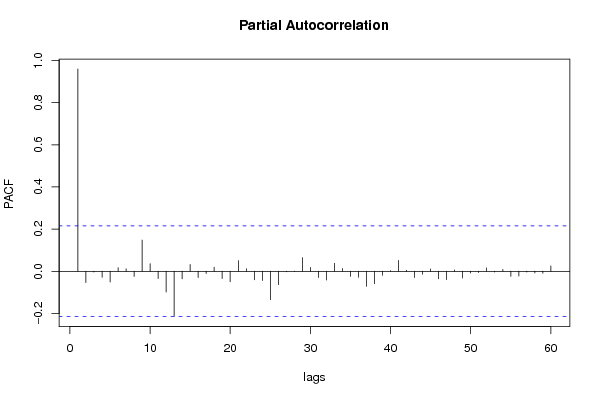
Partial Autocorrelation Function
Time lag kPACF(k)T-STATP-value
10.9598868.7450
2-0.052828-0.48130.315789
3-0.003087-0.02810.488816
4-0.028285-0.25770.398644
5-0.051138-0.46590.321257
60.0173130.15770.437527
70.0115160.10490.458349
8-0.024171-0.22020.413125
90.1479341.34770.090704
100.0363560.33120.370657
11-0.034219-0.31180.378005
12-0.098689-0.89910.185601
13-0.212935-1.93990.027892
14-0.035333-0.32190.374169
150.0323150.29440.384592
16-0.029202-0.2660.395434
17-0.010327-0.09410.462636
180.0190580.17360.431291
19-0.034728-0.31640.376252
20-0.049319-0.44930.327187
210.0507860.46270.322401
220.0120970.11020.456256
23-0.040614-0.370.356159
24-0.044105-0.40180.344425
25-0.134733-1.22750.111557
26-0.063404-0.57760.282536
27-0.002141-0.01950.492244
28-0.001028-0.00940.496274
290.0644050.58680.279479
300.017920.16330.435356
31-0.029748-0.2710.393527
32-0.041579-0.37880.3529
330.0383940.34980.363692
340.0133730.12180.451661
35-0.023965-0.21830.413855
36-0.028448-0.25920.398072
37-0.070626-0.64340.260857
38-0.059249-0.53980.295394
39-0.019312-0.17590.430384
400.0028990.02640.489496
410.0515220.46940.320012
420.0052520.04790.480975
43-0.029466-0.26840.394512
44-0.013604-0.12390.450834
450.010790.09830.460966
46-0.035139-0.32010.374837
47-0.039305-0.35810.360594
480.0065610.05980.47624
49-0.032247-0.29380.384829
50-0.007504-0.06840.472829
51-0.006163-0.05610.477681
520.0161180.14680.441806
53-0.003189-0.0290.488448
540.0090560.08250.467222
55-0.023862-0.21740.414218
56-0.022185-0.20210.420162
57-0.003591-0.03270.486991
58-0.007601-0.06930.472478
59-0.009158-0.08340.466854
600.0248380.22630.41077

\begin{tabular}{lllllllll}
\hline
Partial Autocorrelation Function \tabularnewline
Time lag k & PACF(k) & T-STAT & P-value \tabularnewline
1 & 0.959886 & 8.745 & 0 \tabularnewline
2 & -0.052828 & -0.4813 & 0.315789 \tabularnewline
3 & -0.003087 & -0.0281 & 0.488816 \tabularnewline
4 & -0.028285 & -0.2577 & 0.398644 \tabularnewline
5 & -0.051138 & -0.4659 & 0.321257 \tabularnewline
6 & 0.017313 & 0.1577 & 0.437527 \tabularnewline
7 & 0.011516 & 0.1049 & 0.458349 \tabularnewline
8 & -0.024171 & -0.2202 & 0.413125 \tabularnewline
9 & 0.147934 & 1.3477 & 0.090704 \tabularnewline
10 & 0.036356 & 0.3312 & 0.370657 \tabularnewline
11 & -0.034219 & -0.3118 & 0.378005 \tabularnewline
12 & -0.098689 & -0.8991 & 0.185601 \tabularnewline
13 & -0.212935 & -1.9399 & 0.027892 \tabularnewline
14 & -0.035333 & -0.3219 & 0.374169 \tabularnewline
15 & 0.032315 & 0.2944 & 0.384592 \tabularnewline
16 & -0.029202 & -0.266 & 0.395434 \tabularnewline
17 & -0.010327 & -0.0941 & 0.462636 \tabularnewline
18 & 0.019058 & 0.1736 & 0.431291 \tabularnewline
19 & -0.034728 & -0.3164 & 0.376252 \tabularnewline
20 & -0.049319 & -0.4493 & 0.327187 \tabularnewline
21 & 0.050786 & 0.4627 & 0.322401 \tabularnewline
22 & 0.012097 & 0.1102 & 0.456256 \tabularnewline
23 & -0.040614 & -0.37 & 0.356159 \tabularnewline
24 & -0.044105 & -0.4018 & 0.344425 \tabularnewline
25 & -0.134733 & -1.2275 & 0.111557 \tabularnewline
26 & -0.063404 & -0.5776 & 0.282536 \tabularnewline
27 & -0.002141 & -0.0195 & 0.492244 \tabularnewline
28 & -0.001028 & -0.0094 & 0.496274 \tabularnewline
29 & 0.064405 & 0.5868 & 0.279479 \tabularnewline
30 & 0.01792 & 0.1633 & 0.435356 \tabularnewline
31 & -0.029748 & -0.271 & 0.393527 \tabularnewline
32 & -0.041579 & -0.3788 & 0.3529 \tabularnewline
33 & 0.038394 & 0.3498 & 0.363692 \tabularnewline
34 & 0.013373 & 0.1218 & 0.451661 \tabularnewline
35 & -0.023965 & -0.2183 & 0.413855 \tabularnewline
36 & -0.028448 & -0.2592 & 0.398072 \tabularnewline
37 & -0.070626 & -0.6434 & 0.260857 \tabularnewline
38 & -0.059249 & -0.5398 & 0.295394 \tabularnewline
39 & -0.019312 & -0.1759 & 0.430384 \tabularnewline
40 & 0.002899 & 0.0264 & 0.489496 \tabularnewline
41 & 0.051522 & 0.4694 & 0.320012 \tabularnewline
42 & 0.005252 & 0.0479 & 0.480975 \tabularnewline
43 & -0.029466 & -0.2684 & 0.394512 \tabularnewline
44 & -0.013604 & -0.1239 & 0.450834 \tabularnewline
45 & 0.01079 & 0.0983 & 0.460966 \tabularnewline
46 & -0.035139 & -0.3201 & 0.374837 \tabularnewline
47 & -0.039305 & -0.3581 & 0.360594 \tabularnewline
48 & 0.006561 & 0.0598 & 0.47624 \tabularnewline
49 & -0.032247 & -0.2938 & 0.384829 \tabularnewline
50 & -0.007504 & -0.0684 & 0.472829 \tabularnewline
51 & -0.006163 & -0.0561 & 0.477681 \tabularnewline
52 & 0.016118 & 0.1468 & 0.441806 \tabularnewline
53 & -0.003189 & -0.029 & 0.488448 \tabularnewline
54 & 0.009056 & 0.0825 & 0.467222 \tabularnewline
55 & -0.023862 & -0.2174 & 0.414218 \tabularnewline
56 & -0.022185 & -0.2021 & 0.420162 \tabularnewline
57 & -0.003591 & -0.0327 & 0.486991 \tabularnewline
58 & -0.007601 & -0.0693 & 0.472478 \tabularnewline
59 & -0.009158 & -0.0834 & 0.466854 \tabularnewline
60 & 0.024838 & 0.2263 & 0.41077 \tabularnewline
\hline
\end{tabular}
%Source: https://freestatistics.org/blog/index.php?pk=79018&T=2

[TABLE]
[ROW][C]Partial Autocorrelation Function[/C][/ROW]
[ROW][C]Time lag k[/C][C]PACF(k)[/C][C]T-STAT[/C][C]P-value[/C][/ROW]
[ROW][C]1[/C][C]0.959886[/C][C]8.745[/C][C]0[/C][/ROW]
[ROW][C]2[/C][C]-0.052828[/C][C]-0.4813[/C][C]0.315789[/C][/ROW]
[ROW][C]3[/C][C]-0.003087[/C][C]-0.0281[/C][C]0.488816[/C][/ROW]
[ROW][C]4[/C][C]-0.028285[/C][C]-0.2577[/C][C]0.398644[/C][/ROW]
[ROW][C]5[/C][C]-0.051138[/C][C]-0.4659[/C][C]0.321257[/C][/ROW]
[ROW][C]6[/C][C]0.017313[/C][C]0.1577[/C][C]0.437527[/C][/ROW]
[ROW][C]7[/C][C]0.011516[/C][C]0.1049[/C][C]0.458349[/C][/ROW]
[ROW][C]8[/C][C]-0.024171[/C][C]-0.2202[/C][C]0.413125[/C][/ROW]
[ROW][C]9[/C][C]0.147934[/C][C]1.3477[/C][C]0.090704[/C][/ROW]
[ROW][C]10[/C][C]0.036356[/C][C]0.3312[/C][C]0.370657[/C][/ROW]
[ROW][C]11[/C][C]-0.034219[/C][C]-0.3118[/C][C]0.378005[/C][/ROW]
[ROW][C]12[/C][C]-0.098689[/C][C]-0.8991[/C][C]0.185601[/C][/ROW]
[ROW][C]13[/C][C]-0.212935[/C][C]-1.9399[/C][C]0.027892[/C][/ROW]
[ROW][C]14[/C][C]-0.035333[/C][C]-0.3219[/C][C]0.374169[/C][/ROW]
[ROW][C]15[/C][C]0.032315[/C][C]0.2944[/C][C]0.384592[/C][/ROW]
[ROW][C]16[/C][C]-0.029202[/C][C]-0.266[/C][C]0.395434[/C][/ROW]
[ROW][C]17[/C][C]-0.010327[/C][C]-0.0941[/C][C]0.462636[/C][/ROW]
[ROW][C]18[/C][C]0.019058[/C][C]0.1736[/C][C]0.431291[/C][/ROW]
[ROW][C]19[/C][C]-0.034728[/C][C]-0.3164[/C][C]0.376252[/C][/ROW]
[ROW][C]20[/C][C]-0.049319[/C][C]-0.4493[/C][C]0.327187[/C][/ROW]
[ROW][C]21[/C][C]0.050786[/C][C]0.4627[/C][C]0.322401[/C][/ROW]
[ROW][C]22[/C][C]0.012097[/C][C]0.1102[/C][C]0.456256[/C][/ROW]
[ROW][C]23[/C][C]-0.040614[/C][C]-0.37[/C][C]0.356159[/C][/ROW]
[ROW][C]24[/C][C]-0.044105[/C][C]-0.4018[/C][C]0.344425[/C][/ROW]
[ROW][C]25[/C][C]-0.134733[/C][C]-1.2275[/C][C]0.111557[/C][/ROW]
[ROW][C]26[/C][C]-0.063404[/C][C]-0.5776[/C][C]0.282536[/C][/ROW]
[ROW][C]27[/C][C]-0.002141[/C][C]-0.0195[/C][C]0.492244[/C][/ROW]
[ROW][C]28[/C][C]-0.001028[/C][C]-0.0094[/C][C]0.496274[/C][/ROW]
[ROW][C]29[/C][C]0.064405[/C][C]0.5868[/C][C]0.279479[/C][/ROW]
[ROW][C]30[/C][C]0.01792[/C][C]0.1633[/C][C]0.435356[/C][/ROW]
[ROW][C]31[/C][C]-0.029748[/C][C]-0.271[/C][C]0.393527[/C][/ROW]
[ROW][C]32[/C][C]-0.041579[/C][C]-0.3788[/C][C]0.3529[/C][/ROW]
[ROW][C]33[/C][C]0.038394[/C][C]0.3498[/C][C]0.363692[/C][/ROW]
[ROW][C]34[/C][C]0.013373[/C][C]0.1218[/C][C]0.451661[/C][/ROW]
[ROW][C]35[/C][C]-0.023965[/C][C]-0.2183[/C][C]0.413855[/C][/ROW]
[ROW][C]36[/C][C]-0.028448[/C][C]-0.2592[/C][C]0.398072[/C][/ROW]
[ROW][C]37[/C][C]-0.070626[/C][C]-0.6434[/C][C]0.260857[/C][/ROW]
[ROW][C]38[/C][C]-0.059249[/C][C]-0.5398[/C][C]0.295394[/C][/ROW]
[ROW][C]39[/C][C]-0.019312[/C][C]-0.1759[/C][C]0.430384[/C][/ROW]
[ROW][C]40[/C][C]0.002899[/C][C]0.0264[/C][C]0.489496[/C][/ROW]
[ROW][C]41[/C][C]0.051522[/C][C]0.4694[/C][C]0.320012[/C][/ROW]
[ROW][C]42[/C][C]0.005252[/C][C]0.0479[/C][C]0.480975[/C][/ROW]
[ROW][C]43[/C][C]-0.029466[/C][C]-0.2684[/C][C]0.394512[/C][/ROW]
[ROW][C]44[/C][C]-0.013604[/C][C]-0.1239[/C][C]0.450834[/C][/ROW]
[ROW][C]45[/C][C]0.01079[/C][C]0.0983[/C][C]0.460966[/C][/ROW]
[ROW][C]46[/C][C]-0.035139[/C][C]-0.3201[/C][C]0.374837[/C][/ROW]
[ROW][C]47[/C][C]-0.039305[/C][C]-0.3581[/C][C]0.360594[/C][/ROW]
[ROW][C]48[/C][C]0.006561[/C][C]0.0598[/C][C]0.47624[/C][/ROW]
[ROW][C]49[/C][C]-0.032247[/C][C]-0.2938[/C][C]0.384829[/C][/ROW]
[ROW][C]50[/C][C]-0.007504[/C][C]-0.0684[/C][C]0.472829[/C][/ROW]
[ROW][C]51[/C][C]-0.006163[/C][C]-0.0561[/C][C]0.477681[/C][/ROW]
[ROW][C]52[/C][C]0.016118[/C][C]0.1468[/C][C]0.441806[/C][/ROW]
[ROW][C]53[/C][C]-0.003189[/C][C]-0.029[/C][C]0.488448[/C][/ROW]
[ROW][C]54[/C][C]0.009056[/C][C]0.0825[/C][C]0.467222[/C][/ROW]
[ROW][C]55[/C][C]-0.023862[/C][C]-0.2174[/C][C]0.414218[/C][/ROW]
[ROW][C]56[/C][C]-0.022185[/C][C]-0.2021[/C][C]0.420162[/C][/ROW]
[ROW][C]57[/C][C]-0.003591[/C][C]-0.0327[/C][C]0.486991[/C][/ROW]
[ROW][C]58[/C][C]-0.007601[/C][C]-0.0693[/C][C]0.472478[/C][/ROW]
[ROW][C]59[/C][C]-0.009158[/C][C]-0.0834[/C][C]0.466854[/C][/ROW]
[ROW][C]60[/C][C]0.024838[/C][C]0.2263[/C][C]0.41077[/C][/ROW]
[/TABLE]
Source: https://freestatistics.org/blog/index.php?pk=79018&T=2

Globally Unique Identifier (entire table): ba.freestatistics.org/blog/index.php?pk=79018&T=2

As an alternative you can also use a QR Code:  

The GUIDs for individual cells are displayed in the table below:

Partial Autocorrelation Function
Time lag kPACF(k)T-STATP-value
10.9598868.7450
2-0.052828-0.48130.315789
3-0.003087-0.02810.488816
4-0.028285-0.25770.398644
5-0.051138-0.46590.321257
60.0173130.15770.437527
70.0115160.10490.458349
8-0.024171-0.22020.413125
90.1479341.34770.090704
100.0363560.33120.370657
11-0.034219-0.31180.378005
12-0.098689-0.89910.185601
13-0.212935-1.93990.027892
14-0.035333-0.32190.374169
150.0323150.29440.384592
16-0.029202-0.2660.395434
17-0.010327-0.09410.462636
180.0190580.17360.431291
19-0.034728-0.31640.376252
20-0.049319-0.44930.327187
210.0507860.46270.322401
220.0120970.11020.456256
23-0.040614-0.370.356159
24-0.044105-0.40180.344425
25-0.134733-1.22750.111557
26-0.063404-0.57760.282536
27-0.002141-0.01950.492244
28-0.001028-0.00940.496274
290.0644050.58680.279479
300.017920.16330.435356
31-0.029748-0.2710.393527
32-0.041579-0.37880.3529
330.0383940.34980.363692
340.0133730.12180.451661
35-0.023965-0.21830.413855
36-0.028448-0.25920.398072
37-0.070626-0.64340.260857
38-0.059249-0.53980.295394
39-0.019312-0.17590.430384
400.0028990.02640.489496
410.0515220.46940.320012
420.0052520.04790.480975
43-0.029466-0.26840.394512
44-0.013604-0.12390.450834
450.010790.09830.460966
46-0.035139-0.32010.374837
47-0.039305-0.35810.360594
480.0065610.05980.47624
49-0.032247-0.29380.384829
50-0.007504-0.06840.472829
51-0.006163-0.05610.477681
520.0161180.14680.441806
53-0.003189-0.0290.488448
540.0090560.08250.467222
55-0.023862-0.21740.414218
56-0.022185-0.20210.420162
57-0.003591-0.03270.486991
58-0.007601-0.06930.472478
59-0.009158-0.08340.466854
600.0248380.22630.41077


Parameters (Session):
par1 = 0.1 ; par2 = 0.9 ; par3 = 0.1 ;
Parameters (R input):
par1 = 60 ; par2 = 1 ; par3 = 0 ; par4 = 0 ; par5 = 12 ; par6 = White Noise ; par7 = 0.95 ;
R code (references can be found in the software module):
if (par1 == 'Default') {
par1 = 10*log10(length(x))
} else {
par1 <- as.numeric(par1)
}
par2 <- as.numeric(par2)
par3 <- as.numeric(par3)
par4 <- as.numeric(par4)
par5 <- as.numeric(par5)
if (par6 == 'White Noise') par6 <- 'white' else par6 <- 'ma'
par7 <- as.numeric(par7)
if (par2 == 0) {
x <- log(x)
} else {
x <- (x ^ par2 - 1) / par2
}
if (par3 > 0) x <- diff(x,lag=1,difference=par3)
if (par4 > 0) x <- diff(x,lag=par5,difference=par4)
bitmap(file='pic1.png')
racf <- acf(x, par1, main='Autocorrelation', xlab='time lag', ylab='ACF', ci.type=par6, ci=par7, sub=paste('(lambda=',par2,', d=',par3,', D=',par4,', CI=', par7, ', CI type=',par6,')',sep=''))
dev.off()
bitmap(file='pic2.png')
rpacf <- pacf(x,par1,main='Partial Autocorrelation',xlab='lags',ylab='PACF')
dev.off()
(myacf <- c(racf$acf))
(mypacf <- c(rpacf$acf))
lengthx <- length(x)
sqrtn <- sqrt(lengthx)
load(file='createtable')
a<-table.start()
a<-table.row.start(a)
a<-table.element(a,'Autocorrelation Function',4,TRUE)
a<-table.row.end(a)
a<-table.row.start(a)
a<-table.element(a,'Time lag k',header=TRUE)
a<-table.element(a,hyperlink('basics.htm','ACF(k)','click here for more information about the Autocorrelation Function'),header=TRUE)
a<-table.element(a,'T-STAT',header=TRUE)
a<-table.element(a,'P-value',header=TRUE)
a<-table.row.end(a)
for (i in 2:(par1+1)) {
a<-table.row.start(a)
a<-table.element(a,i-1,header=TRUE)
a<-table.element(a,round(myacf[i],6))
mytstat <- myacf[i]*sqrtn
a<-table.element(a,round(mytstat,4))
a<-table.element(a,round(1-pt(abs(mytstat),lengthx),6))
a<-table.row.end(a)
}
a<-table.end(a)
table.save(a,file='mytable.tab')
a<-table.start()
a<-table.row.start(a)
a<-table.element(a,'Partial Autocorrelation Function',4,TRUE)
a<-table.row.end(a)
a<-table.row.start(a)
a<-table.element(a,'Time lag k',header=TRUE)
a<-table.element(a,hyperlink('basics.htm','PACF(k)','click here for more information about the Partial Autocorrelation Function'),header=TRUE)
a<-table.element(a,'T-STAT',header=TRUE)
a<-table.element(a,'P-value',header=TRUE)
a<-table.row.end(a)
for (i in 1:par1) {
a<-table.row.start(a)
a<-table.element(a,i,header=TRUE)
a<-table.element(a,round(mypacf[i],6))
mytstat <- mypacf[i]*sqrtn
a<-table.element(a,round(mytstat,4))
a<-table.element(a,round(1-pt(abs(mytstat),lengthx),6))
a<-table.row.end(a)
}
a<-table.end(a)
table.save(a,file='mytable1.tab')