Free Statistics

of Irreproducible Research!

Author's title

Author*Unverified author*
R Software Modulerwasp_smp.wasp
Title produced by softwareStandard Deviation-Mean Plot
Date of computationMon, 16 Aug 2010 15:07:09 +0000
Cite this page as followsStatistical Computations at FreeStatistics.org, Office for Research Development and Education, URL https://freestatistics.org/blog/index.php?v=date/2010/Aug/16/t1281971226bhtj3hrs48yslhp.htm/, Retrieved Thu, 16 May 2024 04:59:55 +0000
Statistical Computations at FreeStatistics.org, Office for Research Development and Education, URL https://freestatistics.org/blog/index.php?pk=79016, Retrieved Thu, 16 May 2024 04:59:55 +0000
QR Codes:

Original text written by user:
IsPrivate?No (this computation is public)
User-defined keywordsJeroen_Kinne
Estimated Impact99
Family? (F = Feedback message, R = changed R code, M = changed R Module, P = changed Parameters, D = changed Data)
-       [Standard Deviation-Mean Plot] [standard_Deviatio...] [2010-08-16 15:07:09] [6fe3b5976049c9b6736c06f51fce3033] [Current]
Feedback Forum

Post a new message
Dataseries X:
430
429
428
426
424
423
424
426
427
427
428
430
432
435
426
411
405
403
402
399
392
387
380
379
386
385
365
356
338
338
343
338
320
316
317
315
317
321
303
303
290
285
300
291
278
273
277
269
275
278
255
254
245
240
261
247
229
213
218
206
217
219
196
193
188
171
190
180
149
135
151
134
145
151
137
124
125
109
131
133
103
85
104
82


Summary of computational transaction
Raw Inputview raw input (R code)
Raw Outputview raw output of R engine
Computing time1 seconds
R Server'Gwilym Jenkins' @ 72.249.127.135

\begin{tabular}{lllllllll}
\hline
Summary of computational transaction \tabularnewline
Raw Input & view raw input (R code)  \tabularnewline
Raw Output & view raw output of R engine  \tabularnewline
Computing time & 1 seconds \tabularnewline
R Server & 'Gwilym Jenkins' @ 72.249.127.135 \tabularnewline
\hline
\end{tabular}
%Source: https://freestatistics.org/blog/index.php?pk=79016&T=0

[TABLE]
[ROW][C]Summary of computational transaction[/C][/ROW]
[ROW][C]Raw Input[/C][C]view raw input (R code) [/C][/ROW]
[ROW][C]Raw Output[/C][C]view raw output of R engine [/C][/ROW]
[ROW][C]Computing time[/C][C]1 seconds[/C][/ROW]
[ROW][C]R Server[/C][C]'Gwilym Jenkins' @ 72.249.127.135[/C][/ROW]
[/TABLE]
Source: https://freestatistics.org/blog/index.php?pk=79016&T=0

Globally Unique Identifier (entire table): ba.freestatistics.org/blog/index.php?pk=79016&T=0

As an alternative you can also use a QR Code:  

The GUIDs for individual cells are displayed in the table below:

Summary of computational transaction
Raw Inputview raw input (R code)
Raw Outputview raw output of R engine
Computing time1 seconds
R Server'Gwilym Jenkins' @ 72.249.127.135


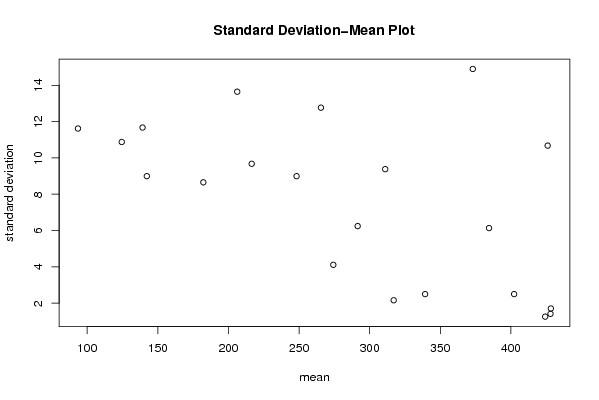
Standard Deviation-Mean Plot
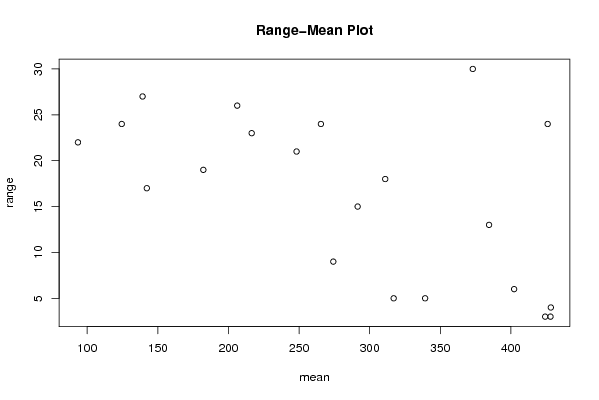
SectionMeanStandard DeviationRange
1428.251.707825127659934
2424.251.258305739211793
34281.414213562373103
442610.677078252031324
5402.252.56
6384.56.1373175465073213
737314.899664425751330
8339.252.55
93172.160246899469295
103119.3808315196468618
11291.56.244997998398415
12274.254.112987559751029
13265.512.767145334803724
14248.258.995369179009121
15216.59.6781540939719823
16206.2513.647344063956226
17182.258.6554414483991919
18142.258.995369179009117
19139.2511.672617529928827
20124.510.878112581387124
2193.511.618950038622322

\begin{tabular}{lllllllll}
\hline
Standard Deviation-Mean Plot \tabularnewline
Section & Mean & Standard Deviation & Range \tabularnewline
1 & 428.25 & 1.70782512765993 & 4 \tabularnewline
2 & 424.25 & 1.25830573921179 & 3 \tabularnewline
3 & 428 & 1.41421356237310 & 3 \tabularnewline
4 & 426 & 10.6770782520313 & 24 \tabularnewline
5 & 402.25 & 2.5 & 6 \tabularnewline
6 & 384.5 & 6.13731754650732 & 13 \tabularnewline
7 & 373 & 14.8996644257513 & 30 \tabularnewline
8 & 339.25 & 2.5 & 5 \tabularnewline
9 & 317 & 2.16024689946929 & 5 \tabularnewline
10 & 311 & 9.38083151964686 & 18 \tabularnewline
11 & 291.5 & 6.2449979983984 & 15 \tabularnewline
12 & 274.25 & 4.11298755975102 & 9 \tabularnewline
13 & 265.5 & 12.7671453348037 & 24 \tabularnewline
14 & 248.25 & 8.9953691790091 & 21 \tabularnewline
15 & 216.5 & 9.67815409397198 & 23 \tabularnewline
16 & 206.25 & 13.6473440639562 & 26 \tabularnewline
17 & 182.25 & 8.65544144839919 & 19 \tabularnewline
18 & 142.25 & 8.9953691790091 & 17 \tabularnewline
19 & 139.25 & 11.6726175299288 & 27 \tabularnewline
20 & 124.5 & 10.8781125813871 & 24 \tabularnewline
21 & 93.5 & 11.6189500386223 & 22 \tabularnewline
\hline
\end{tabular}
%Source: https://freestatistics.org/blog/index.php?pk=79016&T=1

[TABLE]
[ROW][C]Standard Deviation-Mean Plot[/C][/ROW]
[ROW][C]Section[/C][C]Mean[/C][C]Standard Deviation[/C][C]Range[/C][/ROW]
[ROW][C]1[/C][C]428.25[/C][C]1.70782512765993[/C][C]4[/C][/ROW]
[ROW][C]2[/C][C]424.25[/C][C]1.25830573921179[/C][C]3[/C][/ROW]
[ROW][C]3[/C][C]428[/C][C]1.41421356237310[/C][C]3[/C][/ROW]
[ROW][C]4[/C][C]426[/C][C]10.6770782520313[/C][C]24[/C][/ROW]
[ROW][C]5[/C][C]402.25[/C][C]2.5[/C][C]6[/C][/ROW]
[ROW][C]6[/C][C]384.5[/C][C]6.13731754650732[/C][C]13[/C][/ROW]
[ROW][C]7[/C][C]373[/C][C]14.8996644257513[/C][C]30[/C][/ROW]
[ROW][C]8[/C][C]339.25[/C][C]2.5[/C][C]5[/C][/ROW]
[ROW][C]9[/C][C]317[/C][C]2.16024689946929[/C][C]5[/C][/ROW]
[ROW][C]10[/C][C]311[/C][C]9.38083151964686[/C][C]18[/C][/ROW]
[ROW][C]11[/C][C]291.5[/C][C]6.2449979983984[/C][C]15[/C][/ROW]
[ROW][C]12[/C][C]274.25[/C][C]4.11298755975102[/C][C]9[/C][/ROW]
[ROW][C]13[/C][C]265.5[/C][C]12.7671453348037[/C][C]24[/C][/ROW]
[ROW][C]14[/C][C]248.25[/C][C]8.9953691790091[/C][C]21[/C][/ROW]
[ROW][C]15[/C][C]216.5[/C][C]9.67815409397198[/C][C]23[/C][/ROW]
[ROW][C]16[/C][C]206.25[/C][C]13.6473440639562[/C][C]26[/C][/ROW]
[ROW][C]17[/C][C]182.25[/C][C]8.65544144839919[/C][C]19[/C][/ROW]
[ROW][C]18[/C][C]142.25[/C][C]8.9953691790091[/C][C]17[/C][/ROW]
[ROW][C]19[/C][C]139.25[/C][C]11.6726175299288[/C][C]27[/C][/ROW]
[ROW][C]20[/C][C]124.5[/C][C]10.8781125813871[/C][C]24[/C][/ROW]
[ROW][C]21[/C][C]93.5[/C][C]11.6189500386223[/C][C]22[/C][/ROW]
[/TABLE]
Source: https://freestatistics.org/blog/index.php?pk=79016&T=1

Globally Unique Identifier (entire table): ba.freestatistics.org/blog/index.php?pk=79016&T=1

As an alternative you can also use a QR Code:  

The GUIDs for individual cells are displayed in the table below:

Standard Deviation-Mean Plot
SectionMeanStandard DeviationRange
1428.251.707825127659934
2424.251.258305739211793
34281.414213562373103
442610.677078252031324
5402.252.56
6384.56.1373175465073213
737314.899664425751330
8339.252.55
93172.160246899469295
103119.3808315196468618
11291.56.244997998398415
12274.254.112987559751029
13265.512.767145334803724
14248.258.995369179009121
15216.59.6781540939719823
16206.2513.647344063956226
17182.258.6554414483991919
18142.258.995369179009117
19139.2511.672617529928827
20124.510.878112581387124
2193.511.618950038622322


Regression: S.E.(k) = alpha + beta * Mean(k)
alpha14.2280102535655
beta-0.0230803894050665
S.D.0.00754023759134628
T-STAT-3.06096314943115
p-value0.00643034250983087

\begin{tabular}{lllllllll}
\hline
Regression: S.E.(k) = alpha + beta * Mean(k) \tabularnewline
alpha & 14.2280102535655 \tabularnewline
beta & -0.0230803894050665 \tabularnewline
S.D. & 0.00754023759134628 \tabularnewline
T-STAT & -3.06096314943115 \tabularnewline
p-value & 0.00643034250983087 \tabularnewline
\hline
\end{tabular}
%Source: https://freestatistics.org/blog/index.php?pk=79016&T=2

[TABLE]
[ROW][C]Regression: S.E.(k) = alpha + beta * Mean(k)[/C][/ROW]
[ROW][C]alpha[/C][C]14.2280102535655[/C][/ROW]
[ROW][C]beta[/C][C]-0.0230803894050665[/C][/ROW]
[ROW][C]S.D.[/C][C]0.00754023759134628[/C][/ROW]
[ROW][C]T-STAT[/C][C]-3.06096314943115[/C][/ROW]
[ROW][C]p-value[/C][C]0.00643034250983087[/C][/ROW]
[/TABLE]
Source: https://freestatistics.org/blog/index.php?pk=79016&T=2

Globally Unique Identifier (entire table): ba.freestatistics.org/blog/index.php?pk=79016&T=2

As an alternative you can also use a QR Code:  

The GUIDs for individual cells are displayed in the table below:

Regression: S.E.(k) = alpha + beta * Mean(k)
alpha14.2280102535655
beta-0.0230803894050665
S.D.0.00754023759134628
T-STAT-3.06096314943115
p-value0.00643034250983087


Regression: ln S.E.(k) = alpha + beta * ln Mean(k)
alpha7.69259514650197
beta-1.06164023429875
S.D.0.330575352333940
T-STAT-3.21149240801931
p-value0.00459425319459718
Lambda2.06164023429875

\begin{tabular}{lllllllll}
\hline
Regression: ln S.E.(k) = alpha + beta * ln Mean(k) \tabularnewline
alpha & 7.69259514650197 \tabularnewline
beta & -1.06164023429875 \tabularnewline
S.D. & 0.330575352333940 \tabularnewline
T-STAT & -3.21149240801931 \tabularnewline
p-value & 0.00459425319459718 \tabularnewline
Lambda & 2.06164023429875 \tabularnewline
\hline
\end{tabular}
%Source: https://freestatistics.org/blog/index.php?pk=79016&T=3

[TABLE]
[ROW][C]Regression: ln S.E.(k) = alpha + beta * ln Mean(k)[/C][/ROW]
[ROW][C]alpha[/C][C]7.69259514650197[/C][/ROW]
[ROW][C]beta[/C][C]-1.06164023429875[/C][/ROW]
[ROW][C]S.D.[/C][C]0.330575352333940[/C][/ROW]
[ROW][C]T-STAT[/C][C]-3.21149240801931[/C][/ROW]
[ROW][C]p-value[/C][C]0.00459425319459718[/C][/ROW]
[ROW][C]Lambda[/C][C]2.06164023429875[/C][/ROW]
[/TABLE]
Source: https://freestatistics.org/blog/index.php?pk=79016&T=3

Globally Unique Identifier (entire table): ba.freestatistics.org/blog/index.php?pk=79016&T=3

As an alternative you can also use a QR Code:  

The GUIDs for individual cells are displayed in the table below:

Regression: ln S.E.(k) = alpha + beta * ln Mean(k)
alpha7.69259514650197
beta-1.06164023429875
S.D.0.330575352333940
T-STAT-3.21149240801931
p-value0.00459425319459718
Lambda2.06164023429875


Parameters (Session):
par1 = 4 ;
Parameters (R input):
par1 = 4 ;
R code (references can be found in the software module):
par1 <- as.numeric(par1)
(n <- length(x))
(np <- floor(n / par1))
arr <- array(NA,dim=c(par1,np))
j <- 0
k <- 1
for (i in 1:(np*par1))
{
j = j + 1
arr[j,k] <- x[i]
if (j == par1) {
j = 0
k=k+1
}
}
arr
arr.mean <- array(NA,dim=np)
arr.sd <- array(NA,dim=np)
arr.range <- array(NA,dim=np)
for (j in 1:np)
{
arr.mean[j] <- mean(arr[,j],na.rm=TRUE)
arr.sd[j] <- sd(arr[,j],na.rm=TRUE)
arr.range[j] <- max(arr[,j],na.rm=TRUE) - min(arr[,j],na.rm=TRUE)
}
arr.mean
arr.sd
arr.range
(lm1 <- lm(arr.sd~arr.mean))
(lnlm1 <- lm(log(arr.sd)~log(arr.mean)))
(lm2 <- lm(arr.range~arr.mean))
bitmap(file='test1.png')
plot(arr.mean,arr.sd,main='Standard Deviation-Mean Plot',xlab='mean',ylab='standard deviation')
dev.off()
bitmap(file='test2.png')
plot(arr.mean,arr.range,main='Range-Mean Plot',xlab='mean',ylab='range')
dev.off()
load(file='createtable')
a<-table.start()
a<-table.row.start(a)
a<-table.element(a,'Standard Deviation-Mean Plot',4,TRUE)
a<-table.row.end(a)
a<-table.row.start(a)
a<-table.element(a,'Section',header=TRUE)
a<-table.element(a,'Mean',header=TRUE)
a<-table.element(a,'Standard Deviation',header=TRUE)
a<-table.element(a,'Range',header=TRUE)
a<-table.row.end(a)
for (j in 1:np) {
a<-table.row.start(a)
a<-table.element(a,j,header=TRUE)
a<-table.element(a,arr.mean[j])
a<-table.element(a,arr.sd[j] )
a<-table.element(a,arr.range[j] )
a<-table.row.end(a)
}
a<-table.end(a)
table.save(a,file='mytable.tab')
a<-table.start()
a<-table.row.start(a)
a<-table.element(a,'Regression: S.E.(k) = alpha + beta * Mean(k)',2,TRUE)
a<-table.row.end(a)
a<-table.row.start(a)
a<-table.element(a,'alpha',header=TRUE)
a<-table.element(a,lm1$coefficients[[1]])
a<-table.row.end(a)
a<-table.row.start(a)
a<-table.element(a,'beta',header=TRUE)
a<-table.element(a,lm1$coefficients[[2]])
a<-table.row.end(a)
a<-table.row.start(a)
a<-table.element(a,'S.D.',header=TRUE)
a<-table.element(a,summary(lm1)$coefficients[2,2])
a<-table.row.end(a)
a<-table.row.start(a)
a<-table.element(a,'T-STAT',header=TRUE)
a<-table.element(a,summary(lm1)$coefficients[2,3])
a<-table.row.end(a)
a<-table.row.start(a)
a<-table.element(a,'p-value',header=TRUE)
a<-table.element(a,summary(lm1)$coefficients[2,4])
a<-table.row.end(a)
a<-table.end(a)
table.save(a,file='mytable1.tab')
a<-table.start()
a<-table.row.start(a)
a<-table.element(a,'Regression: ln S.E.(k) = alpha + beta * ln Mean(k)',2,TRUE)
a<-table.row.end(a)
a<-table.row.start(a)
a<-table.element(a,'alpha',header=TRUE)
a<-table.element(a,lnlm1$coefficients[[1]])
a<-table.row.end(a)
a<-table.row.start(a)
a<-table.element(a,'beta',header=TRUE)
a<-table.element(a,lnlm1$coefficients[[2]])
a<-table.row.end(a)
a<-table.row.start(a)
a<-table.element(a,'S.D.',header=TRUE)
a<-table.element(a,summary(lnlm1)$coefficients[2,2])
a<-table.row.end(a)
a<-table.row.start(a)
a<-table.element(a,'T-STAT',header=TRUE)
a<-table.element(a,summary(lnlm1)$coefficients[2,3])
a<-table.row.end(a)
a<-table.row.start(a)
a<-table.element(a,'p-value',header=TRUE)
a<-table.element(a,summary(lnlm1)$coefficients[2,4])
a<-table.row.end(a)
a<-table.row.start(a)
a<-table.element(a,'Lambda',header=TRUE)
a<-table.element(a,1-lnlm1$coefficients[[2]])
a<-table.row.end(a)
a<-table.end(a)
table.save(a,file='mytable2.tab')