Free Statistics

of Irreproducible Research!

Author's title

Author*Unverified author*
R Software Modulerwasp_smp.wasp
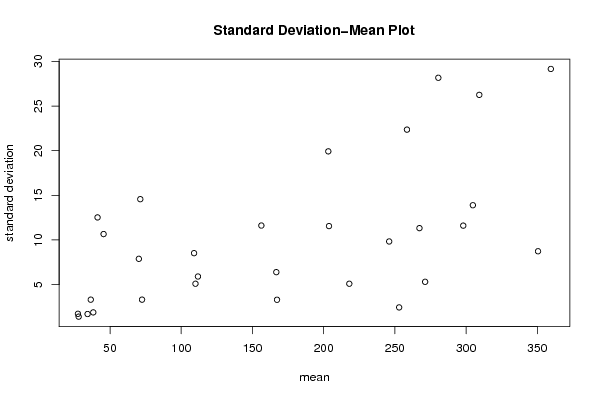
Title produced by softwareStandard Deviation-Mean Plot
Date of computationMon, 16 Aug 2010 13:38:50 +0000
Cite this page as followsStatistical Computations at FreeStatistics.org, Office for Research Development and Education, URL https://freestatistics.org/blog/index.php?v=date/2010/Aug/16/t1281965911c2s7wymgck6lc42.htm/, Retrieved Thu, 16 May 2024 22:53:38 +0000
Statistical Computations at FreeStatistics.org, Office for Research Development and Education, URL https://freestatistics.org/blog/index.php?pk=78992, Retrieved Thu, 16 May 2024 22:53:38 +0000
QR Codes:

Original text written by user:
IsPrivate?No (this computation is public)
User-defined keywordsJeroen_Kinne
Estimated Impact109
Family? (F = Feedback message, R = changed R code, M = changed R Module, P = changed Parameters, D = changed Data)
-       [Standard Deviation-Mean Plot] [standard_Deviatio...] [2010-08-16 13:38:50] [6fe3b5976049c9b6736c06f51fce3033] [Current]
Feedback Forum

Post a new message
Dataseries X:
36
35
34
32
52
51
36
26
27
27
28
30
28
29
25
28
55
53
42
32
37
41
37
38
39
32
36
39
83
83
66
53
72
77
69
72
81
71
63
66
114
116
109
97
111
120
110
106
115
110
103
112
163
166
156
140
166
176
163
162
171
167
163
168
222
216
197
178
204
220
196
195
213
218
216
225
280
272
252
230
248
259
240
237
252
250
255
255
313
291
271
247
268
283
259
259
267
270
279
269
334
326
301
276
301
313
291
287
289
298
320
312
385
380
351
322
350
363
344
345


Summary of computational transaction
Raw Inputview raw input (R code)
Raw Outputview raw output of R engine
Computing time1 seconds
R Server'Gwilym Jenkins' @ 72.249.127.135

\begin{tabular}{lllllllll}
\hline
Summary of computational transaction \tabularnewline
Raw Input & view raw input (R code)  \tabularnewline
Raw Output & view raw output of R engine  \tabularnewline
Computing time & 1 seconds \tabularnewline
R Server & 'Gwilym Jenkins' @ 72.249.127.135 \tabularnewline
\hline
\end{tabular}
%Source: https://freestatistics.org/blog/index.php?pk=78992&T=0

[TABLE]
[ROW][C]Summary of computational transaction[/C][/ROW]
[ROW][C]Raw Input[/C][C]view raw input (R code) [/C][/ROW]
[ROW][C]Raw Output[/C][C]view raw output of R engine [/C][/ROW]
[ROW][C]Computing time[/C][C]1 seconds[/C][/ROW]
[ROW][C]R Server[/C][C]'Gwilym Jenkins' @ 72.249.127.135[/C][/ROW]
[/TABLE]
Source: https://freestatistics.org/blog/index.php?pk=78992&T=0

Globally Unique Identifier (entire table): ba.freestatistics.org/blog/index.php?pk=78992&T=0

As an alternative you can also use a QR Code:  

The GUIDs for individual cells are displayed in the table below:

Summary of computational transaction
Raw Inputview raw input (R code)
Raw Outputview raw output of R engine
Computing time1 seconds
R Server'Gwilym Jenkins' @ 72.249.127.135


Standard Deviation-Mean Plot
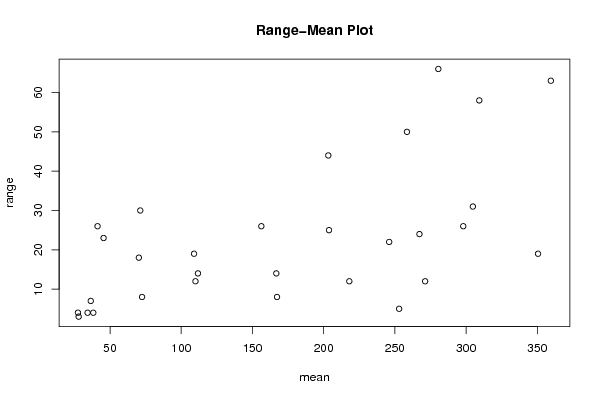
SectionMeanStandard DeviationRange
134.251.707825127659934
241.2512.526638282742426
3281.414213562373103
427.51.732050807568884
545.510.661457061146323
638.251.892969448600094
736.53.31662479035547
871.2514.568802284333530
972.53.31662479035548
1070.257.8898669190297518
111098.5244745683629519
12111.755.9090326337452814
131105.0990195135927812
14156.2511.615363389350626
15166.756.3966136874651614
16167.253.304037933599838
17203.2519.922767545365444
18203.7511.557825631723925
192185.0990195135927812
20258.522.353224972398650
212469.8319208025017522
222532.449489742783185
23280.528.160255680657466
24267.2511.324751652906124
25271.255.3150729063673212
26309.2526.247222075234358
2729811.604596790352826
28304.7513.889444433333831
29359.529.149042294158963
30350.58.736894948054119

\begin{tabular}{lllllllll}
\hline
Standard Deviation-Mean Plot \tabularnewline
Section & Mean & Standard Deviation & Range \tabularnewline
1 & 34.25 & 1.70782512765993 & 4 \tabularnewline
2 & 41.25 & 12.5266382827424 & 26 \tabularnewline
3 & 28 & 1.41421356237310 & 3 \tabularnewline
4 & 27.5 & 1.73205080756888 & 4 \tabularnewline
5 & 45.5 & 10.6614570611463 & 23 \tabularnewline
6 & 38.25 & 1.89296944860009 & 4 \tabularnewline
7 & 36.5 & 3.3166247903554 & 7 \tabularnewline
8 & 71.25 & 14.5688022843335 & 30 \tabularnewline
9 & 72.5 & 3.3166247903554 & 8 \tabularnewline
10 & 70.25 & 7.88986691902975 & 18 \tabularnewline
11 & 109 & 8.52447456836295 & 19 \tabularnewline
12 & 111.75 & 5.90903263374528 & 14 \tabularnewline
13 & 110 & 5.09901951359278 & 12 \tabularnewline
14 & 156.25 & 11.6153633893506 & 26 \tabularnewline
15 & 166.75 & 6.39661368746516 & 14 \tabularnewline
16 & 167.25 & 3.30403793359983 & 8 \tabularnewline
17 & 203.25 & 19.9227675453654 & 44 \tabularnewline
18 & 203.75 & 11.5578256317239 & 25 \tabularnewline
19 & 218 & 5.09901951359278 & 12 \tabularnewline
20 & 258.5 & 22.3532249723986 & 50 \tabularnewline
21 & 246 & 9.83192080250175 & 22 \tabularnewline
22 & 253 & 2.44948974278318 & 5 \tabularnewline
23 & 280.5 & 28.1602556806574 & 66 \tabularnewline
24 & 267.25 & 11.3247516529061 & 24 \tabularnewline
25 & 271.25 & 5.31507290636732 & 12 \tabularnewline
26 & 309.25 & 26.2472220752343 & 58 \tabularnewline
27 & 298 & 11.6045967903528 & 26 \tabularnewline
28 & 304.75 & 13.8894444333338 & 31 \tabularnewline
29 & 359.5 & 29.1490422941589 & 63 \tabularnewline
30 & 350.5 & 8.7368949480541 & 19 \tabularnewline
\hline
\end{tabular}
%Source: https://freestatistics.org/blog/index.php?pk=78992&T=1

[TABLE]
[ROW][C]Standard Deviation-Mean Plot[/C][/ROW]
[ROW][C]Section[/C][C]Mean[/C][C]Standard Deviation[/C][C]Range[/C][/ROW]
[ROW][C]1[/C][C]34.25[/C][C]1.70782512765993[/C][C]4[/C][/ROW]
[ROW][C]2[/C][C]41.25[/C][C]12.5266382827424[/C][C]26[/C][/ROW]
[ROW][C]3[/C][C]28[/C][C]1.41421356237310[/C][C]3[/C][/ROW]
[ROW][C]4[/C][C]27.5[/C][C]1.73205080756888[/C][C]4[/C][/ROW]
[ROW][C]5[/C][C]45.5[/C][C]10.6614570611463[/C][C]23[/C][/ROW]
[ROW][C]6[/C][C]38.25[/C][C]1.89296944860009[/C][C]4[/C][/ROW]
[ROW][C]7[/C][C]36.5[/C][C]3.3166247903554[/C][C]7[/C][/ROW]
[ROW][C]8[/C][C]71.25[/C][C]14.5688022843335[/C][C]30[/C][/ROW]
[ROW][C]9[/C][C]72.5[/C][C]3.3166247903554[/C][C]8[/C][/ROW]
[ROW][C]10[/C][C]70.25[/C][C]7.88986691902975[/C][C]18[/C][/ROW]
[ROW][C]11[/C][C]109[/C][C]8.52447456836295[/C][C]19[/C][/ROW]
[ROW][C]12[/C][C]111.75[/C][C]5.90903263374528[/C][C]14[/C][/ROW]
[ROW][C]13[/C][C]110[/C][C]5.09901951359278[/C][C]12[/C][/ROW]
[ROW][C]14[/C][C]156.25[/C][C]11.6153633893506[/C][C]26[/C][/ROW]
[ROW][C]15[/C][C]166.75[/C][C]6.39661368746516[/C][C]14[/C][/ROW]
[ROW][C]16[/C][C]167.25[/C][C]3.30403793359983[/C][C]8[/C][/ROW]
[ROW][C]17[/C][C]203.25[/C][C]19.9227675453654[/C][C]44[/C][/ROW]
[ROW][C]18[/C][C]203.75[/C][C]11.5578256317239[/C][C]25[/C][/ROW]
[ROW][C]19[/C][C]218[/C][C]5.09901951359278[/C][C]12[/C][/ROW]
[ROW][C]20[/C][C]258.5[/C][C]22.3532249723986[/C][C]50[/C][/ROW]
[ROW][C]21[/C][C]246[/C][C]9.83192080250175[/C][C]22[/C][/ROW]
[ROW][C]22[/C][C]253[/C][C]2.44948974278318[/C][C]5[/C][/ROW]
[ROW][C]23[/C][C]280.5[/C][C]28.1602556806574[/C][C]66[/C][/ROW]
[ROW][C]24[/C][C]267.25[/C][C]11.3247516529061[/C][C]24[/C][/ROW]
[ROW][C]25[/C][C]271.25[/C][C]5.31507290636732[/C][C]12[/C][/ROW]
[ROW][C]26[/C][C]309.25[/C][C]26.2472220752343[/C][C]58[/C][/ROW]
[ROW][C]27[/C][C]298[/C][C]11.6045967903528[/C][C]26[/C][/ROW]
[ROW][C]28[/C][C]304.75[/C][C]13.8894444333338[/C][C]31[/C][/ROW]
[ROW][C]29[/C][C]359.5[/C][C]29.1490422941589[/C][C]63[/C][/ROW]
[ROW][C]30[/C][C]350.5[/C][C]8.7368949480541[/C][C]19[/C][/ROW]
[/TABLE]
Source: https://freestatistics.org/blog/index.php?pk=78992&T=1

Globally Unique Identifier (entire table): ba.freestatistics.org/blog/index.php?pk=78992&T=1

As an alternative you can also use a QR Code:  

The GUIDs for individual cells are displayed in the table below:

Standard Deviation-Mean Plot
SectionMeanStandard DeviationRange
134.251.707825127659934
241.2512.526638282742426
3281.414213562373103
427.51.732050807568884
545.510.661457061146323
638.251.892969448600094
736.53.31662479035547
871.2514.568802284333530
972.53.31662479035548
1070.257.8898669190297518
111098.5244745683629519
12111.755.9090326337452814
131105.0990195135927812
14156.2511.615363389350626
15166.756.3966136874651614
16167.253.304037933599838
17203.2519.922767545365444
18203.7511.557825631723925
192185.0990195135927812
20258.522.353224972398650
212469.8319208025017522
222532.449489742783185
23280.528.160255680657466
24267.2511.324751652906124
25271.255.3150729063673212
26309.2526.247222075234358
2729811.604596790352826
28304.7513.889444433333831
29359.529.149042294158963
30350.58.736894948054119


Regression: S.E.(k) = alpha + beta * Mean(k)
alpha2.90611321242171
beta0.0427288511995813
S.D.0.0111685176842500
T-STAT3.82583010633882
p-value0.000668989676680618

\begin{tabular}{lllllllll}
\hline
Regression: S.E.(k) = alpha + beta * Mean(k) \tabularnewline
alpha & 2.90611321242171 \tabularnewline
beta & 0.0427288511995813 \tabularnewline
S.D. & 0.0111685176842500 \tabularnewline
T-STAT & 3.82583010633882 \tabularnewline
p-value & 0.000668989676680618 \tabularnewline
\hline
\end{tabular}
%Source: https://freestatistics.org/blog/index.php?pk=78992&T=2

[TABLE]
[ROW][C]Regression: S.E.(k) = alpha + beta * Mean(k)[/C][/ROW]
[ROW][C]alpha[/C][C]2.90611321242171[/C][/ROW]
[ROW][C]beta[/C][C]0.0427288511995813[/C][/ROW]
[ROW][C]S.D.[/C][C]0.0111685176842500[/C][/ROW]
[ROW][C]T-STAT[/C][C]3.82583010633882[/C][/ROW]
[ROW][C]p-value[/C][C]0.000668989676680618[/C][/ROW]
[/TABLE]
Source: https://freestatistics.org/blog/index.php?pk=78992&T=2

Globally Unique Identifier (entire table): ba.freestatistics.org/blog/index.php?pk=78992&T=2

As an alternative you can also use a QR Code:  

The GUIDs for individual cells are displayed in the table below:

Regression: S.E.(k) = alpha + beta * Mean(k)
alpha2.90611321242171
beta0.0427288511995813
S.D.0.0111685176842500
T-STAT3.82583010633882
p-value0.000668989676680618


Regression: ln S.E.(k) = alpha + beta * ln Mean(k)
alpha-1.13593946279489
beta0.645538194601525
S.D.0.149546636616888
T-STAT4.31663465795811
p-value0.00017885129120927
Lambda0.354461805398475

\begin{tabular}{lllllllll}
\hline
Regression: ln S.E.(k) = alpha + beta * ln Mean(k) \tabularnewline
alpha & -1.13593946279489 \tabularnewline
beta & 0.645538194601525 \tabularnewline
S.D. & 0.149546636616888 \tabularnewline
T-STAT & 4.31663465795811 \tabularnewline
p-value & 0.00017885129120927 \tabularnewline
Lambda & 0.354461805398475 \tabularnewline
\hline
\end{tabular}
%Source: https://freestatistics.org/blog/index.php?pk=78992&T=3

[TABLE]
[ROW][C]Regression: ln S.E.(k) = alpha + beta * ln Mean(k)[/C][/ROW]
[ROW][C]alpha[/C][C]-1.13593946279489[/C][/ROW]
[ROW][C]beta[/C][C]0.645538194601525[/C][/ROW]
[ROW][C]S.D.[/C][C]0.149546636616888[/C][/ROW]
[ROW][C]T-STAT[/C][C]4.31663465795811[/C][/ROW]
[ROW][C]p-value[/C][C]0.00017885129120927[/C][/ROW]
[ROW][C]Lambda[/C][C]0.354461805398475[/C][/ROW]
[/TABLE]
Source: https://freestatistics.org/blog/index.php?pk=78992&T=3

Globally Unique Identifier (entire table): ba.freestatistics.org/blog/index.php?pk=78992&T=3

As an alternative you can also use a QR Code:  

The GUIDs for individual cells are displayed in the table below:

Regression: ln S.E.(k) = alpha + beta * ln Mean(k)
alpha-1.13593946279489
beta0.645538194601525
S.D.0.149546636616888
T-STAT4.31663465795811
p-value0.00017885129120927
Lambda0.354461805398475


Parameters (Session):
par1 = 4 ;
Parameters (R input):
par1 = 4 ;
R code (references can be found in the software module):
par1 <- as.numeric(par1)
(n <- length(x))
(np <- floor(n / par1))
arr <- array(NA,dim=c(par1,np))
j <- 0
k <- 1
for (i in 1:(np*par1))
{
j = j + 1
arr[j,k] <- x[i]
if (j == par1) {
j = 0
k=k+1
}
}
arr
arr.mean <- array(NA,dim=np)
arr.sd <- array(NA,dim=np)
arr.range <- array(NA,dim=np)
for (j in 1:np)
{
arr.mean[j] <- mean(arr[,j],na.rm=TRUE)
arr.sd[j] <- sd(arr[,j],na.rm=TRUE)
arr.range[j] <- max(arr[,j],na.rm=TRUE) - min(arr[,j],na.rm=TRUE)
}
arr.mean
arr.sd
arr.range
(lm1 <- lm(arr.sd~arr.mean))
(lnlm1 <- lm(log(arr.sd)~log(arr.mean)))
(lm2 <- lm(arr.range~arr.mean))
bitmap(file='test1.png')
plot(arr.mean,arr.sd,main='Standard Deviation-Mean Plot',xlab='mean',ylab='standard deviation')
dev.off()
bitmap(file='test2.png')
plot(arr.mean,arr.range,main='Range-Mean Plot',xlab='mean',ylab='range')
dev.off()
load(file='createtable')
a<-table.start()
a<-table.row.start(a)
a<-table.element(a,'Standard Deviation-Mean Plot',4,TRUE)
a<-table.row.end(a)
a<-table.row.start(a)
a<-table.element(a,'Section',header=TRUE)
a<-table.element(a,'Mean',header=TRUE)
a<-table.element(a,'Standard Deviation',header=TRUE)
a<-table.element(a,'Range',header=TRUE)
a<-table.row.end(a)
for (j in 1:np) {
a<-table.row.start(a)
a<-table.element(a,j,header=TRUE)
a<-table.element(a,arr.mean[j])
a<-table.element(a,arr.sd[j] )
a<-table.element(a,arr.range[j] )
a<-table.row.end(a)
}
a<-table.end(a)
table.save(a,file='mytable.tab')
a<-table.start()
a<-table.row.start(a)
a<-table.element(a,'Regression: S.E.(k) = alpha + beta * Mean(k)',2,TRUE)
a<-table.row.end(a)
a<-table.row.start(a)
a<-table.element(a,'alpha',header=TRUE)
a<-table.element(a,lm1$coefficients[[1]])
a<-table.row.end(a)
a<-table.row.start(a)
a<-table.element(a,'beta',header=TRUE)
a<-table.element(a,lm1$coefficients[[2]])
a<-table.row.end(a)
a<-table.row.start(a)
a<-table.element(a,'S.D.',header=TRUE)
a<-table.element(a,summary(lm1)$coefficients[2,2])
a<-table.row.end(a)
a<-table.row.start(a)
a<-table.element(a,'T-STAT',header=TRUE)
a<-table.element(a,summary(lm1)$coefficients[2,3])
a<-table.row.end(a)
a<-table.row.start(a)
a<-table.element(a,'p-value',header=TRUE)
a<-table.element(a,summary(lm1)$coefficients[2,4])
a<-table.row.end(a)
a<-table.end(a)
table.save(a,file='mytable1.tab')
a<-table.start()
a<-table.row.start(a)
a<-table.element(a,'Regression: ln S.E.(k) = alpha + beta * ln Mean(k)',2,TRUE)
a<-table.row.end(a)
a<-table.row.start(a)
a<-table.element(a,'alpha',header=TRUE)
a<-table.element(a,lnlm1$coefficients[[1]])
a<-table.row.end(a)
a<-table.row.start(a)
a<-table.element(a,'beta',header=TRUE)
a<-table.element(a,lnlm1$coefficients[[2]])
a<-table.row.end(a)
a<-table.row.start(a)
a<-table.element(a,'S.D.',header=TRUE)
a<-table.element(a,summary(lnlm1)$coefficients[2,2])
a<-table.row.end(a)
a<-table.row.start(a)
a<-table.element(a,'T-STAT',header=TRUE)
a<-table.element(a,summary(lnlm1)$coefficients[2,3])
a<-table.row.end(a)
a<-table.row.start(a)
a<-table.element(a,'p-value',header=TRUE)
a<-table.element(a,summary(lnlm1)$coefficients[2,4])
a<-table.row.end(a)
a<-table.row.start(a)
a<-table.element(a,'Lambda',header=TRUE)
a<-table.element(a,1-lnlm1$coefficients[[2]])
a<-table.row.end(a)
a<-table.end(a)
table.save(a,file='mytable2.tab')