Free Statistics

of Irreproducible Research!

Author's title

Author*Unverified author*
R Software Modulerwasp_smp.wasp
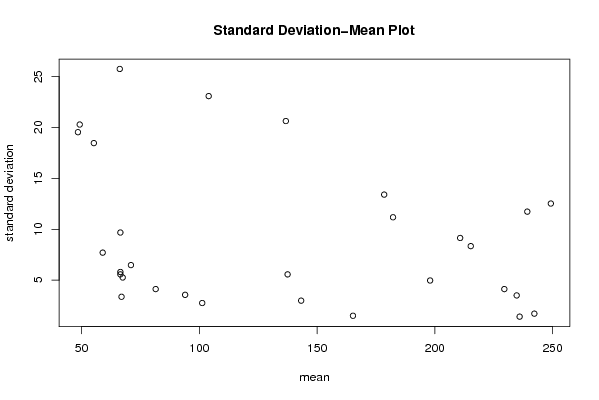
Title produced by softwareStandard Deviation-Mean Plot
Date of computationMon, 16 Aug 2010 12:59:21 +0000
Cite this page as followsStatistical Computations at FreeStatistics.org, Office for Research Development and Education, URL https://freestatistics.org/blog/index.php?v=date/2010/Aug/16/t128196357015isgukox3qn5wl.htm/, Retrieved Thu, 16 May 2024 05:07:17 +0000
Statistical Computations at FreeStatistics.org, Office for Research Development and Education, URL https://freestatistics.org/blog/index.php?pk=78979, Retrieved Thu, 16 May 2024 05:07:17 +0000
QR Codes:

Original text written by user:
IsPrivate?No (this computation is public)
User-defined keywords
Estimated Impact112
Family? (F = Feedback message, R = changed R code, M = changed R Module, P = changed Parameters, D = changed Data)
-       [Standard Deviation-Mean Plot] [Standard Deviatio...] [2010-08-16 12:59:21] [d41d8cd98f00b204e9800998ecf8427e] [Current]
Feedback Forum

Post a new message
Dataseries X:
244
243
242
240
260
259
244
234
235
235
236
238
240
233
233
233
247
251
233
226
233
233
227
225
223
212
206
202
223
221
212
205
204
200
195
193
196
180
174
164
192
189
181
167
166
164
167
164
161
141
134
111
147
144
142
140
143
137
140
130
129
112
101
74
104
103
100
98
99
91
92
94
93
76
64
32
62
69
69
68
68
59
66
73
70
57
48
22
64
74
67
61
61
52
54
69
69
53
50
22
69
78
74
63
67
59
60
80
77
58
54
32
78
86
84
78
72
64
62
72


Summary of computational transaction
Raw Inputview raw input (R code)
Raw Outputview raw output of R engine
Computing time1 seconds
R Server'Gwilym Jenkins' @ 72.249.127.135

\begin{tabular}{lllllllll}
\hline
Summary of computational transaction \tabularnewline
Raw Input & view raw input (R code)  \tabularnewline
Raw Output & view raw output of R engine  \tabularnewline
Computing time & 1 seconds \tabularnewline
R Server & 'Gwilym Jenkins' @ 72.249.127.135 \tabularnewline
\hline
\end{tabular}
%Source: https://freestatistics.org/blog/index.php?pk=78979&T=0

[TABLE]
[ROW][C]Summary of computational transaction[/C][/ROW]
[ROW][C]Raw Input[/C][C]view raw input (R code) [/C][/ROW]
[ROW][C]Raw Output[/C][C]view raw output of R engine [/C][/ROW]
[ROW][C]Computing time[/C][C]1 seconds[/C][/ROW]
[ROW][C]R Server[/C][C]'Gwilym Jenkins' @ 72.249.127.135[/C][/ROW]
[/TABLE]
Source: https://freestatistics.org/blog/index.php?pk=78979&T=0

Globally Unique Identifier (entire table): ba.freestatistics.org/blog/index.php?pk=78979&T=0

As an alternative you can also use a QR Code:  

The GUIDs for individual cells are displayed in the table below:

Summary of computational transaction
Raw Inputview raw input (R code)
Raw Outputview raw output of R engine
Computing time1 seconds
R Server'Gwilym Jenkins' @ 72.249.127.135


Standard Deviation-Mean Plot
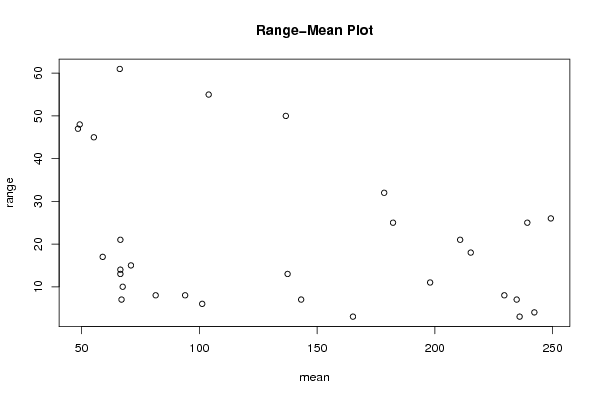
SectionMeanStandard DeviationRange
1242.251.707825127659934
2249.2512.526638282742426
32361.414213562373103
4234.753.57
5239.2511.729592206608625
6229.54.123105625617668
7210.759.1423921012683221
8215.258.3416625041614718
91984.9665548085837811
10178.513.403979508588732
11182.2511.176612486199325
12165.251.53
13136.7520.629671188202050
14143.252.986078811194827
15137.55.5677643628300213
1610423.07957249748555
17101.252.753785273643056
18943.559026084010448
1966.2525.747168129071361
20673.366501646120697
2166.55.802298395176414
2249.2520.287516687197948
2366.55.5677643628300213
24597.702813338860917
2548.519.536291016123547
26716.4807406984078615
2766.59.6781540939719821
2855.2518.463928798245245
2981.54.123105625617668
3067.55.2599112793531710

\begin{tabular}{lllllllll}
\hline
Standard Deviation-Mean Plot \tabularnewline
Section & Mean & Standard Deviation & Range \tabularnewline
1 & 242.25 & 1.70782512765993 & 4 \tabularnewline
2 & 249.25 & 12.5266382827424 & 26 \tabularnewline
3 & 236 & 1.41421356237310 & 3 \tabularnewline
4 & 234.75 & 3.5 & 7 \tabularnewline
5 & 239.25 & 11.7295922066086 & 25 \tabularnewline
6 & 229.5 & 4.12310562561766 & 8 \tabularnewline
7 & 210.75 & 9.14239210126832 & 21 \tabularnewline
8 & 215.25 & 8.34166250416147 & 18 \tabularnewline
9 & 198 & 4.96655480858378 & 11 \tabularnewline
10 & 178.5 & 13.4039795085887 & 32 \tabularnewline
11 & 182.25 & 11.1766124861993 & 25 \tabularnewline
12 & 165.25 & 1.5 & 3 \tabularnewline
13 & 136.75 & 20.6296711882020 & 50 \tabularnewline
14 & 143.25 & 2.98607881119482 & 7 \tabularnewline
15 & 137.5 & 5.56776436283002 & 13 \tabularnewline
16 & 104 & 23.079572497485 & 55 \tabularnewline
17 & 101.25 & 2.75378527364305 & 6 \tabularnewline
18 & 94 & 3.55902608401044 & 8 \tabularnewline
19 & 66.25 & 25.7471681290713 & 61 \tabularnewline
20 & 67 & 3.36650164612069 & 7 \tabularnewline
21 & 66.5 & 5.8022983951764 & 14 \tabularnewline
22 & 49.25 & 20.2875166871979 & 48 \tabularnewline
23 & 66.5 & 5.56776436283002 & 13 \tabularnewline
24 & 59 & 7.7028133388609 & 17 \tabularnewline
25 & 48.5 & 19.5362910161235 & 47 \tabularnewline
26 & 71 & 6.48074069840786 & 15 \tabularnewline
27 & 66.5 & 9.67815409397198 & 21 \tabularnewline
28 & 55.25 & 18.4639287982452 & 45 \tabularnewline
29 & 81.5 & 4.12310562561766 & 8 \tabularnewline
30 & 67.5 & 5.25991127935317 & 10 \tabularnewline
\hline
\end{tabular}
%Source: https://freestatistics.org/blog/index.php?pk=78979&T=1

[TABLE]
[ROW][C]Standard Deviation-Mean Plot[/C][/ROW]
[ROW][C]Section[/C][C]Mean[/C][C]Standard Deviation[/C][C]Range[/C][/ROW]
[ROW][C]1[/C][C]242.25[/C][C]1.70782512765993[/C][C]4[/C][/ROW]
[ROW][C]2[/C][C]249.25[/C][C]12.5266382827424[/C][C]26[/C][/ROW]
[ROW][C]3[/C][C]236[/C][C]1.41421356237310[/C][C]3[/C][/ROW]
[ROW][C]4[/C][C]234.75[/C][C]3.5[/C][C]7[/C][/ROW]
[ROW][C]5[/C][C]239.25[/C][C]11.7295922066086[/C][C]25[/C][/ROW]
[ROW][C]6[/C][C]229.5[/C][C]4.12310562561766[/C][C]8[/C][/ROW]
[ROW][C]7[/C][C]210.75[/C][C]9.14239210126832[/C][C]21[/C][/ROW]
[ROW][C]8[/C][C]215.25[/C][C]8.34166250416147[/C][C]18[/C][/ROW]
[ROW][C]9[/C][C]198[/C][C]4.96655480858378[/C][C]11[/C][/ROW]
[ROW][C]10[/C][C]178.5[/C][C]13.4039795085887[/C][C]32[/C][/ROW]
[ROW][C]11[/C][C]182.25[/C][C]11.1766124861993[/C][C]25[/C][/ROW]
[ROW][C]12[/C][C]165.25[/C][C]1.5[/C][C]3[/C][/ROW]
[ROW][C]13[/C][C]136.75[/C][C]20.6296711882020[/C][C]50[/C][/ROW]
[ROW][C]14[/C][C]143.25[/C][C]2.98607881119482[/C][C]7[/C][/ROW]
[ROW][C]15[/C][C]137.5[/C][C]5.56776436283002[/C][C]13[/C][/ROW]
[ROW][C]16[/C][C]104[/C][C]23.079572497485[/C][C]55[/C][/ROW]
[ROW][C]17[/C][C]101.25[/C][C]2.75378527364305[/C][C]6[/C][/ROW]
[ROW][C]18[/C][C]94[/C][C]3.55902608401044[/C][C]8[/C][/ROW]
[ROW][C]19[/C][C]66.25[/C][C]25.7471681290713[/C][C]61[/C][/ROW]
[ROW][C]20[/C][C]67[/C][C]3.36650164612069[/C][C]7[/C][/ROW]
[ROW][C]21[/C][C]66.5[/C][C]5.8022983951764[/C][C]14[/C][/ROW]
[ROW][C]22[/C][C]49.25[/C][C]20.2875166871979[/C][C]48[/C][/ROW]
[ROW][C]23[/C][C]66.5[/C][C]5.56776436283002[/C][C]13[/C][/ROW]
[ROW][C]24[/C][C]59[/C][C]7.7028133388609[/C][C]17[/C][/ROW]
[ROW][C]25[/C][C]48.5[/C][C]19.5362910161235[/C][C]47[/C][/ROW]
[ROW][C]26[/C][C]71[/C][C]6.48074069840786[/C][C]15[/C][/ROW]
[ROW][C]27[/C][C]66.5[/C][C]9.67815409397198[/C][C]21[/C][/ROW]
[ROW][C]28[/C][C]55.25[/C][C]18.4639287982452[/C][C]45[/C][/ROW]
[ROW][C]29[/C][C]81.5[/C][C]4.12310562561766[/C][C]8[/C][/ROW]
[ROW][C]30[/C][C]67.5[/C][C]5.25991127935317[/C][C]10[/C][/ROW]
[/TABLE]
Source: https://freestatistics.org/blog/index.php?pk=78979&T=1

Globally Unique Identifier (entire table): ba.freestatistics.org/blog/index.php?pk=78979&T=1

As an alternative you can also use a QR Code:  

The GUIDs for individual cells are displayed in the table below:

Standard Deviation-Mean Plot
SectionMeanStandard DeviationRange
1242.251.707825127659934
2249.2512.526638282742426
32361.414213562373103
4234.753.57
5239.2511.729592206608625
6229.54.123105625617668
7210.759.1423921012683221
8215.258.3416625041614718
91984.9665548085837811
10178.513.403979508588732
11182.2511.176612486199325
12165.251.53
13136.7520.629671188202050
14143.252.986078811194827
15137.55.5677643628300213
1610423.07957249748555
17101.252.753785273643056
18943.559026084010448
1966.2525.747168129071361
20673.366501646120697
2166.55.802298395176414
2249.2520.287516687197948
2366.55.5677643628300213
24597.702813338860917
2548.519.536291016123547
26716.4807406984078615
2766.59.6781540939719821
2855.2518.463928798245245
2981.54.123105625617668
3067.55.2599112793531710


Regression: S.E.(k) = alpha + beta * Mean(k)
alpha13.0378963627019
beta-0.0288030085855783
S.D.0.0176026505504006
T-STAT-1.63628815462242
p-value0.112972132068010

\begin{tabular}{lllllllll}
\hline
Regression: S.E.(k) = alpha + beta * Mean(k) \tabularnewline
alpha & 13.0378963627019 \tabularnewline
beta & -0.0288030085855783 \tabularnewline
S.D. & 0.0176026505504006 \tabularnewline
T-STAT & -1.63628815462242 \tabularnewline
p-value & 0.112972132068010 \tabularnewline
\hline
\end{tabular}
%Source: https://freestatistics.org/blog/index.php?pk=78979&T=2

[TABLE]
[ROW][C]Regression: S.E.(k) = alpha + beta * Mean(k)[/C][/ROW]
[ROW][C]alpha[/C][C]13.0378963627019[/C][/ROW]
[ROW][C]beta[/C][C]-0.0288030085855783[/C][/ROW]
[ROW][C]S.D.[/C][C]0.0176026505504006[/C][/ROW]
[ROW][C]T-STAT[/C][C]-1.63628815462242[/C][/ROW]
[ROW][C]p-value[/C][C]0.112972132068010[/C][/ROW]
[/TABLE]
Source: https://freestatistics.org/blog/index.php?pk=78979&T=2

Globally Unique Identifier (entire table): ba.freestatistics.org/blog/index.php?pk=78979&T=2

As an alternative you can also use a QR Code:  

The GUIDs for individual cells are displayed in the table below:

Regression: S.E.(k) = alpha + beta * Mean(k)
alpha13.0378963627019
beta-0.0288030085855783
S.D.0.0176026505504006
T-STAT-1.63628815462242
p-value0.112972132068010


Regression: ln S.E.(k) = alpha + beta * ln Mean(k)
alpha4.18304937583329
beta-0.478264612426929
S.D.0.256356069732124
T-STAT-1.8656262476121
p-value0.0726032769100583
Lambda1.47826461242693

\begin{tabular}{lllllllll}
\hline
Regression: ln S.E.(k) = alpha + beta * ln Mean(k) \tabularnewline
alpha & 4.18304937583329 \tabularnewline
beta & -0.478264612426929 \tabularnewline
S.D. & 0.256356069732124 \tabularnewline
T-STAT & -1.8656262476121 \tabularnewline
p-value & 0.0726032769100583 \tabularnewline
Lambda & 1.47826461242693 \tabularnewline
\hline
\end{tabular}
%Source: https://freestatistics.org/blog/index.php?pk=78979&T=3

[TABLE]
[ROW][C]Regression: ln S.E.(k) = alpha + beta * ln Mean(k)[/C][/ROW]
[ROW][C]alpha[/C][C]4.18304937583329[/C][/ROW]
[ROW][C]beta[/C][C]-0.478264612426929[/C][/ROW]
[ROW][C]S.D.[/C][C]0.256356069732124[/C][/ROW]
[ROW][C]T-STAT[/C][C]-1.8656262476121[/C][/ROW]
[ROW][C]p-value[/C][C]0.0726032769100583[/C][/ROW]
[ROW][C]Lambda[/C][C]1.47826461242693[/C][/ROW]
[/TABLE]
Source: https://freestatistics.org/blog/index.php?pk=78979&T=3

Globally Unique Identifier (entire table): ba.freestatistics.org/blog/index.php?pk=78979&T=3

As an alternative you can also use a QR Code:  

The GUIDs for individual cells are displayed in the table below:

Regression: ln S.E.(k) = alpha + beta * ln Mean(k)
alpha4.18304937583329
beta-0.478264612426929
S.D.0.256356069732124
T-STAT-1.8656262476121
p-value0.0726032769100583
Lambda1.47826461242693


Parameters (Session):
par1 = 4 ;
Parameters (R input):
par1 = 4 ;
R code (references can be found in the software module):
par1 <- as.numeric(par1)
(n <- length(x))
(np <- floor(n / par1))
arr <- array(NA,dim=c(par1,np))
j <- 0
k <- 1
for (i in 1:(np*par1))
{
j = j + 1
arr[j,k] <- x[i]
if (j == par1) {
j = 0
k=k+1
}
}
arr
arr.mean <- array(NA,dim=np)
arr.sd <- array(NA,dim=np)
arr.range <- array(NA,dim=np)
for (j in 1:np)
{
arr.mean[j] <- mean(arr[,j],na.rm=TRUE)
arr.sd[j] <- sd(arr[,j],na.rm=TRUE)
arr.range[j] <- max(arr[,j],na.rm=TRUE) - min(arr[,j],na.rm=TRUE)
}
arr.mean
arr.sd
arr.range
(lm1 <- lm(arr.sd~arr.mean))
(lnlm1 <- lm(log(arr.sd)~log(arr.mean)))
(lm2 <- lm(arr.range~arr.mean))
bitmap(file='test1.png')
plot(arr.mean,arr.sd,main='Standard Deviation-Mean Plot',xlab='mean',ylab='standard deviation')
dev.off()
bitmap(file='test2.png')
plot(arr.mean,arr.range,main='Range-Mean Plot',xlab='mean',ylab='range')
dev.off()
load(file='createtable')
a<-table.start()
a<-table.row.start(a)
a<-table.element(a,'Standard Deviation-Mean Plot',4,TRUE)
a<-table.row.end(a)
a<-table.row.start(a)
a<-table.element(a,'Section',header=TRUE)
a<-table.element(a,'Mean',header=TRUE)
a<-table.element(a,'Standard Deviation',header=TRUE)
a<-table.element(a,'Range',header=TRUE)
a<-table.row.end(a)
for (j in 1:np) {
a<-table.row.start(a)
a<-table.element(a,j,header=TRUE)
a<-table.element(a,arr.mean[j])
a<-table.element(a,arr.sd[j] )
a<-table.element(a,arr.range[j] )
a<-table.row.end(a)
}
a<-table.end(a)
table.save(a,file='mytable.tab')
a<-table.start()
a<-table.row.start(a)
a<-table.element(a,'Regression: S.E.(k) = alpha + beta * Mean(k)',2,TRUE)
a<-table.row.end(a)
a<-table.row.start(a)
a<-table.element(a,'alpha',header=TRUE)
a<-table.element(a,lm1$coefficients[[1]])
a<-table.row.end(a)
a<-table.row.start(a)
a<-table.element(a,'beta',header=TRUE)
a<-table.element(a,lm1$coefficients[[2]])
a<-table.row.end(a)
a<-table.row.start(a)
a<-table.element(a,'S.D.',header=TRUE)
a<-table.element(a,summary(lm1)$coefficients[2,2])
a<-table.row.end(a)
a<-table.row.start(a)
a<-table.element(a,'T-STAT',header=TRUE)
a<-table.element(a,summary(lm1)$coefficients[2,3])
a<-table.row.end(a)
a<-table.row.start(a)
a<-table.element(a,'p-value',header=TRUE)
a<-table.element(a,summary(lm1)$coefficients[2,4])
a<-table.row.end(a)
a<-table.end(a)
table.save(a,file='mytable1.tab')
a<-table.start()
a<-table.row.start(a)
a<-table.element(a,'Regression: ln S.E.(k) = alpha + beta * ln Mean(k)',2,TRUE)
a<-table.row.end(a)
a<-table.row.start(a)
a<-table.element(a,'alpha',header=TRUE)
a<-table.element(a,lnlm1$coefficients[[1]])
a<-table.row.end(a)
a<-table.row.start(a)
a<-table.element(a,'beta',header=TRUE)
a<-table.element(a,lnlm1$coefficients[[2]])
a<-table.row.end(a)
a<-table.row.start(a)
a<-table.element(a,'S.D.',header=TRUE)
a<-table.element(a,summary(lnlm1)$coefficients[2,2])
a<-table.row.end(a)
a<-table.row.start(a)
a<-table.element(a,'T-STAT',header=TRUE)
a<-table.element(a,summary(lnlm1)$coefficients[2,3])
a<-table.row.end(a)
a<-table.row.start(a)
a<-table.element(a,'p-value',header=TRUE)
a<-table.element(a,summary(lnlm1)$coefficients[2,4])
a<-table.row.end(a)
a<-table.row.start(a)
a<-table.element(a,'Lambda',header=TRUE)
a<-table.element(a,1-lnlm1$coefficients[[2]])
a<-table.row.end(a)
a<-table.end(a)
table.save(a,file='mytable2.tab')