Free Statistics

of Irreproducible Research!

Author's title

Author*Unverified author*
R Software Modulerwasp_smp.wasp
Title produced by softwareStandard Deviation-Mean Plot
Date of computationMon, 16 Aug 2010 11:48:42 +0000
Cite this page as followsStatistical Computations at FreeStatistics.org, Office for Research Development and Education, URL https://freestatistics.org/blog/index.php?v=date/2010/Aug/16/t12819593048lwhgl54y6r2rde.htm/, Retrieved Thu, 16 May 2024 15:34:28 +0000
Statistical Computations at FreeStatistics.org, Office for Research Development and Education, URL https://freestatistics.org/blog/index.php?pk=78968, Retrieved Thu, 16 May 2024 15:34:28 +0000
QR Codes:

Original text written by user:
IsPrivate?No (this computation is public)
User-defined keywordsSebastien Delforge
Estimated Impact142
Family? (F = Feedback message, R = changed R code, M = changed R Module, P = changed Parameters, D = changed Data)
-       [Standard Deviation-Mean Plot] [Standard deviatio...] [2010-08-16 11:48:42] [923770d86edf74ed976a539eae527e37] [Current]
Feedback Forum

Post a new message
Dataseries X:
152
151
150
148
146
145
146
148
149
149
150
152
154
164
167
162
164
172
169
174
181
181
172
181
183
200
199
190
197
194
190
195
204
197
185
193
192
211
210
197
191
182
170
166
175
163
153
171
165
184
179
163
163
148
132
127
130
118
113
137
133
155
151
132
134
118
102
98
91
77
74
102
98
113
114
96
102
90
72
67
62
48
43
75


Summary of computational transaction
Raw Inputview raw input (R code)
Raw Outputview raw output of R engine
Computing time1 seconds
R Server'Gwilym Jenkins' @ 72.249.127.135

\begin{tabular}{lllllllll}
\hline
Summary of computational transaction \tabularnewline
Raw Input & view raw input (R code)  \tabularnewline
Raw Output & view raw output of R engine  \tabularnewline
Computing time & 1 seconds \tabularnewline
R Server & 'Gwilym Jenkins' @ 72.249.127.135 \tabularnewline
\hline
\end{tabular}
%Source: https://freestatistics.org/blog/index.php?pk=78968&T=0

[TABLE]
[ROW][C]Summary of computational transaction[/C][/ROW]
[ROW][C]Raw Input[/C][C]view raw input (R code) [/C][/ROW]
[ROW][C]Raw Output[/C][C]view raw output of R engine [/C][/ROW]
[ROW][C]Computing time[/C][C]1 seconds[/C][/ROW]
[ROW][C]R Server[/C][C]'Gwilym Jenkins' @ 72.249.127.135[/C][/ROW]
[/TABLE]
Source: https://freestatistics.org/blog/index.php?pk=78968&T=0

Globally Unique Identifier (entire table): ba.freestatistics.org/blog/index.php?pk=78968&T=0

As an alternative you can also use a QR Code:  

The GUIDs for individual cells are displayed in the table below:

Summary of computational transaction
Raw Inputview raw input (R code)
Raw Outputview raw output of R engine
Computing time1 seconds
R Server'Gwilym Jenkins' @ 72.249.127.135


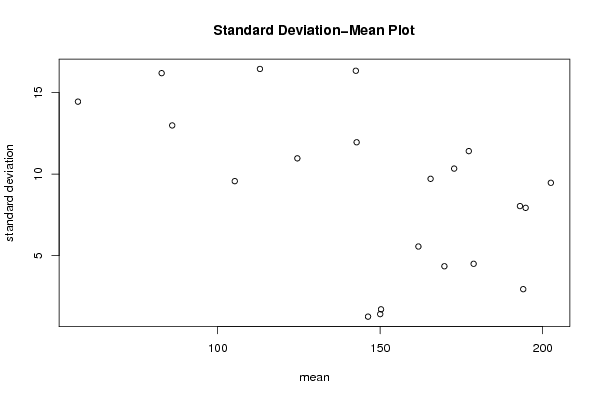
Standard Deviation-Mean Plot
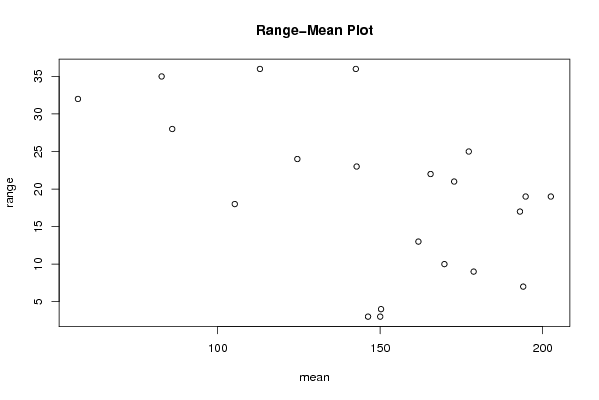
SectionMeanStandard DeviationRange
1150.251.707825127659934
2146.251.258305739211793
31501.414213562373103
4161.755.5602757725374313
5169.754.3493294502333010
6178.754.59
71938.0415587212098817
81942.943920288775957
9194.757.932002689527219
10202.59.4692484742278619
11177.2511.412712210513325
12165.59.712534856222322
13172.7510.340051579497421
14142.516.340134638368236
15124.510.969655114602924
16142.7511.954775893619523
1711316.451950239004136
188612.987173159185428
19105.259.5699181466370618
2082.7516.194134740701635
215714.445299120013632

\begin{tabular}{lllllllll}
\hline
Standard Deviation-Mean Plot \tabularnewline
Section & Mean & Standard Deviation & Range \tabularnewline
1 & 150.25 & 1.70782512765993 & 4 \tabularnewline
2 & 146.25 & 1.25830573921179 & 3 \tabularnewline
3 & 150 & 1.41421356237310 & 3 \tabularnewline
4 & 161.75 & 5.56027577253743 & 13 \tabularnewline
5 & 169.75 & 4.34932945023330 & 10 \tabularnewline
6 & 178.75 & 4.5 & 9 \tabularnewline
7 & 193 & 8.04155872120988 & 17 \tabularnewline
8 & 194 & 2.94392028877595 & 7 \tabularnewline
9 & 194.75 & 7.9320026895272 & 19 \tabularnewline
10 & 202.5 & 9.46924847422786 & 19 \tabularnewline
11 & 177.25 & 11.4127122105133 & 25 \tabularnewline
12 & 165.5 & 9.7125348562223 & 22 \tabularnewline
13 & 172.75 & 10.3400515794974 & 21 \tabularnewline
14 & 142.5 & 16.3401346383682 & 36 \tabularnewline
15 & 124.5 & 10.9696551146029 & 24 \tabularnewline
16 & 142.75 & 11.9547758936195 & 23 \tabularnewline
17 & 113 & 16.4519502390041 & 36 \tabularnewline
18 & 86 & 12.9871731591854 & 28 \tabularnewline
19 & 105.25 & 9.56991814663706 & 18 \tabularnewline
20 & 82.75 & 16.1941347407016 & 35 \tabularnewline
21 & 57 & 14.4452991200136 & 32 \tabularnewline
\hline
\end{tabular}
%Source: https://freestatistics.org/blog/index.php?pk=78968&T=1

[TABLE]
[ROW][C]Standard Deviation-Mean Plot[/C][/ROW]
[ROW][C]Section[/C][C]Mean[/C][C]Standard Deviation[/C][C]Range[/C][/ROW]
[ROW][C]1[/C][C]150.25[/C][C]1.70782512765993[/C][C]4[/C][/ROW]
[ROW][C]2[/C][C]146.25[/C][C]1.25830573921179[/C][C]3[/C][/ROW]
[ROW][C]3[/C][C]150[/C][C]1.41421356237310[/C][C]3[/C][/ROW]
[ROW][C]4[/C][C]161.75[/C][C]5.56027577253743[/C][C]13[/C][/ROW]
[ROW][C]5[/C][C]169.75[/C][C]4.34932945023330[/C][C]10[/C][/ROW]
[ROW][C]6[/C][C]178.75[/C][C]4.5[/C][C]9[/C][/ROW]
[ROW][C]7[/C][C]193[/C][C]8.04155872120988[/C][C]17[/C][/ROW]
[ROW][C]8[/C][C]194[/C][C]2.94392028877595[/C][C]7[/C][/ROW]
[ROW][C]9[/C][C]194.75[/C][C]7.9320026895272[/C][C]19[/C][/ROW]
[ROW][C]10[/C][C]202.5[/C][C]9.46924847422786[/C][C]19[/C][/ROW]
[ROW][C]11[/C][C]177.25[/C][C]11.4127122105133[/C][C]25[/C][/ROW]
[ROW][C]12[/C][C]165.5[/C][C]9.7125348562223[/C][C]22[/C][/ROW]
[ROW][C]13[/C][C]172.75[/C][C]10.3400515794974[/C][C]21[/C][/ROW]
[ROW][C]14[/C][C]142.5[/C][C]16.3401346383682[/C][C]36[/C][/ROW]
[ROW][C]15[/C][C]124.5[/C][C]10.9696551146029[/C][C]24[/C][/ROW]
[ROW][C]16[/C][C]142.75[/C][C]11.9547758936195[/C][C]23[/C][/ROW]
[ROW][C]17[/C][C]113[/C][C]16.4519502390041[/C][C]36[/C][/ROW]
[ROW][C]18[/C][C]86[/C][C]12.9871731591854[/C][C]28[/C][/ROW]
[ROW][C]19[/C][C]105.25[/C][C]9.56991814663706[/C][C]18[/C][/ROW]
[ROW][C]20[/C][C]82.75[/C][C]16.1941347407016[/C][C]35[/C][/ROW]
[ROW][C]21[/C][C]57[/C][C]14.4452991200136[/C][C]32[/C][/ROW]
[/TABLE]
Source: https://freestatistics.org/blog/index.php?pk=78968&T=1

Globally Unique Identifier (entire table): ba.freestatistics.org/blog/index.php?pk=78968&T=1

As an alternative you can also use a QR Code:  

The GUIDs for individual cells are displayed in the table below:

Standard Deviation-Mean Plot
SectionMeanStandard DeviationRange
1150.251.707825127659934
2146.251.258305739211793
31501.414213562373103
4161.755.5602757725374313
5169.754.3493294502333010
6178.754.59
71938.0415587212098817
81942.943920288775957
9194.757.932002689527219
10202.59.4692484742278619
11177.2511.412712210513325
12165.59.712534856222322
13172.7510.340051579497421
14142.516.340134638368236
15124.510.969655114602924
16142.7511.954775893619523
1711316.451950239004136
188612.987173159185428
19105.259.5699181466370618
2082.7516.194134740701635
215714.445299120013632


Regression: S.E.(k) = alpha + beta * Mean(k)
alpha18.5862812579342
beta-0.0651899001342323
S.D.0.0237850933917396
T-STAT-2.74078806673394
p-value0.0129917519852657

\begin{tabular}{lllllllll}
\hline
Regression: S.E.(k) = alpha + beta * Mean(k) \tabularnewline
alpha & 18.5862812579342 \tabularnewline
beta & -0.0651899001342323 \tabularnewline
S.D. & 0.0237850933917396 \tabularnewline
T-STAT & -2.74078806673394 \tabularnewline
p-value & 0.0129917519852657 \tabularnewline
\hline
\end{tabular}
%Source: https://freestatistics.org/blog/index.php?pk=78968&T=2

[TABLE]
[ROW][C]Regression: S.E.(k) = alpha + beta * Mean(k)[/C][/ROW]
[ROW][C]alpha[/C][C]18.5862812579342[/C][/ROW]
[ROW][C]beta[/C][C]-0.0651899001342323[/C][/ROW]
[ROW][C]S.D.[/C][C]0.0237850933917396[/C][/ROW]
[ROW][C]T-STAT[/C][C]-2.74078806673394[/C][/ROW]
[ROW][C]p-value[/C][C]0.0129917519852657[/C][/ROW]
[/TABLE]
Source: https://freestatistics.org/blog/index.php?pk=78968&T=2

Globally Unique Identifier (entire table): ba.freestatistics.org/blog/index.php?pk=78968&T=2

As an alternative you can also use a QR Code:  

The GUIDs for individual cells are displayed in the table below:

Regression: S.E.(k) = alpha + beta * Mean(k)
alpha18.5862812579342
beta-0.0651899001342323
S.D.0.0237850933917396
T-STAT-2.74078806673394
p-value0.0129917519852657


Regression: ln S.E.(k) = alpha + beta * ln Mean(k)
alpha6.62087823422066
beta-0.941869820460512
S.D.0.517601959375854
T-STAT-1.81967978173085
p-value0.0846015712601025
Lambda1.94186982046051

\begin{tabular}{lllllllll}
\hline
Regression: ln S.E.(k) = alpha + beta * ln Mean(k) \tabularnewline
alpha & 6.62087823422066 \tabularnewline
beta & -0.941869820460512 \tabularnewline
S.D. & 0.517601959375854 \tabularnewline
T-STAT & -1.81967978173085 \tabularnewline
p-value & 0.0846015712601025 \tabularnewline
Lambda & 1.94186982046051 \tabularnewline
\hline
\end{tabular}
%Source: https://freestatistics.org/blog/index.php?pk=78968&T=3

[TABLE]
[ROW][C]Regression: ln S.E.(k) = alpha + beta * ln Mean(k)[/C][/ROW]
[ROW][C]alpha[/C][C]6.62087823422066[/C][/ROW]
[ROW][C]beta[/C][C]-0.941869820460512[/C][/ROW]
[ROW][C]S.D.[/C][C]0.517601959375854[/C][/ROW]
[ROW][C]T-STAT[/C][C]-1.81967978173085[/C][/ROW]
[ROW][C]p-value[/C][C]0.0846015712601025[/C][/ROW]
[ROW][C]Lambda[/C][C]1.94186982046051[/C][/ROW]
[/TABLE]
Source: https://freestatistics.org/blog/index.php?pk=78968&T=3

Globally Unique Identifier (entire table): ba.freestatistics.org/blog/index.php?pk=78968&T=3

As an alternative you can also use a QR Code:  

The GUIDs for individual cells are displayed in the table below:

Regression: ln S.E.(k) = alpha + beta * ln Mean(k)
alpha6.62087823422066
beta-0.941869820460512
S.D.0.517601959375854
T-STAT-1.81967978173085
p-value0.0846015712601025
Lambda1.94186982046051


Parameters (Session):
par1 = 4 ;
Parameters (R input):
par1 = 4 ;
R code (references can be found in the software module):
par1 <- as.numeric(par1)
(n <- length(x))
(np <- floor(n / par1))
arr <- array(NA,dim=c(par1,np))
j <- 0
k <- 1
for (i in 1:(np*par1))
{
j = j + 1
arr[j,k] <- x[i]
if (j == par1) {
j = 0
k=k+1
}
}
arr
arr.mean <- array(NA,dim=np)
arr.sd <- array(NA,dim=np)
arr.range <- array(NA,dim=np)
for (j in 1:np)
{
arr.mean[j] <- mean(arr[,j],na.rm=TRUE)
arr.sd[j] <- sd(arr[,j],na.rm=TRUE)
arr.range[j] <- max(arr[,j],na.rm=TRUE) - min(arr[,j],na.rm=TRUE)
}
arr.mean
arr.sd
arr.range
(lm1 <- lm(arr.sd~arr.mean))
(lnlm1 <- lm(log(arr.sd)~log(arr.mean)))
(lm2 <- lm(arr.range~arr.mean))
bitmap(file='test1.png')
plot(arr.mean,arr.sd,main='Standard Deviation-Mean Plot',xlab='mean',ylab='standard deviation')
dev.off()
bitmap(file='test2.png')
plot(arr.mean,arr.range,main='Range-Mean Plot',xlab='mean',ylab='range')
dev.off()
load(file='createtable')
a<-table.start()
a<-table.row.start(a)
a<-table.element(a,'Standard Deviation-Mean Plot',4,TRUE)
a<-table.row.end(a)
a<-table.row.start(a)
a<-table.element(a,'Section',header=TRUE)
a<-table.element(a,'Mean',header=TRUE)
a<-table.element(a,'Standard Deviation',header=TRUE)
a<-table.element(a,'Range',header=TRUE)
a<-table.row.end(a)
for (j in 1:np) {
a<-table.row.start(a)
a<-table.element(a,j,header=TRUE)
a<-table.element(a,arr.mean[j])
a<-table.element(a,arr.sd[j] )
a<-table.element(a,arr.range[j] )
a<-table.row.end(a)
}
a<-table.end(a)
table.save(a,file='mytable.tab')
a<-table.start()
a<-table.row.start(a)
a<-table.element(a,'Regression: S.E.(k) = alpha + beta * Mean(k)',2,TRUE)
a<-table.row.end(a)
a<-table.row.start(a)
a<-table.element(a,'alpha',header=TRUE)
a<-table.element(a,lm1$coefficients[[1]])
a<-table.row.end(a)
a<-table.row.start(a)
a<-table.element(a,'beta',header=TRUE)
a<-table.element(a,lm1$coefficients[[2]])
a<-table.row.end(a)
a<-table.row.start(a)
a<-table.element(a,'S.D.',header=TRUE)
a<-table.element(a,summary(lm1)$coefficients[2,2])
a<-table.row.end(a)
a<-table.row.start(a)
a<-table.element(a,'T-STAT',header=TRUE)
a<-table.element(a,summary(lm1)$coefficients[2,3])
a<-table.row.end(a)
a<-table.row.start(a)
a<-table.element(a,'p-value',header=TRUE)
a<-table.element(a,summary(lm1)$coefficients[2,4])
a<-table.row.end(a)
a<-table.end(a)
table.save(a,file='mytable1.tab')
a<-table.start()
a<-table.row.start(a)
a<-table.element(a,'Regression: ln S.E.(k) = alpha + beta * ln Mean(k)',2,TRUE)
a<-table.row.end(a)
a<-table.row.start(a)
a<-table.element(a,'alpha',header=TRUE)
a<-table.element(a,lnlm1$coefficients[[1]])
a<-table.row.end(a)
a<-table.row.start(a)
a<-table.element(a,'beta',header=TRUE)
a<-table.element(a,lnlm1$coefficients[[2]])
a<-table.row.end(a)
a<-table.row.start(a)
a<-table.element(a,'S.D.',header=TRUE)
a<-table.element(a,summary(lnlm1)$coefficients[2,2])
a<-table.row.end(a)
a<-table.row.start(a)
a<-table.element(a,'T-STAT',header=TRUE)
a<-table.element(a,summary(lnlm1)$coefficients[2,3])
a<-table.row.end(a)
a<-table.row.start(a)
a<-table.element(a,'p-value',header=TRUE)
a<-table.element(a,summary(lnlm1)$coefficients[2,4])
a<-table.row.end(a)
a<-table.row.start(a)
a<-table.element(a,'Lambda',header=TRUE)
a<-table.element(a,1-lnlm1$coefficients[[2]])
a<-table.row.end(a)
a<-table.end(a)
table.save(a,file='mytable2.tab')