Free Statistics

of Irreproducible Research!

Author's title

Author*Unverified author*
R Software Modulerwasp_autocorrelation.wasp
Title produced by software(Partial) Autocorrelation Function
Date of computationMon, 16 Aug 2010 11:40:19 +0000
Cite this page as followsStatistical Computations at FreeStatistics.org, Office for Research Development and Education, URL https://freestatistics.org/blog/index.php?v=date/2010/Aug/16/t12819588028lj2qqe2bm6chor.htm/, Retrieved Thu, 16 May 2024 17:16:16 +0000
Statistical Computations at FreeStatistics.org, Office for Research Development and Education, URL https://freestatistics.org/blog/index.php?pk=78965, Retrieved Thu, 16 May 2024 17:16:16 +0000
QR Codes:

Original text written by user:
IsPrivate?No (this computation is public)
User-defined keywordsSeabstien Delforge
Estimated Impact137
Family? (F = Feedback message, R = changed R code, M = changed R Module, P = changed Parameters, D = changed Data)
-       [(Partial) Autocorrelation Function] [Autocorrelation a...] [2010-08-16 11:40:19] [923770d86edf74ed976a539eae527e37] [Current]
Feedback Forum

Post a new message
Dataseries X:
152
151
150
148
146
145
146
148
149
149
150
152
154
164
167
162
164
172
169
174
181
181
172
181
183
200
199
190
197
194
190
195
204
197
185
193
192
211
210
197
191
182
170
166
175
163
153
171
165
184
179
163
163
148
132
127
130
118
113
137
133
155
151
132
134
118
102
98
91
77
74
102
98
113
114
96
102
90
72
67
62
48
43
75


Summary of computational transaction
Raw Inputview raw input (R code)
Raw Outputview raw output of R engine
Computing time1 seconds
R Server'Sir Ronald Aylmer Fisher' @ 193.190.124.24

\begin{tabular}{lllllllll}
\hline
Summary of computational transaction \tabularnewline
Raw Input & view raw input (R code)  \tabularnewline
Raw Output & view raw output of R engine  \tabularnewline
Computing time & 1 seconds \tabularnewline
R Server & 'Sir Ronald Aylmer Fisher' @ 193.190.124.24 \tabularnewline
\hline
\end{tabular}
%Source: https://freestatistics.org/blog/index.php?pk=78965&T=0

[TABLE]
[ROW][C]Summary of computational transaction[/C][/ROW]
[ROW][C]Raw Input[/C][C]view raw input (R code) [/C][/ROW]
[ROW][C]Raw Output[/C][C]view raw output of R engine [/C][/ROW]
[ROW][C]Computing time[/C][C]1 seconds[/C][/ROW]
[ROW][C]R Server[/C][C]'Sir Ronald Aylmer Fisher' @ 193.190.124.24[/C][/ROW]
[/TABLE]
Source: https://freestatistics.org/blog/index.php?pk=78965&T=0

Globally Unique Identifier (entire table): ba.freestatistics.org/blog/index.php?pk=78965&T=0

As an alternative you can also use a QR Code:  

The GUIDs for individual cells are displayed in the table below:

Summary of computational transaction
Raw Inputview raw input (R code)
Raw Outputview raw output of R engine
Computing time1 seconds
R Server'Sir Ronald Aylmer Fisher' @ 193.190.124.24


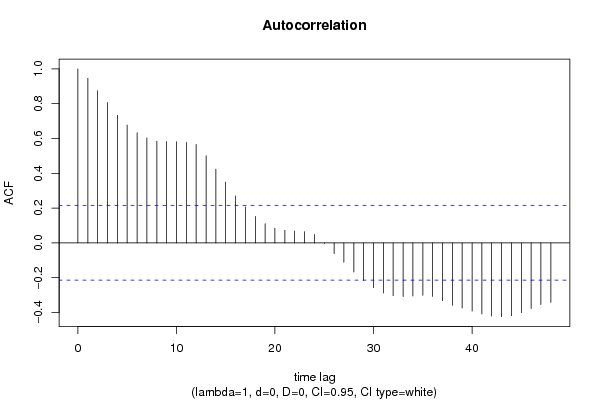
Autocorrelation Function
Time lag kACF(k)T-STATP-value
10.9459678.66990
20.8748478.01810
30.8071787.39790
40.7332186.72010
50.6773336.20790
60.6328675.80030
70.6028225.5250
80.5848595.36030
90.5822365.33630
100.5820365.33440
110.5776525.29430
120.5652915.1811e-06
130.5010944.59268e-06
140.4232273.87890.000104
150.3494533.20280.000962
160.2700992.47550.007657
170.206781.89520.030755
180.1521951.39490.083364
190.1105921.01360.156844
200.0841830.77150.221274
210.0719940.65980.255581
220.0683190.62620.266456
230.0637740.58450.280226
240.0478970.4390.330899
25-0.002993-0.02740.489091
26-0.061084-0.55980.288538
27-0.111693-1.02370.154463
28-0.16764-1.53640.064094
29-0.216606-1.98520.025191
30-0.257509-2.36010.010294
31-0.287489-2.63490.00501
32-0.303542-2.7820.003335
33-0.308842-2.83060.002906
34-0.305491-2.79990.003171
35-0.301447-2.76280.00352
36-0.307539-2.81860.003006
37-0.332188-3.04460.001556
38-0.358459-3.28530.000744
39-0.374261-3.43020.000469
40-0.392202-3.59460.000273
41-0.409551-3.75360.00016
42-0.420348-3.85260.000114
43-0.42411-3.8870.000101
44-0.418642-3.83690.00012
45-0.401856-3.68310.000203
46-0.377502-3.45990.000426
47-0.35485-3.25230.000825
48-0.342305-3.13730.001176

\begin{tabular}{lllllllll}
\hline
Autocorrelation Function \tabularnewline
Time lag k & ACF(k) & T-STAT & P-value \tabularnewline
1 & 0.945967 & 8.6699 & 0 \tabularnewline
2 & 0.874847 & 8.0181 & 0 \tabularnewline
3 & 0.807178 & 7.3979 & 0 \tabularnewline
4 & 0.733218 & 6.7201 & 0 \tabularnewline
5 & 0.677333 & 6.2079 & 0 \tabularnewline
6 & 0.632867 & 5.8003 & 0 \tabularnewline
7 & 0.602822 & 5.525 & 0 \tabularnewline
8 & 0.584859 & 5.3603 & 0 \tabularnewline
9 & 0.582236 & 5.3363 & 0 \tabularnewline
10 & 0.582036 & 5.3344 & 0 \tabularnewline
11 & 0.577652 & 5.2943 & 0 \tabularnewline
12 & 0.565291 & 5.181 & 1e-06 \tabularnewline
13 & 0.501094 & 4.5926 & 8e-06 \tabularnewline
14 & 0.423227 & 3.8789 & 0.000104 \tabularnewline
15 & 0.349453 & 3.2028 & 0.000962 \tabularnewline
16 & 0.270099 & 2.4755 & 0.007657 \tabularnewline
17 & 0.20678 & 1.8952 & 0.030755 \tabularnewline
18 & 0.152195 & 1.3949 & 0.083364 \tabularnewline
19 & 0.110592 & 1.0136 & 0.156844 \tabularnewline
20 & 0.084183 & 0.7715 & 0.221274 \tabularnewline
21 & 0.071994 & 0.6598 & 0.255581 \tabularnewline
22 & 0.068319 & 0.6262 & 0.266456 \tabularnewline
23 & 0.063774 & 0.5845 & 0.280226 \tabularnewline
24 & 0.047897 & 0.439 & 0.330899 \tabularnewline
25 & -0.002993 & -0.0274 & 0.489091 \tabularnewline
26 & -0.061084 & -0.5598 & 0.288538 \tabularnewline
27 & -0.111693 & -1.0237 & 0.154463 \tabularnewline
28 & -0.16764 & -1.5364 & 0.064094 \tabularnewline
29 & -0.216606 & -1.9852 & 0.025191 \tabularnewline
30 & -0.257509 & -2.3601 & 0.010294 \tabularnewline
31 & -0.287489 & -2.6349 & 0.00501 \tabularnewline
32 & -0.303542 & -2.782 & 0.003335 \tabularnewline
33 & -0.308842 & -2.8306 & 0.002906 \tabularnewline
34 & -0.305491 & -2.7999 & 0.003171 \tabularnewline
35 & -0.301447 & -2.7628 & 0.00352 \tabularnewline
36 & -0.307539 & -2.8186 & 0.003006 \tabularnewline
37 & -0.332188 & -3.0446 & 0.001556 \tabularnewline
38 & -0.358459 & -3.2853 & 0.000744 \tabularnewline
39 & -0.374261 & -3.4302 & 0.000469 \tabularnewline
40 & -0.392202 & -3.5946 & 0.000273 \tabularnewline
41 & -0.409551 & -3.7536 & 0.00016 \tabularnewline
42 & -0.420348 & -3.8526 & 0.000114 \tabularnewline
43 & -0.42411 & -3.887 & 0.000101 \tabularnewline
44 & -0.418642 & -3.8369 & 0.00012 \tabularnewline
45 & -0.401856 & -3.6831 & 0.000203 \tabularnewline
46 & -0.377502 & -3.4599 & 0.000426 \tabularnewline
47 & -0.35485 & -3.2523 & 0.000825 \tabularnewline
48 & -0.342305 & -3.1373 & 0.001176 \tabularnewline
\hline
\end{tabular}
%Source: https://freestatistics.org/blog/index.php?pk=78965&T=1

[TABLE]
[ROW][C]Autocorrelation Function[/C][/ROW]
[ROW][C]Time lag k[/C][C]ACF(k)[/C][C]T-STAT[/C][C]P-value[/C][/ROW]
[ROW][C]1[/C][C]0.945967[/C][C]8.6699[/C][C]0[/C][/ROW]
[ROW][C]2[/C][C]0.874847[/C][C]8.0181[/C][C]0[/C][/ROW]
[ROW][C]3[/C][C]0.807178[/C][C]7.3979[/C][C]0[/C][/ROW]
[ROW][C]4[/C][C]0.733218[/C][C]6.7201[/C][C]0[/C][/ROW]
[ROW][C]5[/C][C]0.677333[/C][C]6.2079[/C][C]0[/C][/ROW]
[ROW][C]6[/C][C]0.632867[/C][C]5.8003[/C][C]0[/C][/ROW]
[ROW][C]7[/C][C]0.602822[/C][C]5.525[/C][C]0[/C][/ROW]
[ROW][C]8[/C][C]0.584859[/C][C]5.3603[/C][C]0[/C][/ROW]
[ROW][C]9[/C][C]0.582236[/C][C]5.3363[/C][C]0[/C][/ROW]
[ROW][C]10[/C][C]0.582036[/C][C]5.3344[/C][C]0[/C][/ROW]
[ROW][C]11[/C][C]0.577652[/C][C]5.2943[/C][C]0[/C][/ROW]
[ROW][C]12[/C][C]0.565291[/C][C]5.181[/C][C]1e-06[/C][/ROW]
[ROW][C]13[/C][C]0.501094[/C][C]4.5926[/C][C]8e-06[/C][/ROW]
[ROW][C]14[/C][C]0.423227[/C][C]3.8789[/C][C]0.000104[/C][/ROW]
[ROW][C]15[/C][C]0.349453[/C][C]3.2028[/C][C]0.000962[/C][/ROW]
[ROW][C]16[/C][C]0.270099[/C][C]2.4755[/C][C]0.007657[/C][/ROW]
[ROW][C]17[/C][C]0.20678[/C][C]1.8952[/C][C]0.030755[/C][/ROW]
[ROW][C]18[/C][C]0.152195[/C][C]1.3949[/C][C]0.083364[/C][/ROW]
[ROW][C]19[/C][C]0.110592[/C][C]1.0136[/C][C]0.156844[/C][/ROW]
[ROW][C]20[/C][C]0.084183[/C][C]0.7715[/C][C]0.221274[/C][/ROW]
[ROW][C]21[/C][C]0.071994[/C][C]0.6598[/C][C]0.255581[/C][/ROW]
[ROW][C]22[/C][C]0.068319[/C][C]0.6262[/C][C]0.266456[/C][/ROW]
[ROW][C]23[/C][C]0.063774[/C][C]0.5845[/C][C]0.280226[/C][/ROW]
[ROW][C]24[/C][C]0.047897[/C][C]0.439[/C][C]0.330899[/C][/ROW]
[ROW][C]25[/C][C]-0.002993[/C][C]-0.0274[/C][C]0.489091[/C][/ROW]
[ROW][C]26[/C][C]-0.061084[/C][C]-0.5598[/C][C]0.288538[/C][/ROW]
[ROW][C]27[/C][C]-0.111693[/C][C]-1.0237[/C][C]0.154463[/C][/ROW]
[ROW][C]28[/C][C]-0.16764[/C][C]-1.5364[/C][C]0.064094[/C][/ROW]
[ROW][C]29[/C][C]-0.216606[/C][C]-1.9852[/C][C]0.025191[/C][/ROW]
[ROW][C]30[/C][C]-0.257509[/C][C]-2.3601[/C][C]0.010294[/C][/ROW]
[ROW][C]31[/C][C]-0.287489[/C][C]-2.6349[/C][C]0.00501[/C][/ROW]
[ROW][C]32[/C][C]-0.303542[/C][C]-2.782[/C][C]0.003335[/C][/ROW]
[ROW][C]33[/C][C]-0.308842[/C][C]-2.8306[/C][C]0.002906[/C][/ROW]
[ROW][C]34[/C][C]-0.305491[/C][C]-2.7999[/C][C]0.003171[/C][/ROW]
[ROW][C]35[/C][C]-0.301447[/C][C]-2.7628[/C][C]0.00352[/C][/ROW]
[ROW][C]36[/C][C]-0.307539[/C][C]-2.8186[/C][C]0.003006[/C][/ROW]
[ROW][C]37[/C][C]-0.332188[/C][C]-3.0446[/C][C]0.001556[/C][/ROW]
[ROW][C]38[/C][C]-0.358459[/C][C]-3.2853[/C][C]0.000744[/C][/ROW]
[ROW][C]39[/C][C]-0.374261[/C][C]-3.4302[/C][C]0.000469[/C][/ROW]
[ROW][C]40[/C][C]-0.392202[/C][C]-3.5946[/C][C]0.000273[/C][/ROW]
[ROW][C]41[/C][C]-0.409551[/C][C]-3.7536[/C][C]0.00016[/C][/ROW]
[ROW][C]42[/C][C]-0.420348[/C][C]-3.8526[/C][C]0.000114[/C][/ROW]
[ROW][C]43[/C][C]-0.42411[/C][C]-3.887[/C][C]0.000101[/C][/ROW]
[ROW][C]44[/C][C]-0.418642[/C][C]-3.8369[/C][C]0.00012[/C][/ROW]
[ROW][C]45[/C][C]-0.401856[/C][C]-3.6831[/C][C]0.000203[/C][/ROW]
[ROW][C]46[/C][C]-0.377502[/C][C]-3.4599[/C][C]0.000426[/C][/ROW]
[ROW][C]47[/C][C]-0.35485[/C][C]-3.2523[/C][C]0.000825[/C][/ROW]
[ROW][C]48[/C][C]-0.342305[/C][C]-3.1373[/C][C]0.001176[/C][/ROW]
[/TABLE]
Source: https://freestatistics.org/blog/index.php?pk=78965&T=1

Globally Unique Identifier (entire table): ba.freestatistics.org/blog/index.php?pk=78965&T=1

As an alternative you can also use a QR Code:  

The GUIDs for individual cells are displayed in the table below:

Autocorrelation Function
Time lag kACF(k)T-STATP-value
10.9459678.66990
20.8748478.01810
30.8071787.39790
40.7332186.72010
50.6773336.20790
60.6328675.80030
70.6028225.5250
80.5848595.36030
90.5822365.33630
100.5820365.33440
110.5776525.29430
120.5652915.1811e-06
130.5010944.59268e-06
140.4232273.87890.000104
150.3494533.20280.000962
160.2700992.47550.007657
170.206781.89520.030755
180.1521951.39490.083364
190.1105921.01360.156844
200.0841830.77150.221274
210.0719940.65980.255581
220.0683190.62620.266456
230.0637740.58450.280226
240.0478970.4390.330899
25-0.002993-0.02740.489091
26-0.061084-0.55980.288538
27-0.111693-1.02370.154463
28-0.16764-1.53640.064094
29-0.216606-1.98520.025191
30-0.257509-2.36010.010294
31-0.287489-2.63490.00501
32-0.303542-2.7820.003335
33-0.308842-2.83060.002906
34-0.305491-2.79990.003171
35-0.301447-2.76280.00352
36-0.307539-2.81860.003006
37-0.332188-3.04460.001556
38-0.358459-3.28530.000744
39-0.374261-3.43020.000469
40-0.392202-3.59460.000273
41-0.409551-3.75360.00016
42-0.420348-3.85260.000114
43-0.42411-3.8870.000101
44-0.418642-3.83690.00012
45-0.401856-3.68310.000203
46-0.377502-3.45990.000426
47-0.35485-3.25230.000825
48-0.342305-3.13730.001176


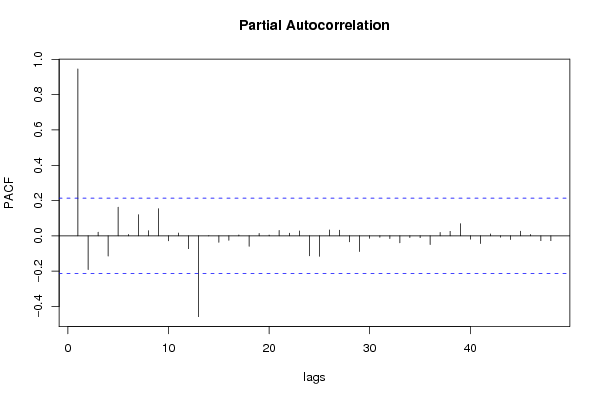
Partial Autocorrelation Function
Time lag kPACF(k)T-STATP-value
10.9459678.66990
2-0.190278-1.74390.042415
30.021010.19260.423884
4-0.114291-1.04750.148939
50.1624191.48860.070169
60.0078760.07220.471314
70.1199371.09920.137402
80.0288620.26450.396011
90.1536121.40790.081429
10-0.027477-0.25180.400894
110.0155730.14270.443424
12-0.072625-0.66560.25374
13-0.457861-4.19643.4e-05
140.0007860.00720.497136
15-0.036876-0.3380.368112
16-0.025056-0.22960.409466
170.0055980.05130.479602
18-0.058582-0.53690.296374
190.0131270.12030.452262
200.004430.04060.483855
210.0302890.27760.391
220.0145030.13290.447285
230.0273520.25070.401334
24-0.113017-1.03580.15163
25-0.115889-1.06210.145609
260.0337630.30940.378874
270.0323090.29610.383936
28-0.033263-0.30490.380613
29-0.088978-0.81550.208547
30-0.013503-0.12380.450902
31-0.008119-0.07440.470431
32-0.014976-0.13730.445579
33-0.039512-0.36210.35908
34-0.008945-0.0820.467428
35-0.010136-0.09290.463101
36-0.049655-0.45510.325109
370.0193460.17730.429847
380.0255360.2340.407761
390.0685540.62830.265752
40-0.018771-0.1720.431912
41-0.043891-0.40230.344254
420.0105650.09680.461548
43-0.007245-0.06640.473609
44-0.021097-0.19340.423572
450.0261820.240.405473
460.0076910.07050.471984
47-0.027297-0.25020.401528
48-0.027194-0.24920.401893

\begin{tabular}{lllllllll}
\hline
Partial Autocorrelation Function \tabularnewline
Time lag k & PACF(k) & T-STAT & P-value \tabularnewline
1 & 0.945967 & 8.6699 & 0 \tabularnewline
2 & -0.190278 & -1.7439 & 0.042415 \tabularnewline
3 & 0.02101 & 0.1926 & 0.423884 \tabularnewline
4 & -0.114291 & -1.0475 & 0.148939 \tabularnewline
5 & 0.162419 & 1.4886 & 0.070169 \tabularnewline
6 & 0.007876 & 0.0722 & 0.471314 \tabularnewline
7 & 0.119937 & 1.0992 & 0.137402 \tabularnewline
8 & 0.028862 & 0.2645 & 0.396011 \tabularnewline
9 & 0.153612 & 1.4079 & 0.081429 \tabularnewline
10 & -0.027477 & -0.2518 & 0.400894 \tabularnewline
11 & 0.015573 & 0.1427 & 0.443424 \tabularnewline
12 & -0.072625 & -0.6656 & 0.25374 \tabularnewline
13 & -0.457861 & -4.1964 & 3.4e-05 \tabularnewline
14 & 0.000786 & 0.0072 & 0.497136 \tabularnewline
15 & -0.036876 & -0.338 & 0.368112 \tabularnewline
16 & -0.025056 & -0.2296 & 0.409466 \tabularnewline
17 & 0.005598 & 0.0513 & 0.479602 \tabularnewline
18 & -0.058582 & -0.5369 & 0.296374 \tabularnewline
19 & 0.013127 & 0.1203 & 0.452262 \tabularnewline
20 & 0.00443 & 0.0406 & 0.483855 \tabularnewline
21 & 0.030289 & 0.2776 & 0.391 \tabularnewline
22 & 0.014503 & 0.1329 & 0.447285 \tabularnewline
23 & 0.027352 & 0.2507 & 0.401334 \tabularnewline
24 & -0.113017 & -1.0358 & 0.15163 \tabularnewline
25 & -0.115889 & -1.0621 & 0.145609 \tabularnewline
26 & 0.033763 & 0.3094 & 0.378874 \tabularnewline
27 & 0.032309 & 0.2961 & 0.383936 \tabularnewline
28 & -0.033263 & -0.3049 & 0.380613 \tabularnewline
29 & -0.088978 & -0.8155 & 0.208547 \tabularnewline
30 & -0.013503 & -0.1238 & 0.450902 \tabularnewline
31 & -0.008119 & -0.0744 & 0.470431 \tabularnewline
32 & -0.014976 & -0.1373 & 0.445579 \tabularnewline
33 & -0.039512 & -0.3621 & 0.35908 \tabularnewline
34 & -0.008945 & -0.082 & 0.467428 \tabularnewline
35 & -0.010136 & -0.0929 & 0.463101 \tabularnewline
36 & -0.049655 & -0.4551 & 0.325109 \tabularnewline
37 & 0.019346 & 0.1773 & 0.429847 \tabularnewline
38 & 0.025536 & 0.234 & 0.407761 \tabularnewline
39 & 0.068554 & 0.6283 & 0.265752 \tabularnewline
40 & -0.018771 & -0.172 & 0.431912 \tabularnewline
41 & -0.043891 & -0.4023 & 0.344254 \tabularnewline
42 & 0.010565 & 0.0968 & 0.461548 \tabularnewline
43 & -0.007245 & -0.0664 & 0.473609 \tabularnewline
44 & -0.021097 & -0.1934 & 0.423572 \tabularnewline
45 & 0.026182 & 0.24 & 0.405473 \tabularnewline
46 & 0.007691 & 0.0705 & 0.471984 \tabularnewline
47 & -0.027297 & -0.2502 & 0.401528 \tabularnewline
48 & -0.027194 & -0.2492 & 0.401893 \tabularnewline
\hline
\end{tabular}
%Source: https://freestatistics.org/blog/index.php?pk=78965&T=2

[TABLE]
[ROW][C]Partial Autocorrelation Function[/C][/ROW]
[ROW][C]Time lag k[/C][C]PACF(k)[/C][C]T-STAT[/C][C]P-value[/C][/ROW]
[ROW][C]1[/C][C]0.945967[/C][C]8.6699[/C][C]0[/C][/ROW]
[ROW][C]2[/C][C]-0.190278[/C][C]-1.7439[/C][C]0.042415[/C][/ROW]
[ROW][C]3[/C][C]0.02101[/C][C]0.1926[/C][C]0.423884[/C][/ROW]
[ROW][C]4[/C][C]-0.114291[/C][C]-1.0475[/C][C]0.148939[/C][/ROW]
[ROW][C]5[/C][C]0.162419[/C][C]1.4886[/C][C]0.070169[/C][/ROW]
[ROW][C]6[/C][C]0.007876[/C][C]0.0722[/C][C]0.471314[/C][/ROW]
[ROW][C]7[/C][C]0.119937[/C][C]1.0992[/C][C]0.137402[/C][/ROW]
[ROW][C]8[/C][C]0.028862[/C][C]0.2645[/C][C]0.396011[/C][/ROW]
[ROW][C]9[/C][C]0.153612[/C][C]1.4079[/C][C]0.081429[/C][/ROW]
[ROW][C]10[/C][C]-0.027477[/C][C]-0.2518[/C][C]0.400894[/C][/ROW]
[ROW][C]11[/C][C]0.015573[/C][C]0.1427[/C][C]0.443424[/C][/ROW]
[ROW][C]12[/C][C]-0.072625[/C][C]-0.6656[/C][C]0.25374[/C][/ROW]
[ROW][C]13[/C][C]-0.457861[/C][C]-4.1964[/C][C]3.4e-05[/C][/ROW]
[ROW][C]14[/C][C]0.000786[/C][C]0.0072[/C][C]0.497136[/C][/ROW]
[ROW][C]15[/C][C]-0.036876[/C][C]-0.338[/C][C]0.368112[/C][/ROW]
[ROW][C]16[/C][C]-0.025056[/C][C]-0.2296[/C][C]0.409466[/C][/ROW]
[ROW][C]17[/C][C]0.005598[/C][C]0.0513[/C][C]0.479602[/C][/ROW]
[ROW][C]18[/C][C]-0.058582[/C][C]-0.5369[/C][C]0.296374[/C][/ROW]
[ROW][C]19[/C][C]0.013127[/C][C]0.1203[/C][C]0.452262[/C][/ROW]
[ROW][C]20[/C][C]0.00443[/C][C]0.0406[/C][C]0.483855[/C][/ROW]
[ROW][C]21[/C][C]0.030289[/C][C]0.2776[/C][C]0.391[/C][/ROW]
[ROW][C]22[/C][C]0.014503[/C][C]0.1329[/C][C]0.447285[/C][/ROW]
[ROW][C]23[/C][C]0.027352[/C][C]0.2507[/C][C]0.401334[/C][/ROW]
[ROW][C]24[/C][C]-0.113017[/C][C]-1.0358[/C][C]0.15163[/C][/ROW]
[ROW][C]25[/C][C]-0.115889[/C][C]-1.0621[/C][C]0.145609[/C][/ROW]
[ROW][C]26[/C][C]0.033763[/C][C]0.3094[/C][C]0.378874[/C][/ROW]
[ROW][C]27[/C][C]0.032309[/C][C]0.2961[/C][C]0.383936[/C][/ROW]
[ROW][C]28[/C][C]-0.033263[/C][C]-0.3049[/C][C]0.380613[/C][/ROW]
[ROW][C]29[/C][C]-0.088978[/C][C]-0.8155[/C][C]0.208547[/C][/ROW]
[ROW][C]30[/C][C]-0.013503[/C][C]-0.1238[/C][C]0.450902[/C][/ROW]
[ROW][C]31[/C][C]-0.008119[/C][C]-0.0744[/C][C]0.470431[/C][/ROW]
[ROW][C]32[/C][C]-0.014976[/C][C]-0.1373[/C][C]0.445579[/C][/ROW]
[ROW][C]33[/C][C]-0.039512[/C][C]-0.3621[/C][C]0.35908[/C][/ROW]
[ROW][C]34[/C][C]-0.008945[/C][C]-0.082[/C][C]0.467428[/C][/ROW]
[ROW][C]35[/C][C]-0.010136[/C][C]-0.0929[/C][C]0.463101[/C][/ROW]
[ROW][C]36[/C][C]-0.049655[/C][C]-0.4551[/C][C]0.325109[/C][/ROW]
[ROW][C]37[/C][C]0.019346[/C][C]0.1773[/C][C]0.429847[/C][/ROW]
[ROW][C]38[/C][C]0.025536[/C][C]0.234[/C][C]0.407761[/C][/ROW]
[ROW][C]39[/C][C]0.068554[/C][C]0.6283[/C][C]0.265752[/C][/ROW]
[ROW][C]40[/C][C]-0.018771[/C][C]-0.172[/C][C]0.431912[/C][/ROW]
[ROW][C]41[/C][C]-0.043891[/C][C]-0.4023[/C][C]0.344254[/C][/ROW]
[ROW][C]42[/C][C]0.010565[/C][C]0.0968[/C][C]0.461548[/C][/ROW]
[ROW][C]43[/C][C]-0.007245[/C][C]-0.0664[/C][C]0.473609[/C][/ROW]
[ROW][C]44[/C][C]-0.021097[/C][C]-0.1934[/C][C]0.423572[/C][/ROW]
[ROW][C]45[/C][C]0.026182[/C][C]0.24[/C][C]0.405473[/C][/ROW]
[ROW][C]46[/C][C]0.007691[/C][C]0.0705[/C][C]0.471984[/C][/ROW]
[ROW][C]47[/C][C]-0.027297[/C][C]-0.2502[/C][C]0.401528[/C][/ROW]
[ROW][C]48[/C][C]-0.027194[/C][C]-0.2492[/C][C]0.401893[/C][/ROW]
[/TABLE]
Source: https://freestatistics.org/blog/index.php?pk=78965&T=2

Globally Unique Identifier (entire table): ba.freestatistics.org/blog/index.php?pk=78965&T=2

As an alternative you can also use a QR Code:  

The GUIDs for individual cells are displayed in the table below:

Partial Autocorrelation Function
Time lag kPACF(k)T-STATP-value
10.9459678.66990
2-0.190278-1.74390.042415
30.021010.19260.423884
4-0.114291-1.04750.148939
50.1624191.48860.070169
60.0078760.07220.471314
70.1199371.09920.137402
80.0288620.26450.396011
90.1536121.40790.081429
10-0.027477-0.25180.400894
110.0155730.14270.443424
12-0.072625-0.66560.25374
13-0.457861-4.19643.4e-05
140.0007860.00720.497136
15-0.036876-0.3380.368112
16-0.025056-0.22960.409466
170.0055980.05130.479602
18-0.058582-0.53690.296374
190.0131270.12030.452262
200.004430.04060.483855
210.0302890.27760.391
220.0145030.13290.447285
230.0273520.25070.401334
24-0.113017-1.03580.15163
25-0.115889-1.06210.145609
260.0337630.30940.378874
270.0323090.29610.383936
28-0.033263-0.30490.380613
29-0.088978-0.81550.208547
30-0.013503-0.12380.450902
31-0.008119-0.07440.470431
32-0.014976-0.13730.445579
33-0.039512-0.36210.35908
34-0.008945-0.0820.467428
35-0.010136-0.09290.463101
36-0.049655-0.45510.325109
370.0193460.17730.429847
380.0255360.2340.407761
390.0685540.62830.265752
40-0.018771-0.1720.431912
41-0.043891-0.40230.344254
420.0105650.09680.461548
43-0.007245-0.06640.473609
44-0.021097-0.19340.423572
450.0261820.240.405473
460.0076910.07050.471984
47-0.027297-0.25020.401528
48-0.027194-0.24920.401893


Parameters (Session):
par1 = 48 ; par2 = 1 ; par3 = 0 ; par4 = 0 ; par5 = 12 ; par6 = White Noise ; par7 = 0.95 ;
Parameters (R input):
par1 = 48 ; par2 = 1 ; par3 = 0 ; par4 = 0 ; par5 = 12 ; par6 = White Noise ; par7 = 0.95 ;
R code (references can be found in the software module):
if (par1 == 'Default') {
par1 = 10*log10(length(x))
} else {
par1 <- as.numeric(par1)
}
par2 <- as.numeric(par2)
par3 <- as.numeric(par3)
par4 <- as.numeric(par4)
par5 <- as.numeric(par5)
if (par6 == 'White Noise') par6 <- 'white' else par6 <- 'ma'
par7 <- as.numeric(par7)
if (par2 == 0) {
x <- log(x)
} else {
x <- (x ^ par2 - 1) / par2
}
if (par3 > 0) x <- diff(x,lag=1,difference=par3)
if (par4 > 0) x <- diff(x,lag=par5,difference=par4)
bitmap(file='pic1.png')
racf <- acf(x, par1, main='Autocorrelation', xlab='time lag', ylab='ACF', ci.type=par6, ci=par7, sub=paste('(lambda=',par2,', d=',par3,', D=',par4,', CI=', par7, ', CI type=',par6,')',sep=''))
dev.off()
bitmap(file='pic2.png')
rpacf <- pacf(x,par1,main='Partial Autocorrelation',xlab='lags',ylab='PACF')
dev.off()
(myacf <- c(racf$acf))
(mypacf <- c(rpacf$acf))
lengthx <- length(x)
sqrtn <- sqrt(lengthx)
load(file='createtable')
a<-table.start()
a<-table.row.start(a)
a<-table.element(a,'Autocorrelation Function',4,TRUE)
a<-table.row.end(a)
a<-table.row.start(a)
a<-table.element(a,'Time lag k',header=TRUE)
a<-table.element(a,hyperlink('basics.htm','ACF(k)','click here for more information about the Autocorrelation Function'),header=TRUE)
a<-table.element(a,'T-STAT',header=TRUE)
a<-table.element(a,'P-value',header=TRUE)
a<-table.row.end(a)
for (i in 2:(par1+1)) {
a<-table.row.start(a)
a<-table.element(a,i-1,header=TRUE)
a<-table.element(a,round(myacf[i],6))
mytstat <- myacf[i]*sqrtn
a<-table.element(a,round(mytstat,4))
a<-table.element(a,round(1-pt(abs(mytstat),lengthx),6))
a<-table.row.end(a)
}
a<-table.end(a)
table.save(a,file='mytable.tab')
a<-table.start()
a<-table.row.start(a)
a<-table.element(a,'Partial Autocorrelation Function',4,TRUE)
a<-table.row.end(a)
a<-table.row.start(a)
a<-table.element(a,'Time lag k',header=TRUE)
a<-table.element(a,hyperlink('basics.htm','PACF(k)','click here for more information about the Partial Autocorrelation Function'),header=TRUE)
a<-table.element(a,'T-STAT',header=TRUE)
a<-table.element(a,'P-value',header=TRUE)
a<-table.row.end(a)
for (i in 1:par1) {
a<-table.row.start(a)
a<-table.element(a,i,header=TRUE)
a<-table.element(a,round(mypacf[i],6))
mytstat <- mypacf[i]*sqrtn
a<-table.element(a,round(mytstat,4))
a<-table.element(a,round(1-pt(abs(mytstat),lengthx),6))
a<-table.row.end(a)
}
a<-table.end(a)
table.save(a,file='mytable1.tab')