Free Statistics

of Irreproducible Research!

Author's title

Author*Unverified author*
R Software Modulerwasp_smp.wasp
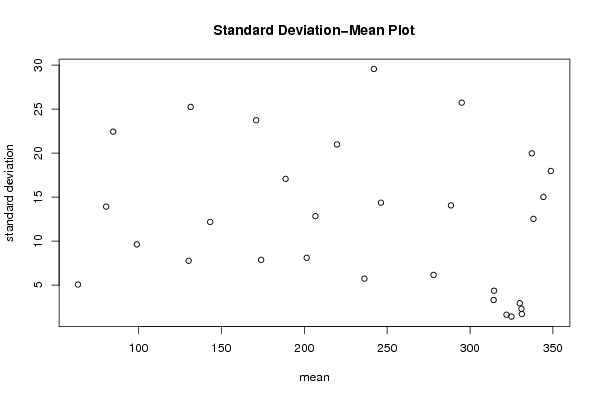
Title produced by softwareStandard Deviation-Mean Plot
Date of computationMon, 16 Aug 2010 11:29:56 +0000
Cite this page as followsStatistical Computations at FreeStatistics.org, Office for Research Development and Education, URL https://freestatistics.org/blog/index.php?v=date/2010/Aug/16/t1281958172ubxtsfgt86mgmjr.htm/, Retrieved Thu, 16 May 2024 21:24:04 +0000
Statistical Computations at FreeStatistics.org, Office for Research Development and Education, URL https://freestatistics.org/blog/index.php?pk=78962, Retrieved Thu, 16 May 2024 21:24:04 +0000
QR Codes:

Original text written by user:
IsPrivate?No (this computation is public)
User-defined keywordsMagali de Reu
Estimated Impact131
Family? (F = Feedback message, R = changed R code, M = changed R Module, P = changed Parameters, D = changed Data)
-       [Standard Deviation-Mean Plot] [tijdreeks 1 stap 26] [2010-08-16 11:29:56] [07915b1f88a41fb8d82e27c5eaa7bbed] [Current]
Feedback Forum

Post a new message
Dataseries X:
333
332
331
329
349
348
333
323
324
324
325
327
329
333
329
333
355
358
338
326
320
322
322
324
326
330
331
333
364
363
341
327
313
321
312
312
312
314
312
319
356
351
329
313
298
303
278
275
276
276
273
287
320
313
281
266
258
259
237
231
237
236
229
243
271
262
227
208
212
222
200
193
204
203
190
209
240
234
210
195
202
204
180
169
178
181
163
174
194
187
160
143
151
154
141
127
134
138
120
129
151
152
124
99
104
109
96
87
94
89
63
76
100
104
80
55
60
71
62
61


Summary of computational transaction
Raw Inputview raw input (R code)
Raw Outputview raw output of R engine
Computing time2 seconds
R Server'RServer@AstonUniversity' @ vre.aston.ac.uk

\begin{tabular}{lllllllll}
\hline
Summary of computational transaction \tabularnewline
Raw Input & view raw input (R code)  \tabularnewline
Raw Output & view raw output of R engine  \tabularnewline
Computing time & 2 seconds \tabularnewline
R Server & 'RServer@AstonUniversity' @ vre.aston.ac.uk \tabularnewline
\hline
\end{tabular}
%Source: https://freestatistics.org/blog/index.php?pk=78962&T=0

[TABLE]
[ROW][C]Summary of computational transaction[/C][/ROW]
[ROW][C]Raw Input[/C][C]view raw input (R code) [/C][/ROW]
[ROW][C]Raw Output[/C][C]view raw output of R engine [/C][/ROW]
[ROW][C]Computing time[/C][C]2 seconds[/C][/ROW]
[ROW][C]R Server[/C][C]'RServer@AstonUniversity' @ vre.aston.ac.uk[/C][/ROW]
[/TABLE]
Source: https://freestatistics.org/blog/index.php?pk=78962&T=0

Globally Unique Identifier (entire table): ba.freestatistics.org/blog/index.php?pk=78962&T=0

As an alternative you can also use a QR Code:  

The GUIDs for individual cells are displayed in the table below:

Summary of computational transaction
Raw Inputview raw input (R code)
Raw Outputview raw output of R engine
Computing time2 seconds
R Server'RServer@AstonUniversity' @ vre.aston.ac.uk


Standard Deviation-Mean Plot
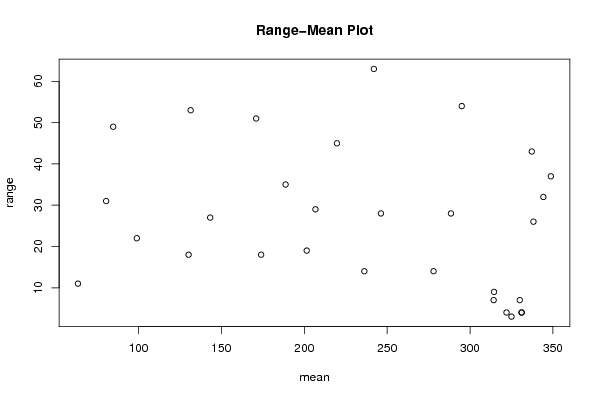
SectionMeanStandard DeviationRange
1331.251.707825127659934
2338.2512.526638282742426
33251.41421356237313
43312.30940107675854
5344.2515.019431857874432
63221.632993161855454
73302.943920288775957
8348.7517.969882210706537
9314.54.358898943540679
10314.253.304037933599837
11337.2519.972898304118743
12288.514.059397805975428
132786.1644140029689814
1429525.729360660537254
15246.2514.361406616345128
16236.255.737304826019514
1724229.56349099818963
18206.7512.841988423397229
19201.58.1034971874288119
20219.7520.982135258357345
21188.7517.075811352124235
221747.8740078740118118
2317123.734644158557251
24143.2512.175795661885927
25130.257.7620873481300118
26131.525.252062622024953
27999.6263527187957722
2880.513.916417163432131
2984.7522.440662497647749
3063.55.0662280511902211

\begin{tabular}{lllllllll}
\hline
Standard Deviation-Mean Plot \tabularnewline
Section & Mean & Standard Deviation & Range \tabularnewline
1 & 331.25 & 1.70782512765993 & 4 \tabularnewline
2 & 338.25 & 12.5266382827424 & 26 \tabularnewline
3 & 325 & 1.4142135623731 & 3 \tabularnewline
4 & 331 & 2.3094010767585 & 4 \tabularnewline
5 & 344.25 & 15.0194318578744 & 32 \tabularnewline
6 & 322 & 1.63299316185545 & 4 \tabularnewline
7 & 330 & 2.94392028877595 & 7 \tabularnewline
8 & 348.75 & 17.9698822107065 & 37 \tabularnewline
9 & 314.5 & 4.35889894354067 & 9 \tabularnewline
10 & 314.25 & 3.30403793359983 & 7 \tabularnewline
11 & 337.25 & 19.9728983041187 & 43 \tabularnewline
12 & 288.5 & 14.0593978059754 & 28 \tabularnewline
13 & 278 & 6.16441400296898 & 14 \tabularnewline
14 & 295 & 25.7293606605372 & 54 \tabularnewline
15 & 246.25 & 14.3614066163451 & 28 \tabularnewline
16 & 236.25 & 5.7373048260195 & 14 \tabularnewline
17 & 242 & 29.563490998189 & 63 \tabularnewline
18 & 206.75 & 12.8419884233972 & 29 \tabularnewline
19 & 201.5 & 8.10349718742881 & 19 \tabularnewline
20 & 219.75 & 20.9821352583573 & 45 \tabularnewline
21 & 188.75 & 17.0758113521242 & 35 \tabularnewline
22 & 174 & 7.87400787401181 & 18 \tabularnewline
23 & 171 & 23.7346441585572 & 51 \tabularnewline
24 & 143.25 & 12.1757956618859 & 27 \tabularnewline
25 & 130.25 & 7.76208734813001 & 18 \tabularnewline
26 & 131.5 & 25.2520626220249 & 53 \tabularnewline
27 & 99 & 9.62635271879577 & 22 \tabularnewline
28 & 80.5 & 13.9164171634321 & 31 \tabularnewline
29 & 84.75 & 22.4406624976477 & 49 \tabularnewline
30 & 63.5 & 5.06622805119022 & 11 \tabularnewline
\hline
\end{tabular}
%Source: https://freestatistics.org/blog/index.php?pk=78962&T=1

[TABLE]
[ROW][C]Standard Deviation-Mean Plot[/C][/ROW]
[ROW][C]Section[/C][C]Mean[/C][C]Standard Deviation[/C][C]Range[/C][/ROW]
[ROW][C]1[/C][C]331.25[/C][C]1.70782512765993[/C][C]4[/C][/ROW]
[ROW][C]2[/C][C]338.25[/C][C]12.5266382827424[/C][C]26[/C][/ROW]
[ROW][C]3[/C][C]325[/C][C]1.4142135623731[/C][C]3[/C][/ROW]
[ROW][C]4[/C][C]331[/C][C]2.3094010767585[/C][C]4[/C][/ROW]
[ROW][C]5[/C][C]344.25[/C][C]15.0194318578744[/C][C]32[/C][/ROW]
[ROW][C]6[/C][C]322[/C][C]1.63299316185545[/C][C]4[/C][/ROW]
[ROW][C]7[/C][C]330[/C][C]2.94392028877595[/C][C]7[/C][/ROW]
[ROW][C]8[/C][C]348.75[/C][C]17.9698822107065[/C][C]37[/C][/ROW]
[ROW][C]9[/C][C]314.5[/C][C]4.35889894354067[/C][C]9[/C][/ROW]
[ROW][C]10[/C][C]314.25[/C][C]3.30403793359983[/C][C]7[/C][/ROW]
[ROW][C]11[/C][C]337.25[/C][C]19.9728983041187[/C][C]43[/C][/ROW]
[ROW][C]12[/C][C]288.5[/C][C]14.0593978059754[/C][C]28[/C][/ROW]
[ROW][C]13[/C][C]278[/C][C]6.16441400296898[/C][C]14[/C][/ROW]
[ROW][C]14[/C][C]295[/C][C]25.7293606605372[/C][C]54[/C][/ROW]
[ROW][C]15[/C][C]246.25[/C][C]14.3614066163451[/C][C]28[/C][/ROW]
[ROW][C]16[/C][C]236.25[/C][C]5.7373048260195[/C][C]14[/C][/ROW]
[ROW][C]17[/C][C]242[/C][C]29.563490998189[/C][C]63[/C][/ROW]
[ROW][C]18[/C][C]206.75[/C][C]12.8419884233972[/C][C]29[/C][/ROW]
[ROW][C]19[/C][C]201.5[/C][C]8.10349718742881[/C][C]19[/C][/ROW]
[ROW][C]20[/C][C]219.75[/C][C]20.9821352583573[/C][C]45[/C][/ROW]
[ROW][C]21[/C][C]188.75[/C][C]17.0758113521242[/C][C]35[/C][/ROW]
[ROW][C]22[/C][C]174[/C][C]7.87400787401181[/C][C]18[/C][/ROW]
[ROW][C]23[/C][C]171[/C][C]23.7346441585572[/C][C]51[/C][/ROW]
[ROW][C]24[/C][C]143.25[/C][C]12.1757956618859[/C][C]27[/C][/ROW]
[ROW][C]25[/C][C]130.25[/C][C]7.76208734813001[/C][C]18[/C][/ROW]
[ROW][C]26[/C][C]131.5[/C][C]25.2520626220249[/C][C]53[/C][/ROW]
[ROW][C]27[/C][C]99[/C][C]9.62635271879577[/C][C]22[/C][/ROW]
[ROW][C]28[/C][C]80.5[/C][C]13.9164171634321[/C][C]31[/C][/ROW]
[ROW][C]29[/C][C]84.75[/C][C]22.4406624976477[/C][C]49[/C][/ROW]
[ROW][C]30[/C][C]63.5[/C][C]5.06622805119022[/C][C]11[/C][/ROW]
[/TABLE]
Source: https://freestatistics.org/blog/index.php?pk=78962&T=1

Globally Unique Identifier (entire table): ba.freestatistics.org/blog/index.php?pk=78962&T=1

As an alternative you can also use a QR Code:  

The GUIDs for individual cells are displayed in the table below:

Standard Deviation-Mean Plot
SectionMeanStandard DeviationRange
1331.251.707825127659934
2338.2512.526638282742426
33251.41421356237313
43312.30940107675854
5344.2515.019431857874432
63221.632993161855454
73302.943920288775957
8348.7517.969882210706537
9314.54.358898943540679
10314.253.304037933599837
11337.2519.972898304118743
12288.514.059397805975428
132786.1644140029689814
1429525.729360660537254
15246.2514.361406616345128
16236.255.737304826019514
1724229.56349099818963
18206.7512.841988423397229
19201.58.1034971874288119
20219.7520.982135258357345
21188.7517.075811352124235
221747.8740078740118118
2317123.734644158557251
24143.2512.175795661885927
25130.257.7620873481300118
26131.525.252062622024953
27999.6263527187957722
2880.513.916417163432131
2984.7522.440662497647749
3063.55.0662280511902211


Regression: S.E.(k) = alpha + beta * Mean(k)
alpha17.2875222484245
beta-0.0214976059401029
S.D.0.0163488224932178
T-STAT-1.31493298364582
p-value0.199200658932226

\begin{tabular}{lllllllll}
\hline
Regression: S.E.(k) = alpha + beta * Mean(k) \tabularnewline
alpha & 17.2875222484245 \tabularnewline
beta & -0.0214976059401029 \tabularnewline
S.D. & 0.0163488224932178 \tabularnewline
T-STAT & -1.31493298364582 \tabularnewline
p-value & 0.199200658932226 \tabularnewline
\hline
\end{tabular}
%Source: https://freestatistics.org/blog/index.php?pk=78962&T=2

[TABLE]
[ROW][C]Regression: S.E.(k) = alpha + beta * Mean(k)[/C][/ROW]
[ROW][C]alpha[/C][C]17.2875222484245[/C][/ROW]
[ROW][C]beta[/C][C]-0.0214976059401029[/C][/ROW]
[ROW][C]S.D.[/C][C]0.0163488224932178[/C][/ROW]
[ROW][C]T-STAT[/C][C]-1.31493298364582[/C][/ROW]
[ROW][C]p-value[/C][C]0.199200658932226[/C][/ROW]
[/TABLE]
Source: https://freestatistics.org/blog/index.php?pk=78962&T=2

Globally Unique Identifier (entire table): ba.freestatistics.org/blog/index.php?pk=78962&T=2

As an alternative you can also use a QR Code:  

The GUIDs for individual cells are displayed in the table below:

Regression: S.E.(k) = alpha + beta * Mean(k)
alpha17.2875222484245
beta-0.0214976059401029
S.D.0.0163488224932178
T-STAT-1.31493298364582
p-value0.199200658932226


Regression: ln S.E.(k) = alpha + beta * ln Mean(k)
alpha5.04169444590167
beta-0.530727102366918
S.D.0.328613750387784
T-STAT-1.61504837134973
p-value0.117514222729145
Lambda1.53072710236692

\begin{tabular}{lllllllll}
\hline
Regression: ln S.E.(k) = alpha + beta * ln Mean(k) \tabularnewline
alpha & 5.04169444590167 \tabularnewline
beta & -0.530727102366918 \tabularnewline
S.D. & 0.328613750387784 \tabularnewline
T-STAT & -1.61504837134973 \tabularnewline
p-value & 0.117514222729145 \tabularnewline
Lambda & 1.53072710236692 \tabularnewline
\hline
\end{tabular}
%Source: https://freestatistics.org/blog/index.php?pk=78962&T=3

[TABLE]
[ROW][C]Regression: ln S.E.(k) = alpha + beta * ln Mean(k)[/C][/ROW]
[ROW][C]alpha[/C][C]5.04169444590167[/C][/ROW]
[ROW][C]beta[/C][C]-0.530727102366918[/C][/ROW]
[ROW][C]S.D.[/C][C]0.328613750387784[/C][/ROW]
[ROW][C]T-STAT[/C][C]-1.61504837134973[/C][/ROW]
[ROW][C]p-value[/C][C]0.117514222729145[/C][/ROW]
[ROW][C]Lambda[/C][C]1.53072710236692[/C][/ROW]
[/TABLE]
Source: https://freestatistics.org/blog/index.php?pk=78962&T=3

Globally Unique Identifier (entire table): ba.freestatistics.org/blog/index.php?pk=78962&T=3

As an alternative you can also use a QR Code:  

The GUIDs for individual cells are displayed in the table below:

Regression: ln S.E.(k) = alpha + beta * ln Mean(k)
alpha5.04169444590167
beta-0.530727102366918
S.D.0.328613750387784
T-STAT-1.61504837134973
p-value0.117514222729145
Lambda1.53072710236692


Parameters (Session):
par1 = 4 ;
Parameters (R input):
par1 = 4 ;
R code (references can be found in the software module):
par1 <- as.numeric(par1)
(n <- length(x))
(np <- floor(n / par1))
arr <- array(NA,dim=c(par1,np))
j <- 0
k <- 1
for (i in 1:(np*par1))
{
j = j + 1
arr[j,k] <- x[i]
if (j == par1) {
j = 0
k=k+1
}
}
arr
arr.mean <- array(NA,dim=np)
arr.sd <- array(NA,dim=np)
arr.range <- array(NA,dim=np)
for (j in 1:np)
{
arr.mean[j] <- mean(arr[,j],na.rm=TRUE)
arr.sd[j] <- sd(arr[,j],na.rm=TRUE)
arr.range[j] <- max(arr[,j],na.rm=TRUE) - min(arr[,j],na.rm=TRUE)
}
arr.mean
arr.sd
arr.range
(lm1 <- lm(arr.sd~arr.mean))
(lnlm1 <- lm(log(arr.sd)~log(arr.mean)))
(lm2 <- lm(arr.range~arr.mean))
bitmap(file='test1.png')
plot(arr.mean,arr.sd,main='Standard Deviation-Mean Plot',xlab='mean',ylab='standard deviation')
dev.off()
bitmap(file='test2.png')
plot(arr.mean,arr.range,main='Range-Mean Plot',xlab='mean',ylab='range')
dev.off()
load(file='createtable')
a<-table.start()
a<-table.row.start(a)
a<-table.element(a,'Standard Deviation-Mean Plot',4,TRUE)
a<-table.row.end(a)
a<-table.row.start(a)
a<-table.element(a,'Section',header=TRUE)
a<-table.element(a,'Mean',header=TRUE)
a<-table.element(a,'Standard Deviation',header=TRUE)
a<-table.element(a,'Range',header=TRUE)
a<-table.row.end(a)
for (j in 1:np) {
a<-table.row.start(a)
a<-table.element(a,j,header=TRUE)
a<-table.element(a,arr.mean[j])
a<-table.element(a,arr.sd[j] )
a<-table.element(a,arr.range[j] )
a<-table.row.end(a)
}
a<-table.end(a)
table.save(a,file='mytable.tab')
a<-table.start()
a<-table.row.start(a)
a<-table.element(a,'Regression: S.E.(k) = alpha + beta * Mean(k)',2,TRUE)
a<-table.row.end(a)
a<-table.row.start(a)
a<-table.element(a,'alpha',header=TRUE)
a<-table.element(a,lm1$coefficients[[1]])
a<-table.row.end(a)
a<-table.row.start(a)
a<-table.element(a,'beta',header=TRUE)
a<-table.element(a,lm1$coefficients[[2]])
a<-table.row.end(a)
a<-table.row.start(a)
a<-table.element(a,'S.D.',header=TRUE)
a<-table.element(a,summary(lm1)$coefficients[2,2])
a<-table.row.end(a)
a<-table.row.start(a)
a<-table.element(a,'T-STAT',header=TRUE)
a<-table.element(a,summary(lm1)$coefficients[2,3])
a<-table.row.end(a)
a<-table.row.start(a)
a<-table.element(a,'p-value',header=TRUE)
a<-table.element(a,summary(lm1)$coefficients[2,4])
a<-table.row.end(a)
a<-table.end(a)
table.save(a,file='mytable1.tab')
a<-table.start()
a<-table.row.start(a)
a<-table.element(a,'Regression: ln S.E.(k) = alpha + beta * ln Mean(k)',2,TRUE)
a<-table.row.end(a)
a<-table.row.start(a)
a<-table.element(a,'alpha',header=TRUE)
a<-table.element(a,lnlm1$coefficients[[1]])
a<-table.row.end(a)
a<-table.row.start(a)
a<-table.element(a,'beta',header=TRUE)
a<-table.element(a,lnlm1$coefficients[[2]])
a<-table.row.end(a)
a<-table.row.start(a)
a<-table.element(a,'S.D.',header=TRUE)
a<-table.element(a,summary(lnlm1)$coefficients[2,2])
a<-table.row.end(a)
a<-table.row.start(a)
a<-table.element(a,'T-STAT',header=TRUE)
a<-table.element(a,summary(lnlm1)$coefficients[2,3])
a<-table.row.end(a)
a<-table.row.start(a)
a<-table.element(a,'p-value',header=TRUE)
a<-table.element(a,summary(lnlm1)$coefficients[2,4])
a<-table.row.end(a)
a<-table.row.start(a)
a<-table.element(a,'Lambda',header=TRUE)
a<-table.element(a,1-lnlm1$coefficients[[2]])
a<-table.row.end(a)
a<-table.end(a)
table.save(a,file='mytable2.tab')