Free Statistics

of Irreproducible Research!

Author's title

Author*Unverified author*
R Software Modulerwasp_autocorrelation.wasp
Title produced by software(Partial) Autocorrelation Function
Date of computationMon, 16 Aug 2010 10:54:49 +0000
Cite this page as followsStatistical Computations at FreeStatistics.org, Office for Research Development and Education, URL https://freestatistics.org/blog/index.php?v=date/2010/Aug/16/t1281956092dyklmk5opd7z1af.htm/, Retrieved Thu, 16 May 2024 10:33:55 +0000
Statistical Computations at FreeStatistics.org, Office for Research Development and Education, URL https://freestatistics.org/blog/index.php?pk=78950, Retrieved Thu, 16 May 2024 10:33:55 +0000
QR Codes:

Original text written by user:
IsPrivate?No (this computation is public)
User-defined keywordsMagali De Reu
Estimated Impact137
Family? (F = Feedback message, R = changed R code, M = changed R Module, P = changed Parameters, D = changed Data)
-       [(Partial) Autocorrelation Function] [tijdreeks 1 stap 21] [2010-08-16 10:54:49] [07915b1f88a41fb8d82e27c5eaa7bbed] [Current]
Feedback Forum

Post a new message
Dataseries X:
333
332
331
329
349
348
333
323
324
324
325
327
329
333
329
333
355
358
338
326
320
322
322
324
326
330
331
333
364
363
341
327
313
321
312
312
312
314
312
319
356
351
329
313
298
303
278
275
276
276
273
287
320
313
281
266
258
259
237
231
237
236
229
243
271
262
227
208
212
222
200
193
204
203
190
209
240
234
210
195
202
204
180
169
178
181
163
174
194
187
160
143
151
154
141
127
134
138
120
129
151
152
124
99
104
109
96
87
94
89
63
76
100
104
80
55
60
71
62
61


Summary of computational transaction
Raw Inputview raw input (R code)
Raw Outputview raw output of R engine
Computing time1 seconds
R Server'Gwilym Jenkins' @ 72.249.127.135

\begin{tabular}{lllllllll}
\hline
Summary of computational transaction \tabularnewline
Raw Input & view raw input (R code)  \tabularnewline
Raw Output & view raw output of R engine  \tabularnewline
Computing time & 1 seconds \tabularnewline
R Server & 'Gwilym Jenkins' @ 72.249.127.135 \tabularnewline
\hline
\end{tabular}
%Source: https://freestatistics.org/blog/index.php?pk=78950&T=0

[TABLE]
[ROW][C]Summary of computational transaction[/C][/ROW]
[ROW][C]Raw Input[/C][C]view raw input (R code) [/C][/ROW]
[ROW][C]Raw Output[/C][C]view raw output of R engine [/C][/ROW]
[ROW][C]Computing time[/C][C]1 seconds[/C][/ROW]
[ROW][C]R Server[/C][C]'Gwilym Jenkins' @ 72.249.127.135[/C][/ROW]
[/TABLE]
Source: https://freestatistics.org/blog/index.php?pk=78950&T=0

Globally Unique Identifier (entire table): ba.freestatistics.org/blog/index.php?pk=78950&T=0

As an alternative you can also use a QR Code:  

The GUIDs for individual cells are displayed in the table below:

Summary of computational transaction
Raw Inputview raw input (R code)
Raw Outputview raw output of R engine
Computing time1 seconds
R Server'Gwilym Jenkins' @ 72.249.127.135


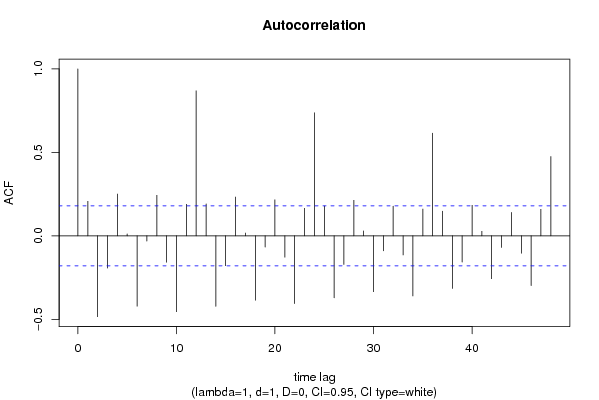
Autocorrelation Function
Time lag kACF(k)T-STATP-value
10.2073072.26150.012773
2-0.483908-5.27880
3-0.192968-2.1050.018696
40.2504572.73220.003625
50.0116550.12710.449522
6-0.421099-4.59375e-06
7-0.031417-0.34270.366208
80.2427192.64780.0046
9-0.157464-1.71770.044224
10-0.454033-4.95291e-06
110.1888842.06050.020766
120.8692379.48230
130.1912632.08640.019538
14-0.422269-4.60645e-06
15-0.178727-1.94970.026783
160.2321512.53250.006314
170.0168350.18360.427302
18-0.384947-4.19932.6e-05
19-0.066964-0.73050.233263
200.2163112.35970.009959
21-0.128041-1.39680.082543
22-0.405262-4.42091.1e-05
230.1653761.8040.036878
240.7370548.04030
250.1785031.94720.026931
26-0.370869-4.04574.7e-05
27-0.171073-1.86620.032239
280.2132712.32650.010841
290.0292710.31930.375027
30-0.334092-3.64450.000199
31-0.089532-0.97670.165356
320.1775381.93670.027576
33-0.113918-1.24270.108212
34-0.359503-3.92177.4e-05
350.1603751.74950.041393
360.615016.7090
370.1475961.61010.055015
38-0.314522-3.4310.000414
39-0.156908-1.71170.044782
400.1830451.99680.024066
410.0275320.30030.382223
42-0.256484-2.79790.003001
43-0.069377-0.75680.225328
440.1404811.53250.064031
45-0.103926-1.13370.1296
46-0.297343-3.24360.000766
470.1592691.73740.04245
480.4749495.18110

\begin{tabular}{lllllllll}
\hline
Autocorrelation Function \tabularnewline
Time lag k & ACF(k) & T-STAT & P-value \tabularnewline
1 & 0.207307 & 2.2615 & 0.012773 \tabularnewline
2 & -0.483908 & -5.2788 & 0 \tabularnewline
3 & -0.192968 & -2.105 & 0.018696 \tabularnewline
4 & 0.250457 & 2.7322 & 0.003625 \tabularnewline
5 & 0.011655 & 0.1271 & 0.449522 \tabularnewline
6 & -0.421099 & -4.5937 & 5e-06 \tabularnewline
7 & -0.031417 & -0.3427 & 0.366208 \tabularnewline
8 & 0.242719 & 2.6478 & 0.0046 \tabularnewline
9 & -0.157464 & -1.7177 & 0.044224 \tabularnewline
10 & -0.454033 & -4.9529 & 1e-06 \tabularnewline
11 & 0.188884 & 2.0605 & 0.020766 \tabularnewline
12 & 0.869237 & 9.4823 & 0 \tabularnewline
13 & 0.191263 & 2.0864 & 0.019538 \tabularnewline
14 & -0.422269 & -4.6064 & 5e-06 \tabularnewline
15 & -0.178727 & -1.9497 & 0.026783 \tabularnewline
16 & 0.232151 & 2.5325 & 0.006314 \tabularnewline
17 & 0.016835 & 0.1836 & 0.427302 \tabularnewline
18 & -0.384947 & -4.1993 & 2.6e-05 \tabularnewline
19 & -0.066964 & -0.7305 & 0.233263 \tabularnewline
20 & 0.216311 & 2.3597 & 0.009959 \tabularnewline
21 & -0.128041 & -1.3968 & 0.082543 \tabularnewline
22 & -0.405262 & -4.4209 & 1.1e-05 \tabularnewline
23 & 0.165376 & 1.804 & 0.036878 \tabularnewline
24 & 0.737054 & 8.0403 & 0 \tabularnewline
25 & 0.178503 & 1.9472 & 0.026931 \tabularnewline
26 & -0.370869 & -4.0457 & 4.7e-05 \tabularnewline
27 & -0.171073 & -1.8662 & 0.032239 \tabularnewline
28 & 0.213271 & 2.3265 & 0.010841 \tabularnewline
29 & 0.029271 & 0.3193 & 0.375027 \tabularnewline
30 & -0.334092 & -3.6445 & 0.000199 \tabularnewline
31 & -0.089532 & -0.9767 & 0.165356 \tabularnewline
32 & 0.177538 & 1.9367 & 0.027576 \tabularnewline
33 & -0.113918 & -1.2427 & 0.108212 \tabularnewline
34 & -0.359503 & -3.9217 & 7.4e-05 \tabularnewline
35 & 0.160375 & 1.7495 & 0.041393 \tabularnewline
36 & 0.61501 & 6.709 & 0 \tabularnewline
37 & 0.147596 & 1.6101 & 0.055015 \tabularnewline
38 & -0.314522 & -3.431 & 0.000414 \tabularnewline
39 & -0.156908 & -1.7117 & 0.044782 \tabularnewline
40 & 0.183045 & 1.9968 & 0.024066 \tabularnewline
41 & 0.027532 & 0.3003 & 0.382223 \tabularnewline
42 & -0.256484 & -2.7979 & 0.003001 \tabularnewline
43 & -0.069377 & -0.7568 & 0.225328 \tabularnewline
44 & 0.140481 & 1.5325 & 0.064031 \tabularnewline
45 & -0.103926 & -1.1337 & 0.1296 \tabularnewline
46 & -0.297343 & -3.2436 & 0.000766 \tabularnewline
47 & 0.159269 & 1.7374 & 0.04245 \tabularnewline
48 & 0.474949 & 5.1811 & 0 \tabularnewline
\hline
\end{tabular}
%Source: https://freestatistics.org/blog/index.php?pk=78950&T=1

[TABLE]
[ROW][C]Autocorrelation Function[/C][/ROW]
[ROW][C]Time lag k[/C][C]ACF(k)[/C][C]T-STAT[/C][C]P-value[/C][/ROW]
[ROW][C]1[/C][C]0.207307[/C][C]2.2615[/C][C]0.012773[/C][/ROW]
[ROW][C]2[/C][C]-0.483908[/C][C]-5.2788[/C][C]0[/C][/ROW]
[ROW][C]3[/C][C]-0.192968[/C][C]-2.105[/C][C]0.018696[/C][/ROW]
[ROW][C]4[/C][C]0.250457[/C][C]2.7322[/C][C]0.003625[/C][/ROW]
[ROW][C]5[/C][C]0.011655[/C][C]0.1271[/C][C]0.449522[/C][/ROW]
[ROW][C]6[/C][C]-0.421099[/C][C]-4.5937[/C][C]5e-06[/C][/ROW]
[ROW][C]7[/C][C]-0.031417[/C][C]-0.3427[/C][C]0.366208[/C][/ROW]
[ROW][C]8[/C][C]0.242719[/C][C]2.6478[/C][C]0.0046[/C][/ROW]
[ROW][C]9[/C][C]-0.157464[/C][C]-1.7177[/C][C]0.044224[/C][/ROW]
[ROW][C]10[/C][C]-0.454033[/C][C]-4.9529[/C][C]1e-06[/C][/ROW]
[ROW][C]11[/C][C]0.188884[/C][C]2.0605[/C][C]0.020766[/C][/ROW]
[ROW][C]12[/C][C]0.869237[/C][C]9.4823[/C][C]0[/C][/ROW]
[ROW][C]13[/C][C]0.191263[/C][C]2.0864[/C][C]0.019538[/C][/ROW]
[ROW][C]14[/C][C]-0.422269[/C][C]-4.6064[/C][C]5e-06[/C][/ROW]
[ROW][C]15[/C][C]-0.178727[/C][C]-1.9497[/C][C]0.026783[/C][/ROW]
[ROW][C]16[/C][C]0.232151[/C][C]2.5325[/C][C]0.006314[/C][/ROW]
[ROW][C]17[/C][C]0.016835[/C][C]0.1836[/C][C]0.427302[/C][/ROW]
[ROW][C]18[/C][C]-0.384947[/C][C]-4.1993[/C][C]2.6e-05[/C][/ROW]
[ROW][C]19[/C][C]-0.066964[/C][C]-0.7305[/C][C]0.233263[/C][/ROW]
[ROW][C]20[/C][C]0.216311[/C][C]2.3597[/C][C]0.009959[/C][/ROW]
[ROW][C]21[/C][C]-0.128041[/C][C]-1.3968[/C][C]0.082543[/C][/ROW]
[ROW][C]22[/C][C]-0.405262[/C][C]-4.4209[/C][C]1.1e-05[/C][/ROW]
[ROW][C]23[/C][C]0.165376[/C][C]1.804[/C][C]0.036878[/C][/ROW]
[ROW][C]24[/C][C]0.737054[/C][C]8.0403[/C][C]0[/C][/ROW]
[ROW][C]25[/C][C]0.178503[/C][C]1.9472[/C][C]0.026931[/C][/ROW]
[ROW][C]26[/C][C]-0.370869[/C][C]-4.0457[/C][C]4.7e-05[/C][/ROW]
[ROW][C]27[/C][C]-0.171073[/C][C]-1.8662[/C][C]0.032239[/C][/ROW]
[ROW][C]28[/C][C]0.213271[/C][C]2.3265[/C][C]0.010841[/C][/ROW]
[ROW][C]29[/C][C]0.029271[/C][C]0.3193[/C][C]0.375027[/C][/ROW]
[ROW][C]30[/C][C]-0.334092[/C][C]-3.6445[/C][C]0.000199[/C][/ROW]
[ROW][C]31[/C][C]-0.089532[/C][C]-0.9767[/C][C]0.165356[/C][/ROW]
[ROW][C]32[/C][C]0.177538[/C][C]1.9367[/C][C]0.027576[/C][/ROW]
[ROW][C]33[/C][C]-0.113918[/C][C]-1.2427[/C][C]0.108212[/C][/ROW]
[ROW][C]34[/C][C]-0.359503[/C][C]-3.9217[/C][C]7.4e-05[/C][/ROW]
[ROW][C]35[/C][C]0.160375[/C][C]1.7495[/C][C]0.041393[/C][/ROW]
[ROW][C]36[/C][C]0.61501[/C][C]6.709[/C][C]0[/C][/ROW]
[ROW][C]37[/C][C]0.147596[/C][C]1.6101[/C][C]0.055015[/C][/ROW]
[ROW][C]38[/C][C]-0.314522[/C][C]-3.431[/C][C]0.000414[/C][/ROW]
[ROW][C]39[/C][C]-0.156908[/C][C]-1.7117[/C][C]0.044782[/C][/ROW]
[ROW][C]40[/C][C]0.183045[/C][C]1.9968[/C][C]0.024066[/C][/ROW]
[ROW][C]41[/C][C]0.027532[/C][C]0.3003[/C][C]0.382223[/C][/ROW]
[ROW][C]42[/C][C]-0.256484[/C][C]-2.7979[/C][C]0.003001[/C][/ROW]
[ROW][C]43[/C][C]-0.069377[/C][C]-0.7568[/C][C]0.225328[/C][/ROW]
[ROW][C]44[/C][C]0.140481[/C][C]1.5325[/C][C]0.064031[/C][/ROW]
[ROW][C]45[/C][C]-0.103926[/C][C]-1.1337[/C][C]0.1296[/C][/ROW]
[ROW][C]46[/C][C]-0.297343[/C][C]-3.2436[/C][C]0.000766[/C][/ROW]
[ROW][C]47[/C][C]0.159269[/C][C]1.7374[/C][C]0.04245[/C][/ROW]
[ROW][C]48[/C][C]0.474949[/C][C]5.1811[/C][C]0[/C][/ROW]
[/TABLE]
Source: https://freestatistics.org/blog/index.php?pk=78950&T=1

Globally Unique Identifier (entire table): ba.freestatistics.org/blog/index.php?pk=78950&T=1

As an alternative you can also use a QR Code:  

The GUIDs for individual cells are displayed in the table below:

Autocorrelation Function
Time lag kACF(k)T-STATP-value
10.2073072.26150.012773
2-0.483908-5.27880
3-0.192968-2.1050.018696
40.2504572.73220.003625
50.0116550.12710.449522
6-0.421099-4.59375e-06
7-0.031417-0.34270.366208
80.2427192.64780.0046
9-0.157464-1.71770.044224
10-0.454033-4.95291e-06
110.1888842.06050.020766
120.8692379.48230
130.1912632.08640.019538
14-0.422269-4.60645e-06
15-0.178727-1.94970.026783
160.2321512.53250.006314
170.0168350.18360.427302
18-0.384947-4.19932.6e-05
19-0.066964-0.73050.233263
200.2163112.35970.009959
21-0.128041-1.39680.082543
22-0.405262-4.42091.1e-05
230.1653761.8040.036878
240.7370548.04030
250.1785031.94720.026931
26-0.370869-4.04574.7e-05
27-0.171073-1.86620.032239
280.2132712.32650.010841
290.0292710.31930.375027
30-0.334092-3.64450.000199
31-0.089532-0.97670.165356
320.1775381.93670.027576
33-0.113918-1.24270.108212
34-0.359503-3.92177.4e-05
350.1603751.74950.041393
360.615016.7090
370.1475961.61010.055015
38-0.314522-3.4310.000414
39-0.156908-1.71170.044782
400.1830451.99680.024066
410.0275320.30030.382223
42-0.256484-2.79790.003001
43-0.069377-0.75680.225328
440.1404811.53250.064031
45-0.103926-1.13370.1296
46-0.297343-3.24360.000766
470.1592691.73740.04245
480.4749495.18110


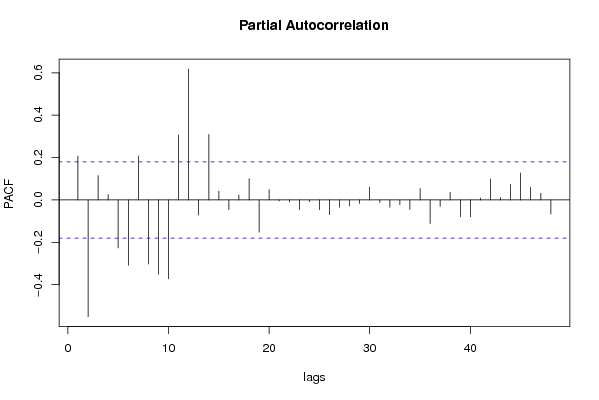
Partial Autocorrelation Function
Time lag kPACF(k)T-STATP-value
10.2073072.26150.012773
2-0.550545-6.00570
30.1150181.25470.106024
40.0251570.27440.392116
5-0.226159-2.46710.007522
6-0.307587-3.35540.000532
70.2077072.26580.012635
8-0.302538-3.30030.000637
9-0.350534-3.82390.000105
10-0.372008-4.05814.4e-05
110.3065723.34430.000552
120.6179416.74090
13-0.071562-0.78060.21828
140.3087853.36840.00051
150.0416040.45380.325382
16-0.046612-0.50850.30603
170.0235330.25670.398923
180.1004411.09570.137714
19-0.151823-1.65620.050158
200.0483290.52720.299515
21-0.004671-0.0510.479724
22-0.009385-0.10240.459313
23-0.045359-0.49480.310822
24-0.008064-0.0880.465025
25-0.046124-0.50310.307894
26-0.06954-0.75860.224799
27-0.034678-0.37830.352945
28-0.028188-0.30750.379501
29-0.017333-0.18910.425176
300.0594680.64870.258884
31-0.012489-0.13620.445931
32-0.03443-0.37560.353948
33-0.022375-0.24410.403795
34-0.044871-0.48950.312698
350.0538670.58760.278949
36-0.111046-1.21140.114076
37-0.030832-0.33630.368603
380.0359440.39210.347841
39-0.079616-0.86850.193433
40-0.079115-0.8630.194926
410.0089010.09710.461408
420.0992171.08230.140647
430.0120260.13120.447924
440.0740460.80770.210425
450.1268511.38380.084508
460.0590090.64370.260502
470.0315430.34410.365693
48-0.06644-0.72480.235008

\begin{tabular}{lllllllll}
\hline
Partial Autocorrelation Function \tabularnewline
Time lag k & PACF(k) & T-STAT & P-value \tabularnewline
1 & 0.207307 & 2.2615 & 0.012773 \tabularnewline
2 & -0.550545 & -6.0057 & 0 \tabularnewline
3 & 0.115018 & 1.2547 & 0.106024 \tabularnewline
4 & 0.025157 & 0.2744 & 0.392116 \tabularnewline
5 & -0.226159 & -2.4671 & 0.007522 \tabularnewline
6 & -0.307587 & -3.3554 & 0.000532 \tabularnewline
7 & 0.207707 & 2.2658 & 0.012635 \tabularnewline
8 & -0.302538 & -3.3003 & 0.000637 \tabularnewline
9 & -0.350534 & -3.8239 & 0.000105 \tabularnewline
10 & -0.372008 & -4.0581 & 4.4e-05 \tabularnewline
11 & 0.306572 & 3.3443 & 0.000552 \tabularnewline
12 & 0.617941 & 6.7409 & 0 \tabularnewline
13 & -0.071562 & -0.7806 & 0.21828 \tabularnewline
14 & 0.308785 & 3.3684 & 0.00051 \tabularnewline
15 & 0.041604 & 0.4538 & 0.325382 \tabularnewline
16 & -0.046612 & -0.5085 & 0.30603 \tabularnewline
17 & 0.023533 & 0.2567 & 0.398923 \tabularnewline
18 & 0.100441 & 1.0957 & 0.137714 \tabularnewline
19 & -0.151823 & -1.6562 & 0.050158 \tabularnewline
20 & 0.048329 & 0.5272 & 0.299515 \tabularnewline
21 & -0.004671 & -0.051 & 0.479724 \tabularnewline
22 & -0.009385 & -0.1024 & 0.459313 \tabularnewline
23 & -0.045359 & -0.4948 & 0.310822 \tabularnewline
24 & -0.008064 & -0.088 & 0.465025 \tabularnewline
25 & -0.046124 & -0.5031 & 0.307894 \tabularnewline
26 & -0.06954 & -0.7586 & 0.224799 \tabularnewline
27 & -0.034678 & -0.3783 & 0.352945 \tabularnewline
28 & -0.028188 & -0.3075 & 0.379501 \tabularnewline
29 & -0.017333 & -0.1891 & 0.425176 \tabularnewline
30 & 0.059468 & 0.6487 & 0.258884 \tabularnewline
31 & -0.012489 & -0.1362 & 0.445931 \tabularnewline
32 & -0.03443 & -0.3756 & 0.353948 \tabularnewline
33 & -0.022375 & -0.2441 & 0.403795 \tabularnewline
34 & -0.044871 & -0.4895 & 0.312698 \tabularnewline
35 & 0.053867 & 0.5876 & 0.278949 \tabularnewline
36 & -0.111046 & -1.2114 & 0.114076 \tabularnewline
37 & -0.030832 & -0.3363 & 0.368603 \tabularnewline
38 & 0.035944 & 0.3921 & 0.347841 \tabularnewline
39 & -0.079616 & -0.8685 & 0.193433 \tabularnewline
40 & -0.079115 & -0.863 & 0.194926 \tabularnewline
41 & 0.008901 & 0.0971 & 0.461408 \tabularnewline
42 & 0.099217 & 1.0823 & 0.140647 \tabularnewline
43 & 0.012026 & 0.1312 & 0.447924 \tabularnewline
44 & 0.074046 & 0.8077 & 0.210425 \tabularnewline
45 & 0.126851 & 1.3838 & 0.084508 \tabularnewline
46 & 0.059009 & 0.6437 & 0.260502 \tabularnewline
47 & 0.031543 & 0.3441 & 0.365693 \tabularnewline
48 & -0.06644 & -0.7248 & 0.235008 \tabularnewline
\hline
\end{tabular}
%Source: https://freestatistics.org/blog/index.php?pk=78950&T=2

[TABLE]
[ROW][C]Partial Autocorrelation Function[/C][/ROW]
[ROW][C]Time lag k[/C][C]PACF(k)[/C][C]T-STAT[/C][C]P-value[/C][/ROW]
[ROW][C]1[/C][C]0.207307[/C][C]2.2615[/C][C]0.012773[/C][/ROW]
[ROW][C]2[/C][C]-0.550545[/C][C]-6.0057[/C][C]0[/C][/ROW]
[ROW][C]3[/C][C]0.115018[/C][C]1.2547[/C][C]0.106024[/C][/ROW]
[ROW][C]4[/C][C]0.025157[/C][C]0.2744[/C][C]0.392116[/C][/ROW]
[ROW][C]5[/C][C]-0.226159[/C][C]-2.4671[/C][C]0.007522[/C][/ROW]
[ROW][C]6[/C][C]-0.307587[/C][C]-3.3554[/C][C]0.000532[/C][/ROW]
[ROW][C]7[/C][C]0.207707[/C][C]2.2658[/C][C]0.012635[/C][/ROW]
[ROW][C]8[/C][C]-0.302538[/C][C]-3.3003[/C][C]0.000637[/C][/ROW]
[ROW][C]9[/C][C]-0.350534[/C][C]-3.8239[/C][C]0.000105[/C][/ROW]
[ROW][C]10[/C][C]-0.372008[/C][C]-4.0581[/C][C]4.4e-05[/C][/ROW]
[ROW][C]11[/C][C]0.306572[/C][C]3.3443[/C][C]0.000552[/C][/ROW]
[ROW][C]12[/C][C]0.617941[/C][C]6.7409[/C][C]0[/C][/ROW]
[ROW][C]13[/C][C]-0.071562[/C][C]-0.7806[/C][C]0.21828[/C][/ROW]
[ROW][C]14[/C][C]0.308785[/C][C]3.3684[/C][C]0.00051[/C][/ROW]
[ROW][C]15[/C][C]0.041604[/C][C]0.4538[/C][C]0.325382[/C][/ROW]
[ROW][C]16[/C][C]-0.046612[/C][C]-0.5085[/C][C]0.30603[/C][/ROW]
[ROW][C]17[/C][C]0.023533[/C][C]0.2567[/C][C]0.398923[/C][/ROW]
[ROW][C]18[/C][C]0.100441[/C][C]1.0957[/C][C]0.137714[/C][/ROW]
[ROW][C]19[/C][C]-0.151823[/C][C]-1.6562[/C][C]0.050158[/C][/ROW]
[ROW][C]20[/C][C]0.048329[/C][C]0.5272[/C][C]0.299515[/C][/ROW]
[ROW][C]21[/C][C]-0.004671[/C][C]-0.051[/C][C]0.479724[/C][/ROW]
[ROW][C]22[/C][C]-0.009385[/C][C]-0.1024[/C][C]0.459313[/C][/ROW]
[ROW][C]23[/C][C]-0.045359[/C][C]-0.4948[/C][C]0.310822[/C][/ROW]
[ROW][C]24[/C][C]-0.008064[/C][C]-0.088[/C][C]0.465025[/C][/ROW]
[ROW][C]25[/C][C]-0.046124[/C][C]-0.5031[/C][C]0.307894[/C][/ROW]
[ROW][C]26[/C][C]-0.06954[/C][C]-0.7586[/C][C]0.224799[/C][/ROW]
[ROW][C]27[/C][C]-0.034678[/C][C]-0.3783[/C][C]0.352945[/C][/ROW]
[ROW][C]28[/C][C]-0.028188[/C][C]-0.3075[/C][C]0.379501[/C][/ROW]
[ROW][C]29[/C][C]-0.017333[/C][C]-0.1891[/C][C]0.425176[/C][/ROW]
[ROW][C]30[/C][C]0.059468[/C][C]0.6487[/C][C]0.258884[/C][/ROW]
[ROW][C]31[/C][C]-0.012489[/C][C]-0.1362[/C][C]0.445931[/C][/ROW]
[ROW][C]32[/C][C]-0.03443[/C][C]-0.3756[/C][C]0.353948[/C][/ROW]
[ROW][C]33[/C][C]-0.022375[/C][C]-0.2441[/C][C]0.403795[/C][/ROW]
[ROW][C]34[/C][C]-0.044871[/C][C]-0.4895[/C][C]0.312698[/C][/ROW]
[ROW][C]35[/C][C]0.053867[/C][C]0.5876[/C][C]0.278949[/C][/ROW]
[ROW][C]36[/C][C]-0.111046[/C][C]-1.2114[/C][C]0.114076[/C][/ROW]
[ROW][C]37[/C][C]-0.030832[/C][C]-0.3363[/C][C]0.368603[/C][/ROW]
[ROW][C]38[/C][C]0.035944[/C][C]0.3921[/C][C]0.347841[/C][/ROW]
[ROW][C]39[/C][C]-0.079616[/C][C]-0.8685[/C][C]0.193433[/C][/ROW]
[ROW][C]40[/C][C]-0.079115[/C][C]-0.863[/C][C]0.194926[/C][/ROW]
[ROW][C]41[/C][C]0.008901[/C][C]0.0971[/C][C]0.461408[/C][/ROW]
[ROW][C]42[/C][C]0.099217[/C][C]1.0823[/C][C]0.140647[/C][/ROW]
[ROW][C]43[/C][C]0.012026[/C][C]0.1312[/C][C]0.447924[/C][/ROW]
[ROW][C]44[/C][C]0.074046[/C][C]0.8077[/C][C]0.210425[/C][/ROW]
[ROW][C]45[/C][C]0.126851[/C][C]1.3838[/C][C]0.084508[/C][/ROW]
[ROW][C]46[/C][C]0.059009[/C][C]0.6437[/C][C]0.260502[/C][/ROW]
[ROW][C]47[/C][C]0.031543[/C][C]0.3441[/C][C]0.365693[/C][/ROW]
[ROW][C]48[/C][C]-0.06644[/C][C]-0.7248[/C][C]0.235008[/C][/ROW]
[/TABLE]
Source: https://freestatistics.org/blog/index.php?pk=78950&T=2

Globally Unique Identifier (entire table): ba.freestatistics.org/blog/index.php?pk=78950&T=2

As an alternative you can also use a QR Code:  

The GUIDs for individual cells are displayed in the table below:

Partial Autocorrelation Function
Time lag kPACF(k)T-STATP-value
10.2073072.26150.012773
2-0.550545-6.00570
30.1150181.25470.106024
40.0251570.27440.392116
5-0.226159-2.46710.007522
6-0.307587-3.35540.000532
70.2077072.26580.012635
8-0.302538-3.30030.000637
9-0.350534-3.82390.000105
10-0.372008-4.05814.4e-05
110.3065723.34430.000552
120.6179416.74090
13-0.071562-0.78060.21828
140.3087853.36840.00051
150.0416040.45380.325382
16-0.046612-0.50850.30603
170.0235330.25670.398923
180.1004411.09570.137714
19-0.151823-1.65620.050158
200.0483290.52720.299515
21-0.004671-0.0510.479724
22-0.009385-0.10240.459313
23-0.045359-0.49480.310822
24-0.008064-0.0880.465025
25-0.046124-0.50310.307894
26-0.06954-0.75860.224799
27-0.034678-0.37830.352945
28-0.028188-0.30750.379501
29-0.017333-0.18910.425176
300.0594680.64870.258884
31-0.012489-0.13620.445931
32-0.03443-0.37560.353948
33-0.022375-0.24410.403795
34-0.044871-0.48950.312698
350.0538670.58760.278949
36-0.111046-1.21140.114076
37-0.030832-0.33630.368603
380.0359440.39210.347841
39-0.079616-0.86850.193433
40-0.079115-0.8630.194926
410.0089010.09710.461408
420.0992171.08230.140647
430.0120260.13120.447924
440.0740460.80770.210425
450.1268511.38380.084508
460.0590090.64370.260502
470.0315430.34410.365693
48-0.06644-0.72480.235008


Parameters (Session):
par1 = 48 ; par2 = 1 ; par3 = 1 ; par4 = 0 ; par5 = 12 ; par6 = White Noise ; par7 = 0.95 ;
Parameters (R input):
par1 = 48 ; par2 = 1 ; par3 = 1 ; par4 = 0 ; par5 = 12 ; par6 = White Noise ; par7 = 0.95 ;
R code (references can be found in the software module):
if (par1 == 'Default') {
par1 = 10*log10(length(x))
} else {
par1 <- as.numeric(par1)
}
par2 <- as.numeric(par2)
par3 <- as.numeric(par3)
par4 <- as.numeric(par4)
par5 <- as.numeric(par5)
if (par6 == 'White Noise') par6 <- 'white' else par6 <- 'ma'
par7 <- as.numeric(par7)
if (par2 == 0) {
x <- log(x)
} else {
x <- (x ^ par2 - 1) / par2
}
if (par3 > 0) x <- diff(x,lag=1,difference=par3)
if (par4 > 0) x <- diff(x,lag=par5,difference=par4)
bitmap(file='pic1.png')
racf <- acf(x, par1, main='Autocorrelation', xlab='time lag', ylab='ACF', ci.type=par6, ci=par7, sub=paste('(lambda=',par2,', d=',par3,', D=',par4,', CI=', par7, ', CI type=',par6,')',sep=''))
dev.off()
bitmap(file='pic2.png')
rpacf <- pacf(x,par1,main='Partial Autocorrelation',xlab='lags',ylab='PACF')
dev.off()
(myacf <- c(racf$acf))
(mypacf <- c(rpacf$acf))
lengthx <- length(x)
sqrtn <- sqrt(lengthx)
load(file='createtable')
a<-table.start()
a<-table.row.start(a)
a<-table.element(a,'Autocorrelation Function',4,TRUE)
a<-table.row.end(a)
a<-table.row.start(a)
a<-table.element(a,'Time lag k',header=TRUE)
a<-table.element(a,hyperlink('basics.htm','ACF(k)','click here for more information about the Autocorrelation Function'),header=TRUE)
a<-table.element(a,'T-STAT',header=TRUE)
a<-table.element(a,'P-value',header=TRUE)
a<-table.row.end(a)
for (i in 2:(par1+1)) {
a<-table.row.start(a)
a<-table.element(a,i-1,header=TRUE)
a<-table.element(a,round(myacf[i],6))
mytstat <- myacf[i]*sqrtn
a<-table.element(a,round(mytstat,4))
a<-table.element(a,round(1-pt(abs(mytstat),lengthx),6))
a<-table.row.end(a)
}
a<-table.end(a)
table.save(a,file='mytable.tab')
a<-table.start()
a<-table.row.start(a)
a<-table.element(a,'Partial Autocorrelation Function',4,TRUE)
a<-table.row.end(a)
a<-table.row.start(a)
a<-table.element(a,'Time lag k',header=TRUE)
a<-table.element(a,hyperlink('basics.htm','PACF(k)','click here for more information about the Partial Autocorrelation Function'),header=TRUE)
a<-table.element(a,'T-STAT',header=TRUE)
a<-table.element(a,'P-value',header=TRUE)
a<-table.row.end(a)
for (i in 1:par1) {
a<-table.row.start(a)
a<-table.element(a,i,header=TRUE)
a<-table.element(a,round(mypacf[i],6))
mytstat <- mypacf[i]*sqrtn
a<-table.element(a,round(mytstat,4))
a<-table.element(a,round(1-pt(abs(mytstat),lengthx),6))
a<-table.row.end(a)
}
a<-table.end(a)
table.save(a,file='mytable1.tab')