Free Statistics

of Irreproducible Research!

Author's title

Author*Unverified author*
R Software Modulerwasp_autocorrelation.wasp
Title produced by software(Partial) Autocorrelation Function
Date of computationMon, 16 Aug 2010 09:18:19 +0000
Cite this page as followsStatistical Computations at FreeStatistics.org, Office for Research Development and Education, URL https://freestatistics.org/blog/index.php?v=date/2010/Aug/16/t1281950389ajsntv8dihojmzg.htm/, Retrieved Thu, 16 May 2024 23:06:12 +0000
Statistical Computations at FreeStatistics.org, Office for Research Development and Education, URL https://freestatistics.org/blog/index.php?pk=78945, Retrieved Thu, 16 May 2024 23:06:12 +0000
QR Codes:

Original text written by user:
IsPrivate?No (this computation is public)
User-defined keywords
Estimated Impact139
Family? (F = Feedback message, R = changed R code, M = changed R Module, P = changed Parameters, D = changed Data)
-     [Histogram] [Bezoekers per maand] [2010-08-16 07:07:56] [3d41945eca20332ad7c135bac91a27a3]
- RMP     [(Partial) Autocorrelation Function] [Aantal bezoekers] [2010-08-16 09:18:19] [5e78ed906b09bab42b8ec3dd93b6358a] [Current]
Feedback Forum

Post a new message
Dataseries X:
556
555
554
552
572
571
556
546
547
547
548
550
555
549
555
550
566
573
543
535
542
541
535
536
548
546
548
548
561
563
527
527
541
534
522
527
539
533
532
519
538
542
503
502
522
511
492
500
509
511
505
493
518
518
474
471
483
461
439
446
461
449
441
424
447
448
404
403
411
386
359
370
385
369
368
352
378
383
334
323
330
303
275
284
301
281
284
272
297
300
240
236
247
218
192
201
223
197
195
175
197
204
142
142
151
127
100
114
139
112
123
108
132
140
76
71
81
57
38
46


Summary of computational transaction
Raw Inputview raw input (R code)
Raw Outputview raw output of R engine
Computing time1 seconds
R Server'Gwilym Jenkins' @ 72.249.127.135

\begin{tabular}{lllllllll}
\hline
Summary of computational transaction \tabularnewline
Raw Input & view raw input (R code)  \tabularnewline
Raw Output & view raw output of R engine  \tabularnewline
Computing time & 1 seconds \tabularnewline
R Server & 'Gwilym Jenkins' @ 72.249.127.135 \tabularnewline
\hline
\end{tabular}
%Source: https://freestatistics.org/blog/index.php?pk=78945&T=0

[TABLE]
[ROW][C]Summary of computational transaction[/C][/ROW]
[ROW][C]Raw Input[/C][C]view raw input (R code) [/C][/ROW]
[ROW][C]Raw Output[/C][C]view raw output of R engine [/C][/ROW]
[ROW][C]Computing time[/C][C]1 seconds[/C][/ROW]
[ROW][C]R Server[/C][C]'Gwilym Jenkins' @ 72.249.127.135[/C][/ROW]
[/TABLE]
Source: https://freestatistics.org/blog/index.php?pk=78945&T=0

Globally Unique Identifier (entire table): ba.freestatistics.org/blog/index.php?pk=78945&T=0

As an alternative you can also use a QR Code:  

The GUIDs for individual cells are displayed in the table below:

Summary of computational transaction
Raw Inputview raw input (R code)
Raw Outputview raw output of R engine
Computing time1 seconds
R Server'Gwilym Jenkins' @ 72.249.127.135


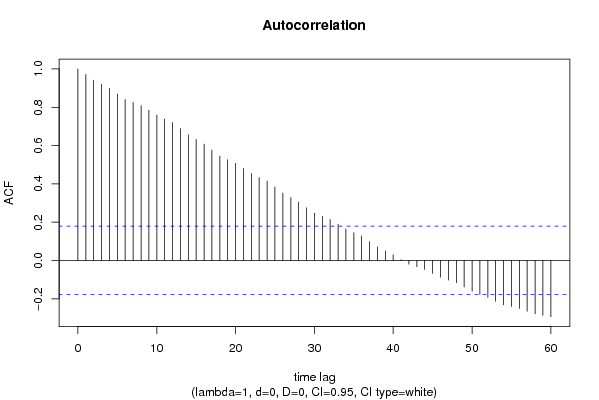
Autocorrelation Function
Time lag kACF(k)T-STATP-value
10.97050810.63140
20.94107110.30890
30.91991910.07720
40.8979569.83660
50.8689739.51910
60.8406639.2090
70.8246369.03340
80.8082468.85390
90.7843968.59260
100.75928.31660
110.7384878.08970
120.7210027.89820
130.6887967.54540
140.6562387.18870
150.6321646.9250
160.6075016.65480
170.5762996.3130
180.5452635.97310
190.5264515.7670
200.5070665.55460
210.4805715.26440
220.4539154.97241e-06
230.4326924.73993e-06
240.4143964.53957e-06
250.3830884.19652.6e-05
260.3516763.85249.5e-05
270.3282553.59580.000235
280.3046863.33770.000563
290.2751843.01450.001571
300.2469422.70510.003911
310.2304832.52480.00644
320.2133592.33720.010542
330.1891742.07230.02019
340.1649391.80680.036648
350.145151.590.057228
360.1273221.39470.082834
370.0987851.08210.140681
380.070360.77080.221184
390.0495210.54250.294248
400.0292840.32080.374462
410.0037980.04160.483441
42-0.019535-0.2140.415459
43-0.032629-0.35740.360697
44-0.046784-0.51250.304624
45-0.0676-0.74050.230214
46-0.087306-0.95640.170398
47-0.102403-1.12180.132099
48-0.116012-1.27080.103121
49-0.138289-1.51490.066216
50-0.16115-1.76530.040028
51-0.177138-1.94040.027336
52-0.19235-2.10710.018596
53-0.212547-2.32830.010784
54-0.231249-2.53320.006296
55-0.240558-2.63520.00476
56-0.250514-2.74420.003498
57-0.265664-2.91020.002153
58-0.278459-3.05040.001407
59-0.286435-3.13770.001071
60-0.293345-3.21340.000842

\begin{tabular}{lllllllll}
\hline
Autocorrelation Function \tabularnewline
Time lag k & ACF(k) & T-STAT & P-value \tabularnewline
1 & 0.970508 & 10.6314 & 0 \tabularnewline
2 & 0.941071 & 10.3089 & 0 \tabularnewline
3 & 0.919919 & 10.0772 & 0 \tabularnewline
4 & 0.897956 & 9.8366 & 0 \tabularnewline
5 & 0.868973 & 9.5191 & 0 \tabularnewline
6 & 0.840663 & 9.209 & 0 \tabularnewline
7 & 0.824636 & 9.0334 & 0 \tabularnewline
8 & 0.808246 & 8.8539 & 0 \tabularnewline
9 & 0.784396 & 8.5926 & 0 \tabularnewline
10 & 0.7592 & 8.3166 & 0 \tabularnewline
11 & 0.738487 & 8.0897 & 0 \tabularnewline
12 & 0.721002 & 7.8982 & 0 \tabularnewline
13 & 0.688796 & 7.5454 & 0 \tabularnewline
14 & 0.656238 & 7.1887 & 0 \tabularnewline
15 & 0.632164 & 6.925 & 0 \tabularnewline
16 & 0.607501 & 6.6548 & 0 \tabularnewline
17 & 0.576299 & 6.313 & 0 \tabularnewline
18 & 0.545263 & 5.9731 & 0 \tabularnewline
19 & 0.526451 & 5.767 & 0 \tabularnewline
20 & 0.507066 & 5.5546 & 0 \tabularnewline
21 & 0.480571 & 5.2644 & 0 \tabularnewline
22 & 0.453915 & 4.9724 & 1e-06 \tabularnewline
23 & 0.432692 & 4.7399 & 3e-06 \tabularnewline
24 & 0.414396 & 4.5395 & 7e-06 \tabularnewline
25 & 0.383088 & 4.1965 & 2.6e-05 \tabularnewline
26 & 0.351676 & 3.8524 & 9.5e-05 \tabularnewline
27 & 0.328255 & 3.5958 & 0.000235 \tabularnewline
28 & 0.304686 & 3.3377 & 0.000563 \tabularnewline
29 & 0.275184 & 3.0145 & 0.001571 \tabularnewline
30 & 0.246942 & 2.7051 & 0.003911 \tabularnewline
31 & 0.230483 & 2.5248 & 0.00644 \tabularnewline
32 & 0.213359 & 2.3372 & 0.010542 \tabularnewline
33 & 0.189174 & 2.0723 & 0.02019 \tabularnewline
34 & 0.164939 & 1.8068 & 0.036648 \tabularnewline
35 & 0.14515 & 1.59 & 0.057228 \tabularnewline
36 & 0.127322 & 1.3947 & 0.082834 \tabularnewline
37 & 0.098785 & 1.0821 & 0.140681 \tabularnewline
38 & 0.07036 & 0.7708 & 0.221184 \tabularnewline
39 & 0.049521 & 0.5425 & 0.294248 \tabularnewline
40 & 0.029284 & 0.3208 & 0.374462 \tabularnewline
41 & 0.003798 & 0.0416 & 0.483441 \tabularnewline
42 & -0.019535 & -0.214 & 0.415459 \tabularnewline
43 & -0.032629 & -0.3574 & 0.360697 \tabularnewline
44 & -0.046784 & -0.5125 & 0.304624 \tabularnewline
45 & -0.0676 & -0.7405 & 0.230214 \tabularnewline
46 & -0.087306 & -0.9564 & 0.170398 \tabularnewline
47 & -0.102403 & -1.1218 & 0.132099 \tabularnewline
48 & -0.116012 & -1.2708 & 0.103121 \tabularnewline
49 & -0.138289 & -1.5149 & 0.066216 \tabularnewline
50 & -0.16115 & -1.7653 & 0.040028 \tabularnewline
51 & -0.177138 & -1.9404 & 0.027336 \tabularnewline
52 & -0.19235 & -2.1071 & 0.018596 \tabularnewline
53 & -0.212547 & -2.3283 & 0.010784 \tabularnewline
54 & -0.231249 & -2.5332 & 0.006296 \tabularnewline
55 & -0.240558 & -2.6352 & 0.00476 \tabularnewline
56 & -0.250514 & -2.7442 & 0.003498 \tabularnewline
57 & -0.265664 & -2.9102 & 0.002153 \tabularnewline
58 & -0.278459 & -3.0504 & 0.001407 \tabularnewline
59 & -0.286435 & -3.1377 & 0.001071 \tabularnewline
60 & -0.293345 & -3.2134 & 0.000842 \tabularnewline
\hline
\end{tabular}
%Source: https://freestatistics.org/blog/index.php?pk=78945&T=1

[TABLE]
[ROW][C]Autocorrelation Function[/C][/ROW]
[ROW][C]Time lag k[/C][C]ACF(k)[/C][C]T-STAT[/C][C]P-value[/C][/ROW]
[ROW][C]1[/C][C]0.970508[/C][C]10.6314[/C][C]0[/C][/ROW]
[ROW][C]2[/C][C]0.941071[/C][C]10.3089[/C][C]0[/C][/ROW]
[ROW][C]3[/C][C]0.919919[/C][C]10.0772[/C][C]0[/C][/ROW]
[ROW][C]4[/C][C]0.897956[/C][C]9.8366[/C][C]0[/C][/ROW]
[ROW][C]5[/C][C]0.868973[/C][C]9.5191[/C][C]0[/C][/ROW]
[ROW][C]6[/C][C]0.840663[/C][C]9.209[/C][C]0[/C][/ROW]
[ROW][C]7[/C][C]0.824636[/C][C]9.0334[/C][C]0[/C][/ROW]
[ROW][C]8[/C][C]0.808246[/C][C]8.8539[/C][C]0[/C][/ROW]
[ROW][C]9[/C][C]0.784396[/C][C]8.5926[/C][C]0[/C][/ROW]
[ROW][C]10[/C][C]0.7592[/C][C]8.3166[/C][C]0[/C][/ROW]
[ROW][C]11[/C][C]0.738487[/C][C]8.0897[/C][C]0[/C][/ROW]
[ROW][C]12[/C][C]0.721002[/C][C]7.8982[/C][C]0[/C][/ROW]
[ROW][C]13[/C][C]0.688796[/C][C]7.5454[/C][C]0[/C][/ROW]
[ROW][C]14[/C][C]0.656238[/C][C]7.1887[/C][C]0[/C][/ROW]
[ROW][C]15[/C][C]0.632164[/C][C]6.925[/C][C]0[/C][/ROW]
[ROW][C]16[/C][C]0.607501[/C][C]6.6548[/C][C]0[/C][/ROW]
[ROW][C]17[/C][C]0.576299[/C][C]6.313[/C][C]0[/C][/ROW]
[ROW][C]18[/C][C]0.545263[/C][C]5.9731[/C][C]0[/C][/ROW]
[ROW][C]19[/C][C]0.526451[/C][C]5.767[/C][C]0[/C][/ROW]
[ROW][C]20[/C][C]0.507066[/C][C]5.5546[/C][C]0[/C][/ROW]
[ROW][C]21[/C][C]0.480571[/C][C]5.2644[/C][C]0[/C][/ROW]
[ROW][C]22[/C][C]0.453915[/C][C]4.9724[/C][C]1e-06[/C][/ROW]
[ROW][C]23[/C][C]0.432692[/C][C]4.7399[/C][C]3e-06[/C][/ROW]
[ROW][C]24[/C][C]0.414396[/C][C]4.5395[/C][C]7e-06[/C][/ROW]
[ROW][C]25[/C][C]0.383088[/C][C]4.1965[/C][C]2.6e-05[/C][/ROW]
[ROW][C]26[/C][C]0.351676[/C][C]3.8524[/C][C]9.5e-05[/C][/ROW]
[ROW][C]27[/C][C]0.328255[/C][C]3.5958[/C][C]0.000235[/C][/ROW]
[ROW][C]28[/C][C]0.304686[/C][C]3.3377[/C][C]0.000563[/C][/ROW]
[ROW][C]29[/C][C]0.275184[/C][C]3.0145[/C][C]0.001571[/C][/ROW]
[ROW][C]30[/C][C]0.246942[/C][C]2.7051[/C][C]0.003911[/C][/ROW]
[ROW][C]31[/C][C]0.230483[/C][C]2.5248[/C][C]0.00644[/C][/ROW]
[ROW][C]32[/C][C]0.213359[/C][C]2.3372[/C][C]0.010542[/C][/ROW]
[ROW][C]33[/C][C]0.189174[/C][C]2.0723[/C][C]0.02019[/C][/ROW]
[ROW][C]34[/C][C]0.164939[/C][C]1.8068[/C][C]0.036648[/C][/ROW]
[ROW][C]35[/C][C]0.14515[/C][C]1.59[/C][C]0.057228[/C][/ROW]
[ROW][C]36[/C][C]0.127322[/C][C]1.3947[/C][C]0.082834[/C][/ROW]
[ROW][C]37[/C][C]0.098785[/C][C]1.0821[/C][C]0.140681[/C][/ROW]
[ROW][C]38[/C][C]0.07036[/C][C]0.7708[/C][C]0.221184[/C][/ROW]
[ROW][C]39[/C][C]0.049521[/C][C]0.5425[/C][C]0.294248[/C][/ROW]
[ROW][C]40[/C][C]0.029284[/C][C]0.3208[/C][C]0.374462[/C][/ROW]
[ROW][C]41[/C][C]0.003798[/C][C]0.0416[/C][C]0.483441[/C][/ROW]
[ROW][C]42[/C][C]-0.019535[/C][C]-0.214[/C][C]0.415459[/C][/ROW]
[ROW][C]43[/C][C]-0.032629[/C][C]-0.3574[/C][C]0.360697[/C][/ROW]
[ROW][C]44[/C][C]-0.046784[/C][C]-0.5125[/C][C]0.304624[/C][/ROW]
[ROW][C]45[/C][C]-0.0676[/C][C]-0.7405[/C][C]0.230214[/C][/ROW]
[ROW][C]46[/C][C]-0.087306[/C][C]-0.9564[/C][C]0.170398[/C][/ROW]
[ROW][C]47[/C][C]-0.102403[/C][C]-1.1218[/C][C]0.132099[/C][/ROW]
[ROW][C]48[/C][C]-0.116012[/C][C]-1.2708[/C][C]0.103121[/C][/ROW]
[ROW][C]49[/C][C]-0.138289[/C][C]-1.5149[/C][C]0.066216[/C][/ROW]
[ROW][C]50[/C][C]-0.16115[/C][C]-1.7653[/C][C]0.040028[/C][/ROW]
[ROW][C]51[/C][C]-0.177138[/C][C]-1.9404[/C][C]0.027336[/C][/ROW]
[ROW][C]52[/C][C]-0.19235[/C][C]-2.1071[/C][C]0.018596[/C][/ROW]
[ROW][C]53[/C][C]-0.212547[/C][C]-2.3283[/C][C]0.010784[/C][/ROW]
[ROW][C]54[/C][C]-0.231249[/C][C]-2.5332[/C][C]0.006296[/C][/ROW]
[ROW][C]55[/C][C]-0.240558[/C][C]-2.6352[/C][C]0.00476[/C][/ROW]
[ROW][C]56[/C][C]-0.250514[/C][C]-2.7442[/C][C]0.003498[/C][/ROW]
[ROW][C]57[/C][C]-0.265664[/C][C]-2.9102[/C][C]0.002153[/C][/ROW]
[ROW][C]58[/C][C]-0.278459[/C][C]-3.0504[/C][C]0.001407[/C][/ROW]
[ROW][C]59[/C][C]-0.286435[/C][C]-3.1377[/C][C]0.001071[/C][/ROW]
[ROW][C]60[/C][C]-0.293345[/C][C]-3.2134[/C][C]0.000842[/C][/ROW]
[/TABLE]
Source: https://freestatistics.org/blog/index.php?pk=78945&T=1

Globally Unique Identifier (entire table): ba.freestatistics.org/blog/index.php?pk=78945&T=1

As an alternative you can also use a QR Code:  

The GUIDs for individual cells are displayed in the table below:

Autocorrelation Function
Time lag kACF(k)T-STATP-value
10.97050810.63140
20.94107110.30890
30.91991910.07720
40.8979569.83660
50.8689739.51910
60.8406639.2090
70.8246369.03340
80.8082468.85390
90.7843968.59260
100.75928.31660
110.7384878.08970
120.7210027.89820
130.6887967.54540
140.6562387.18870
150.6321646.9250
160.6075016.65480
170.5762996.3130
180.5452635.97310
190.5264515.7670
200.5070665.55460
210.4805715.26440
220.4539154.97241e-06
230.4326924.73993e-06
240.4143964.53957e-06
250.3830884.19652.6e-05
260.3516763.85249.5e-05
270.3282553.59580.000235
280.3046863.33770.000563
290.2751843.01450.001571
300.2469422.70510.003911
310.2304832.52480.00644
320.2133592.33720.010542
330.1891742.07230.02019
340.1649391.80680.036648
350.145151.590.057228
360.1273221.39470.082834
370.0987851.08210.140681
380.070360.77080.221184
390.0495210.54250.294248
400.0292840.32080.374462
410.0037980.04160.483441
42-0.019535-0.2140.415459
43-0.032629-0.35740.360697
44-0.046784-0.51250.304624
45-0.0676-0.74050.230214
46-0.087306-0.95640.170398
47-0.102403-1.12180.132099
48-0.116012-1.27080.103121
49-0.138289-1.51490.066216
50-0.16115-1.76530.040028
51-0.177138-1.94040.027336
52-0.19235-2.10710.018596
53-0.212547-2.32830.010784
54-0.231249-2.53320.006296
55-0.240558-2.63520.00476
56-0.250514-2.74420.003498
57-0.265664-2.91020.002153
58-0.278459-3.05040.001407
59-0.286435-3.13770.001071
60-0.293345-3.21340.000842


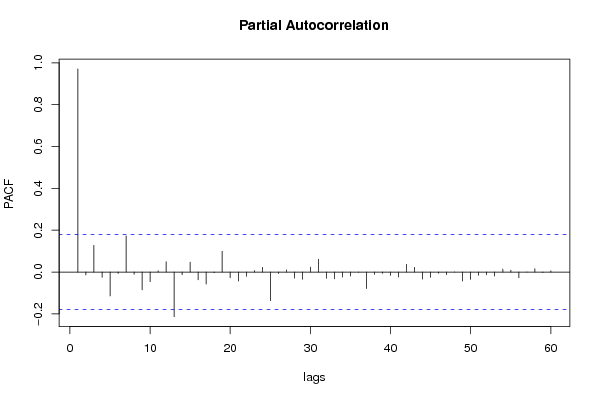
Partial Autocorrelation Function
Time lag kPACF(k)T-STATP-value
10.97050810.63140
2-0.013999-0.15330.439191
30.1274041.39560.082699
4-0.025451-0.27880.39044
5-0.114545-1.25480.105998
6-0.007022-0.07690.469408
70.172551.89020.030572
8-0.010985-0.12030.452209
9-0.085116-0.93240.176502
10-0.046288-0.50710.306523
110.0059570.06530.474037
120.049240.53940.295306
13-0.213238-2.33590.010578
14-0.012962-0.1420.44366
150.0472760.51790.302747
16-0.037072-0.40610.342696
17-0.057711-0.63220.264231
18-0.002939-0.03220.487187
190.0993261.08810.139375
20-0.027706-0.30350.381014
21-0.043166-0.47290.318584
22-0.020604-0.22570.410906
230.007330.08030.468067
240.0225730.24730.402557
25-0.137017-1.5010.067997
26-0.007112-0.07790.469014
270.0098520.10790.45712
28-0.02867-0.31410.377009
29-0.034898-0.38230.351463
300.0234520.25690.398846
310.061230.67070.251836
32-0.030137-0.33010.370935
33-0.03266-0.35780.360569
34-0.023869-0.26150.397086
35-0.019316-0.21160.41639
36-0.001012-0.01110.495587
37-0.078787-0.86310.194912
38-0.010762-0.11790.453177
39-0.006185-0.06780.473045
40-0.016421-0.17990.428773
41-0.0233-0.25520.399488
420.0370070.40540.342955
430.0223660.2450.403433
44-0.033331-0.36510.357832
45-0.02486-0.27230.392917
46-0.005576-0.06110.475696
47-0.012833-0.14060.444219
480.0002940.00320.498719
49-0.043001-0.47110.319228
50-0.035416-0.3880.349364
51-0.01547-0.16950.432858
52-0.013368-0.14640.441912
53-0.01936-0.21210.416203
540.0139310.15260.439482
550.0089940.09850.460838
56-0.026752-0.29310.384994
570.0002350.00260.498975
580.0160230.17550.430482
59-0.002711-0.02970.488178
600.0056170.06150.475518

\begin{tabular}{lllllllll}
\hline
Partial Autocorrelation Function \tabularnewline
Time lag k & PACF(k) & T-STAT & P-value \tabularnewline
1 & 0.970508 & 10.6314 & 0 \tabularnewline
2 & -0.013999 & -0.1533 & 0.439191 \tabularnewline
3 & 0.127404 & 1.3956 & 0.082699 \tabularnewline
4 & -0.025451 & -0.2788 & 0.39044 \tabularnewline
5 & -0.114545 & -1.2548 & 0.105998 \tabularnewline
6 & -0.007022 & -0.0769 & 0.469408 \tabularnewline
7 & 0.17255 & 1.8902 & 0.030572 \tabularnewline
8 & -0.010985 & -0.1203 & 0.452209 \tabularnewline
9 & -0.085116 & -0.9324 & 0.176502 \tabularnewline
10 & -0.046288 & -0.5071 & 0.306523 \tabularnewline
11 & 0.005957 & 0.0653 & 0.474037 \tabularnewline
12 & 0.04924 & 0.5394 & 0.295306 \tabularnewline
13 & -0.213238 & -2.3359 & 0.010578 \tabularnewline
14 & -0.012962 & -0.142 & 0.44366 \tabularnewline
15 & 0.047276 & 0.5179 & 0.302747 \tabularnewline
16 & -0.037072 & -0.4061 & 0.342696 \tabularnewline
17 & -0.057711 & -0.6322 & 0.264231 \tabularnewline
18 & -0.002939 & -0.0322 & 0.487187 \tabularnewline
19 & 0.099326 & 1.0881 & 0.139375 \tabularnewline
20 & -0.027706 & -0.3035 & 0.381014 \tabularnewline
21 & -0.043166 & -0.4729 & 0.318584 \tabularnewline
22 & -0.020604 & -0.2257 & 0.410906 \tabularnewline
23 & 0.00733 & 0.0803 & 0.468067 \tabularnewline
24 & 0.022573 & 0.2473 & 0.402557 \tabularnewline
25 & -0.137017 & -1.501 & 0.067997 \tabularnewline
26 & -0.007112 & -0.0779 & 0.469014 \tabularnewline
27 & 0.009852 & 0.1079 & 0.45712 \tabularnewline
28 & -0.02867 & -0.3141 & 0.377009 \tabularnewline
29 & -0.034898 & -0.3823 & 0.351463 \tabularnewline
30 & 0.023452 & 0.2569 & 0.398846 \tabularnewline
31 & 0.06123 & 0.6707 & 0.251836 \tabularnewline
32 & -0.030137 & -0.3301 & 0.370935 \tabularnewline
33 & -0.03266 & -0.3578 & 0.360569 \tabularnewline
34 & -0.023869 & -0.2615 & 0.397086 \tabularnewline
35 & -0.019316 & -0.2116 & 0.41639 \tabularnewline
36 & -0.001012 & -0.0111 & 0.495587 \tabularnewline
37 & -0.078787 & -0.8631 & 0.194912 \tabularnewline
38 & -0.010762 & -0.1179 & 0.453177 \tabularnewline
39 & -0.006185 & -0.0678 & 0.473045 \tabularnewline
40 & -0.016421 & -0.1799 & 0.428773 \tabularnewline
41 & -0.0233 & -0.2552 & 0.399488 \tabularnewline
42 & 0.037007 & 0.4054 & 0.342955 \tabularnewline
43 & 0.022366 & 0.245 & 0.403433 \tabularnewline
44 & -0.033331 & -0.3651 & 0.357832 \tabularnewline
45 & -0.02486 & -0.2723 & 0.392917 \tabularnewline
46 & -0.005576 & -0.0611 & 0.475696 \tabularnewline
47 & -0.012833 & -0.1406 & 0.444219 \tabularnewline
48 & 0.000294 & 0.0032 & 0.498719 \tabularnewline
49 & -0.043001 & -0.4711 & 0.319228 \tabularnewline
50 & -0.035416 & -0.388 & 0.349364 \tabularnewline
51 & -0.01547 & -0.1695 & 0.432858 \tabularnewline
52 & -0.013368 & -0.1464 & 0.441912 \tabularnewline
53 & -0.01936 & -0.2121 & 0.416203 \tabularnewline
54 & 0.013931 & 0.1526 & 0.439482 \tabularnewline
55 & 0.008994 & 0.0985 & 0.460838 \tabularnewline
56 & -0.026752 & -0.2931 & 0.384994 \tabularnewline
57 & 0.000235 & 0.0026 & 0.498975 \tabularnewline
58 & 0.016023 & 0.1755 & 0.430482 \tabularnewline
59 & -0.002711 & -0.0297 & 0.488178 \tabularnewline
60 & 0.005617 & 0.0615 & 0.475518 \tabularnewline
\hline
\end{tabular}
%Source: https://freestatistics.org/blog/index.php?pk=78945&T=2

[TABLE]
[ROW][C]Partial Autocorrelation Function[/C][/ROW]
[ROW][C]Time lag k[/C][C]PACF(k)[/C][C]T-STAT[/C][C]P-value[/C][/ROW]
[ROW][C]1[/C][C]0.970508[/C][C]10.6314[/C][C]0[/C][/ROW]
[ROW][C]2[/C][C]-0.013999[/C][C]-0.1533[/C][C]0.439191[/C][/ROW]
[ROW][C]3[/C][C]0.127404[/C][C]1.3956[/C][C]0.082699[/C][/ROW]
[ROW][C]4[/C][C]-0.025451[/C][C]-0.2788[/C][C]0.39044[/C][/ROW]
[ROW][C]5[/C][C]-0.114545[/C][C]-1.2548[/C][C]0.105998[/C][/ROW]
[ROW][C]6[/C][C]-0.007022[/C][C]-0.0769[/C][C]0.469408[/C][/ROW]
[ROW][C]7[/C][C]0.17255[/C][C]1.8902[/C][C]0.030572[/C][/ROW]
[ROW][C]8[/C][C]-0.010985[/C][C]-0.1203[/C][C]0.452209[/C][/ROW]
[ROW][C]9[/C][C]-0.085116[/C][C]-0.9324[/C][C]0.176502[/C][/ROW]
[ROW][C]10[/C][C]-0.046288[/C][C]-0.5071[/C][C]0.306523[/C][/ROW]
[ROW][C]11[/C][C]0.005957[/C][C]0.0653[/C][C]0.474037[/C][/ROW]
[ROW][C]12[/C][C]0.04924[/C][C]0.5394[/C][C]0.295306[/C][/ROW]
[ROW][C]13[/C][C]-0.213238[/C][C]-2.3359[/C][C]0.010578[/C][/ROW]
[ROW][C]14[/C][C]-0.012962[/C][C]-0.142[/C][C]0.44366[/C][/ROW]
[ROW][C]15[/C][C]0.047276[/C][C]0.5179[/C][C]0.302747[/C][/ROW]
[ROW][C]16[/C][C]-0.037072[/C][C]-0.4061[/C][C]0.342696[/C][/ROW]
[ROW][C]17[/C][C]-0.057711[/C][C]-0.6322[/C][C]0.264231[/C][/ROW]
[ROW][C]18[/C][C]-0.002939[/C][C]-0.0322[/C][C]0.487187[/C][/ROW]
[ROW][C]19[/C][C]0.099326[/C][C]1.0881[/C][C]0.139375[/C][/ROW]
[ROW][C]20[/C][C]-0.027706[/C][C]-0.3035[/C][C]0.381014[/C][/ROW]
[ROW][C]21[/C][C]-0.043166[/C][C]-0.4729[/C][C]0.318584[/C][/ROW]
[ROW][C]22[/C][C]-0.020604[/C][C]-0.2257[/C][C]0.410906[/C][/ROW]
[ROW][C]23[/C][C]0.00733[/C][C]0.0803[/C][C]0.468067[/C][/ROW]
[ROW][C]24[/C][C]0.022573[/C][C]0.2473[/C][C]0.402557[/C][/ROW]
[ROW][C]25[/C][C]-0.137017[/C][C]-1.501[/C][C]0.067997[/C][/ROW]
[ROW][C]26[/C][C]-0.007112[/C][C]-0.0779[/C][C]0.469014[/C][/ROW]
[ROW][C]27[/C][C]0.009852[/C][C]0.1079[/C][C]0.45712[/C][/ROW]
[ROW][C]28[/C][C]-0.02867[/C][C]-0.3141[/C][C]0.377009[/C][/ROW]
[ROW][C]29[/C][C]-0.034898[/C][C]-0.3823[/C][C]0.351463[/C][/ROW]
[ROW][C]30[/C][C]0.023452[/C][C]0.2569[/C][C]0.398846[/C][/ROW]
[ROW][C]31[/C][C]0.06123[/C][C]0.6707[/C][C]0.251836[/C][/ROW]
[ROW][C]32[/C][C]-0.030137[/C][C]-0.3301[/C][C]0.370935[/C][/ROW]
[ROW][C]33[/C][C]-0.03266[/C][C]-0.3578[/C][C]0.360569[/C][/ROW]
[ROW][C]34[/C][C]-0.023869[/C][C]-0.2615[/C][C]0.397086[/C][/ROW]
[ROW][C]35[/C][C]-0.019316[/C][C]-0.2116[/C][C]0.41639[/C][/ROW]
[ROW][C]36[/C][C]-0.001012[/C][C]-0.0111[/C][C]0.495587[/C][/ROW]
[ROW][C]37[/C][C]-0.078787[/C][C]-0.8631[/C][C]0.194912[/C][/ROW]
[ROW][C]38[/C][C]-0.010762[/C][C]-0.1179[/C][C]0.453177[/C][/ROW]
[ROW][C]39[/C][C]-0.006185[/C][C]-0.0678[/C][C]0.473045[/C][/ROW]
[ROW][C]40[/C][C]-0.016421[/C][C]-0.1799[/C][C]0.428773[/C][/ROW]
[ROW][C]41[/C][C]-0.0233[/C][C]-0.2552[/C][C]0.399488[/C][/ROW]
[ROW][C]42[/C][C]0.037007[/C][C]0.4054[/C][C]0.342955[/C][/ROW]
[ROW][C]43[/C][C]0.022366[/C][C]0.245[/C][C]0.403433[/C][/ROW]
[ROW][C]44[/C][C]-0.033331[/C][C]-0.3651[/C][C]0.357832[/C][/ROW]
[ROW][C]45[/C][C]-0.02486[/C][C]-0.2723[/C][C]0.392917[/C][/ROW]
[ROW][C]46[/C][C]-0.005576[/C][C]-0.0611[/C][C]0.475696[/C][/ROW]
[ROW][C]47[/C][C]-0.012833[/C][C]-0.1406[/C][C]0.444219[/C][/ROW]
[ROW][C]48[/C][C]0.000294[/C][C]0.0032[/C][C]0.498719[/C][/ROW]
[ROW][C]49[/C][C]-0.043001[/C][C]-0.4711[/C][C]0.319228[/C][/ROW]
[ROW][C]50[/C][C]-0.035416[/C][C]-0.388[/C][C]0.349364[/C][/ROW]
[ROW][C]51[/C][C]-0.01547[/C][C]-0.1695[/C][C]0.432858[/C][/ROW]
[ROW][C]52[/C][C]-0.013368[/C][C]-0.1464[/C][C]0.441912[/C][/ROW]
[ROW][C]53[/C][C]-0.01936[/C][C]-0.2121[/C][C]0.416203[/C][/ROW]
[ROW][C]54[/C][C]0.013931[/C][C]0.1526[/C][C]0.439482[/C][/ROW]
[ROW][C]55[/C][C]0.008994[/C][C]0.0985[/C][C]0.460838[/C][/ROW]
[ROW][C]56[/C][C]-0.026752[/C][C]-0.2931[/C][C]0.384994[/C][/ROW]
[ROW][C]57[/C][C]0.000235[/C][C]0.0026[/C][C]0.498975[/C][/ROW]
[ROW][C]58[/C][C]0.016023[/C][C]0.1755[/C][C]0.430482[/C][/ROW]
[ROW][C]59[/C][C]-0.002711[/C][C]-0.0297[/C][C]0.488178[/C][/ROW]
[ROW][C]60[/C][C]0.005617[/C][C]0.0615[/C][C]0.475518[/C][/ROW]
[/TABLE]
Source: https://freestatistics.org/blog/index.php?pk=78945&T=2

Globally Unique Identifier (entire table): ba.freestatistics.org/blog/index.php?pk=78945&T=2

As an alternative you can also use a QR Code:  

The GUIDs for individual cells are displayed in the table below:

Partial Autocorrelation Function
Time lag kPACF(k)T-STATP-value
10.97050810.63140
2-0.013999-0.15330.439191
30.1274041.39560.082699
4-0.025451-0.27880.39044
5-0.114545-1.25480.105998
6-0.007022-0.07690.469408
70.172551.89020.030572
8-0.010985-0.12030.452209
9-0.085116-0.93240.176502
10-0.046288-0.50710.306523
110.0059570.06530.474037
120.049240.53940.295306
13-0.213238-2.33590.010578
14-0.012962-0.1420.44366
150.0472760.51790.302747
16-0.037072-0.40610.342696
17-0.057711-0.63220.264231
18-0.002939-0.03220.487187
190.0993261.08810.139375
20-0.027706-0.30350.381014
21-0.043166-0.47290.318584
22-0.020604-0.22570.410906
230.007330.08030.468067
240.0225730.24730.402557
25-0.137017-1.5010.067997
26-0.007112-0.07790.469014
270.0098520.10790.45712
28-0.02867-0.31410.377009
29-0.034898-0.38230.351463
300.0234520.25690.398846
310.061230.67070.251836
32-0.030137-0.33010.370935
33-0.03266-0.35780.360569
34-0.023869-0.26150.397086
35-0.019316-0.21160.41639
36-0.001012-0.01110.495587
37-0.078787-0.86310.194912
38-0.010762-0.11790.453177
39-0.006185-0.06780.473045
40-0.016421-0.17990.428773
41-0.0233-0.25520.399488
420.0370070.40540.342955
430.0223660.2450.403433
44-0.033331-0.36510.357832
45-0.02486-0.27230.392917
46-0.005576-0.06110.475696
47-0.012833-0.14060.444219
480.0002940.00320.498719
49-0.043001-0.47110.319228
50-0.035416-0.3880.349364
51-0.01547-0.16950.432858
52-0.013368-0.14640.441912
53-0.01936-0.21210.416203
540.0139310.15260.439482
550.0089940.09850.460838
56-0.026752-0.29310.384994
570.0002350.00260.498975
580.0160230.17550.430482
59-0.002711-0.02970.488178
600.0056170.06150.475518


Parameters (Session):
Parameters (R input):
par1 = 60 ; par2 = 1 ; par3 = 0 ; par4 = 0 ; par5 = 12 ; par6 = White Noise ; par7 = 0.95 ;
R code (references can be found in the software module):
if (par1 == 'Default') {
par1 = 10*log10(length(x))
} else {
par1 <- as.numeric(par1)
}
par2 <- as.numeric(par2)
par3 <- as.numeric(par3)
par4 <- as.numeric(par4)
par5 <- as.numeric(par5)
if (par6 == 'White Noise') par6 <- 'white' else par6 <- 'ma'
par7 <- as.numeric(par7)
if (par2 == 0) {
x <- log(x)
} else {
x <- (x ^ par2 - 1) / par2
}
if (par3 > 0) x <- diff(x,lag=1,difference=par3)
if (par4 > 0) x <- diff(x,lag=par5,difference=par4)
bitmap(file='pic1.png')
racf <- acf(x, par1, main='Autocorrelation', xlab='time lag', ylab='ACF', ci.type=par6, ci=par7, sub=paste('(lambda=',par2,', d=',par3,', D=',par4,', CI=', par7, ', CI type=',par6,')',sep=''))
dev.off()
bitmap(file='pic2.png')
rpacf <- pacf(x,par1,main='Partial Autocorrelation',xlab='lags',ylab='PACF')
dev.off()
(myacf <- c(racf$acf))
(mypacf <- c(rpacf$acf))
lengthx <- length(x)
sqrtn <- sqrt(lengthx)
load(file='createtable')
a<-table.start()
a<-table.row.start(a)
a<-table.element(a,'Autocorrelation Function',4,TRUE)
a<-table.row.end(a)
a<-table.row.start(a)
a<-table.element(a,'Time lag k',header=TRUE)
a<-table.element(a,hyperlink('basics.htm','ACF(k)','click here for more information about the Autocorrelation Function'),header=TRUE)
a<-table.element(a,'T-STAT',header=TRUE)
a<-table.element(a,'P-value',header=TRUE)
a<-table.row.end(a)
for (i in 2:(par1+1)) {
a<-table.row.start(a)
a<-table.element(a,i-1,header=TRUE)
a<-table.element(a,round(myacf[i],6))
mytstat <- myacf[i]*sqrtn
a<-table.element(a,round(mytstat,4))
a<-table.element(a,round(1-pt(abs(mytstat),lengthx),6))
a<-table.row.end(a)
}
a<-table.end(a)
table.save(a,file='mytable.tab')
a<-table.start()
a<-table.row.start(a)
a<-table.element(a,'Partial Autocorrelation Function',4,TRUE)
a<-table.row.end(a)
a<-table.row.start(a)
a<-table.element(a,'Time lag k',header=TRUE)
a<-table.element(a,hyperlink('basics.htm','PACF(k)','click here for more information about the Partial Autocorrelation Function'),header=TRUE)
a<-table.element(a,'T-STAT',header=TRUE)
a<-table.element(a,'P-value',header=TRUE)
a<-table.row.end(a)
for (i in 1:par1) {
a<-table.row.start(a)
a<-table.element(a,i,header=TRUE)
a<-table.element(a,round(mypacf[i],6))
mytstat <- mypacf[i]*sqrtn
a<-table.element(a,round(mytstat,4))
a<-table.element(a,round(1-pt(abs(mytstat),lengthx),6))
a<-table.row.end(a)
}
a<-table.end(a)
table.save(a,file='mytable1.tab')