Free Statistics

of Irreproducible Research!

Author's title

Author*Unverified author*
R Software Modulerwasp_autocorrelation.wasp
Title produced by software(Partial) Autocorrelation Function
Date of computationFri, 30 Apr 2010 14:42:39 +0000
Cite this page as followsStatistical Computations at FreeStatistics.org, Office for Research Development and Education, URL https://freestatistics.org/blog/index.php?v=date/2010/Apr/30/t127263867875gtruztbyjo4l2.htm/, Retrieved Tue, 16 Apr 2024 19:43:43 +0000
Statistical Computations at FreeStatistics.org, Office for Research Development and Education, URL https://freestatistics.org/blog/index.php?pk=75081, Retrieved Tue, 16 Apr 2024 19:43:43 +0000
QR Codes:

Original text written by user:
IsPrivate?No (this computation is public)
User-defined keywordsKDGP2W21
Estimated Impact218
Family? (F = Feedback message, R = changed R code, M = changed R Module, P = changed Parameters, D = changed Data)
-       [(Partial) Autocorrelation Function] [Autocorrelatie di...] [2010-04-30 14:42:39] [83074fc8d74b78a4134c1b297ef86df5] [Current]
Feedback Forum

Post a new message
Dataseries X:
178600
181600
178500
176700
183500
175900
179800
186500
182700
182800
178600
183300
182900
191400
189300
192200
187900
193900
189100
193100
194800
200200
211500
202100
200300
199200
204900
207300
200000
197700
202200
200200
208300
215100
210700
208100
209000
211000
210200
205500
211400
211700
209300
207500
203300
207100
206900
228700
226900
265000
227100
228100
226500
225200
217800
221300
215300
231300
227100
237800
230200
233400
231100
237200
243700
239700
248400
241000
254500
242800
268300
253900
262100
264100
261000
269300
260400
263200
279200
272200
269200
289600
283200
284300
283000
289100
289600
289100
287400
279600
289300
295000
299600
293600
294400
290200
301000
307900
298800
310300
293900
305000
311300
317300
296200
306800
291800
301900
314600
321500
329400
311700
309700
306500
307100
301300
292200
310100
316800
284400
284600
301200
287600
314300
298200
299400
301900
265500
287100
274000
290100
263100
245200
258600
259800
269800
274600
274800
271100
257800
290300
262200
270000
290600


Summary of computational transaction
Raw Inputview raw input (R code)
Raw Outputview raw output of R engine
Computing time11 seconds
R Server'RServer@AstonUniversity' @ vre.aston.ac.uk

\begin{tabular}{lllllllll}
\hline
Summary of computational transaction \tabularnewline
Raw Input & view raw input (R code)  \tabularnewline
Raw Output & view raw output of R engine  \tabularnewline
Computing time & 11 seconds \tabularnewline
R Server & 'RServer@AstonUniversity' @ vre.aston.ac.uk \tabularnewline
\hline
\end{tabular}
%Source: https://freestatistics.org/blog/index.php?pk=75081&T=0

[TABLE]
[ROW][C]Summary of computational transaction[/C][/ROW]
[ROW][C]Raw Input[/C][C]view raw input (R code) [/C][/ROW]
[ROW][C]Raw Output[/C][C]view raw output of R engine [/C][/ROW]
[ROW][C]Computing time[/C][C]11 seconds[/C][/ROW]
[ROW][C]R Server[/C][C]'RServer@AstonUniversity' @ vre.aston.ac.uk[/C][/ROW]
[/TABLE]
Source: https://freestatistics.org/blog/index.php?pk=75081&T=0

Globally Unique Identifier (entire table): ba.freestatistics.org/blog/index.php?pk=75081&T=0

As an alternative you can also use a QR Code:  

The GUIDs for individual cells are displayed in the table below:

Summary of computational transaction
Raw Inputview raw input (R code)
Raw Outputview raw output of R engine
Computing time11 seconds
R Server'RServer@AstonUniversity' @ vre.aston.ac.uk


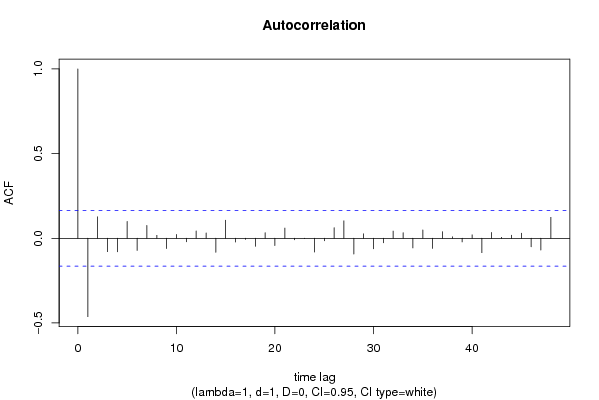
Autocorrelation Function
Time lag kACF(k)T-STATP-value
1-0.462693-5.5330
20.1268231.51660.06579
3-0.078763-0.94190.173923
4-0.079116-0.94610.17285
50.0995821.19080.117847
6-0.071623-0.85650.196581
70.0758420.90690.182981
80.0175890.21030.416851
9-0.059979-0.71720.237198
100.0230730.27590.391505
11-0.020144-0.24090.404994
120.0427710.51150.304905
130.0315240.3770.353378
14-0.082927-0.99170.161518
150.1062411.27050.102992
16-0.022364-0.26740.394762
17-0.006473-0.07740.469207
18-0.046943-0.56140.287715
190.0334710.40030.344783
20-0.043071-0.51510.303656
210.0600970.71870.236761
22-0.008353-0.09990.460286
23-0.001499-0.01790.492861
24-0.080545-0.96320.168541
25-0.014979-0.17910.429049
260.0620240.74170.229742
270.102991.23160.110063
28-0.093215-1.11470.133426
290.0261370.31250.37754
30-0.061699-0.73780.230919
31-0.026123-0.31240.377599
320.0425330.50860.305903
330.0331750.39670.346082
34-0.056582-0.67660.249868
350.0494360.59120.277669
36-0.0597-0.71390.238224
370.0393910.4710.319164
380.0087180.10420.45856
39-0.02124-0.2540.399931
400.020450.24450.40358
41-0.084724-1.01320.156348
420.0338870.40520.342957
430.0057780.06910.472505
440.0177690.21250.416013
450.0297610.35590.361223
46-0.050392-0.60260.273865
47-0.069697-0.83350.20299
480.1237111.47940.070621

\begin{tabular}{lllllllll}
\hline
Autocorrelation Function \tabularnewline
Time lag k & ACF(k) & T-STAT & P-value \tabularnewline
1 & -0.462693 & -5.533 & 0 \tabularnewline
2 & 0.126823 & 1.5166 & 0.06579 \tabularnewline
3 & -0.078763 & -0.9419 & 0.173923 \tabularnewline
4 & -0.079116 & -0.9461 & 0.17285 \tabularnewline
5 & 0.099582 & 1.1908 & 0.117847 \tabularnewline
6 & -0.071623 & -0.8565 & 0.196581 \tabularnewline
7 & 0.075842 & 0.9069 & 0.182981 \tabularnewline
8 & 0.017589 & 0.2103 & 0.416851 \tabularnewline
9 & -0.059979 & -0.7172 & 0.237198 \tabularnewline
10 & 0.023073 & 0.2759 & 0.391505 \tabularnewline
11 & -0.020144 & -0.2409 & 0.404994 \tabularnewline
12 & 0.042771 & 0.5115 & 0.304905 \tabularnewline
13 & 0.031524 & 0.377 & 0.353378 \tabularnewline
14 & -0.082927 & -0.9917 & 0.161518 \tabularnewline
15 & 0.106241 & 1.2705 & 0.102992 \tabularnewline
16 & -0.022364 & -0.2674 & 0.394762 \tabularnewline
17 & -0.006473 & -0.0774 & 0.469207 \tabularnewline
18 & -0.046943 & -0.5614 & 0.287715 \tabularnewline
19 & 0.033471 & 0.4003 & 0.344783 \tabularnewline
20 & -0.043071 & -0.5151 & 0.303656 \tabularnewline
21 & 0.060097 & 0.7187 & 0.236761 \tabularnewline
22 & -0.008353 & -0.0999 & 0.460286 \tabularnewline
23 & -0.001499 & -0.0179 & 0.492861 \tabularnewline
24 & -0.080545 & -0.9632 & 0.168541 \tabularnewline
25 & -0.014979 & -0.1791 & 0.429049 \tabularnewline
26 & 0.062024 & 0.7417 & 0.229742 \tabularnewline
27 & 0.10299 & 1.2316 & 0.110063 \tabularnewline
28 & -0.093215 & -1.1147 & 0.133426 \tabularnewline
29 & 0.026137 & 0.3125 & 0.37754 \tabularnewline
30 & -0.061699 & -0.7378 & 0.230919 \tabularnewline
31 & -0.026123 & -0.3124 & 0.377599 \tabularnewline
32 & 0.042533 & 0.5086 & 0.305903 \tabularnewline
33 & 0.033175 & 0.3967 & 0.346082 \tabularnewline
34 & -0.056582 & -0.6766 & 0.249868 \tabularnewline
35 & 0.049436 & 0.5912 & 0.277669 \tabularnewline
36 & -0.0597 & -0.7139 & 0.238224 \tabularnewline
37 & 0.039391 & 0.471 & 0.319164 \tabularnewline
38 & 0.008718 & 0.1042 & 0.45856 \tabularnewline
39 & -0.02124 & -0.254 & 0.399931 \tabularnewline
40 & 0.02045 & 0.2445 & 0.40358 \tabularnewline
41 & -0.084724 & -1.0132 & 0.156348 \tabularnewline
42 & 0.033887 & 0.4052 & 0.342957 \tabularnewline
43 & 0.005778 & 0.0691 & 0.472505 \tabularnewline
44 & 0.017769 & 0.2125 & 0.416013 \tabularnewline
45 & 0.029761 & 0.3559 & 0.361223 \tabularnewline
46 & -0.050392 & -0.6026 & 0.273865 \tabularnewline
47 & -0.069697 & -0.8335 & 0.20299 \tabularnewline
48 & 0.123711 & 1.4794 & 0.070621 \tabularnewline
\hline
\end{tabular}
%Source: https://freestatistics.org/blog/index.php?pk=75081&T=1

[TABLE]
[ROW][C]Autocorrelation Function[/C][/ROW]
[ROW][C]Time lag k[/C][C]ACF(k)[/C][C]T-STAT[/C][C]P-value[/C][/ROW]
[ROW][C]1[/C][C]-0.462693[/C][C]-5.533[/C][C]0[/C][/ROW]
[ROW][C]2[/C][C]0.126823[/C][C]1.5166[/C][C]0.06579[/C][/ROW]
[ROW][C]3[/C][C]-0.078763[/C][C]-0.9419[/C][C]0.173923[/C][/ROW]
[ROW][C]4[/C][C]-0.079116[/C][C]-0.9461[/C][C]0.17285[/C][/ROW]
[ROW][C]5[/C][C]0.099582[/C][C]1.1908[/C][C]0.117847[/C][/ROW]
[ROW][C]6[/C][C]-0.071623[/C][C]-0.8565[/C][C]0.196581[/C][/ROW]
[ROW][C]7[/C][C]0.075842[/C][C]0.9069[/C][C]0.182981[/C][/ROW]
[ROW][C]8[/C][C]0.017589[/C][C]0.2103[/C][C]0.416851[/C][/ROW]
[ROW][C]9[/C][C]-0.059979[/C][C]-0.7172[/C][C]0.237198[/C][/ROW]
[ROW][C]10[/C][C]0.023073[/C][C]0.2759[/C][C]0.391505[/C][/ROW]
[ROW][C]11[/C][C]-0.020144[/C][C]-0.2409[/C][C]0.404994[/C][/ROW]
[ROW][C]12[/C][C]0.042771[/C][C]0.5115[/C][C]0.304905[/C][/ROW]
[ROW][C]13[/C][C]0.031524[/C][C]0.377[/C][C]0.353378[/C][/ROW]
[ROW][C]14[/C][C]-0.082927[/C][C]-0.9917[/C][C]0.161518[/C][/ROW]
[ROW][C]15[/C][C]0.106241[/C][C]1.2705[/C][C]0.102992[/C][/ROW]
[ROW][C]16[/C][C]-0.022364[/C][C]-0.2674[/C][C]0.394762[/C][/ROW]
[ROW][C]17[/C][C]-0.006473[/C][C]-0.0774[/C][C]0.469207[/C][/ROW]
[ROW][C]18[/C][C]-0.046943[/C][C]-0.5614[/C][C]0.287715[/C][/ROW]
[ROW][C]19[/C][C]0.033471[/C][C]0.4003[/C][C]0.344783[/C][/ROW]
[ROW][C]20[/C][C]-0.043071[/C][C]-0.5151[/C][C]0.303656[/C][/ROW]
[ROW][C]21[/C][C]0.060097[/C][C]0.7187[/C][C]0.236761[/C][/ROW]
[ROW][C]22[/C][C]-0.008353[/C][C]-0.0999[/C][C]0.460286[/C][/ROW]
[ROW][C]23[/C][C]-0.001499[/C][C]-0.0179[/C][C]0.492861[/C][/ROW]
[ROW][C]24[/C][C]-0.080545[/C][C]-0.9632[/C][C]0.168541[/C][/ROW]
[ROW][C]25[/C][C]-0.014979[/C][C]-0.1791[/C][C]0.429049[/C][/ROW]
[ROW][C]26[/C][C]0.062024[/C][C]0.7417[/C][C]0.229742[/C][/ROW]
[ROW][C]27[/C][C]0.10299[/C][C]1.2316[/C][C]0.110063[/C][/ROW]
[ROW][C]28[/C][C]-0.093215[/C][C]-1.1147[/C][C]0.133426[/C][/ROW]
[ROW][C]29[/C][C]0.026137[/C][C]0.3125[/C][C]0.37754[/C][/ROW]
[ROW][C]30[/C][C]-0.061699[/C][C]-0.7378[/C][C]0.230919[/C][/ROW]
[ROW][C]31[/C][C]-0.026123[/C][C]-0.3124[/C][C]0.377599[/C][/ROW]
[ROW][C]32[/C][C]0.042533[/C][C]0.5086[/C][C]0.305903[/C][/ROW]
[ROW][C]33[/C][C]0.033175[/C][C]0.3967[/C][C]0.346082[/C][/ROW]
[ROW][C]34[/C][C]-0.056582[/C][C]-0.6766[/C][C]0.249868[/C][/ROW]
[ROW][C]35[/C][C]0.049436[/C][C]0.5912[/C][C]0.277669[/C][/ROW]
[ROW][C]36[/C][C]-0.0597[/C][C]-0.7139[/C][C]0.238224[/C][/ROW]
[ROW][C]37[/C][C]0.039391[/C][C]0.471[/C][C]0.319164[/C][/ROW]
[ROW][C]38[/C][C]0.008718[/C][C]0.1042[/C][C]0.45856[/C][/ROW]
[ROW][C]39[/C][C]-0.02124[/C][C]-0.254[/C][C]0.399931[/C][/ROW]
[ROW][C]40[/C][C]0.02045[/C][C]0.2445[/C][C]0.40358[/C][/ROW]
[ROW][C]41[/C][C]-0.084724[/C][C]-1.0132[/C][C]0.156348[/C][/ROW]
[ROW][C]42[/C][C]0.033887[/C][C]0.4052[/C][C]0.342957[/C][/ROW]
[ROW][C]43[/C][C]0.005778[/C][C]0.0691[/C][C]0.472505[/C][/ROW]
[ROW][C]44[/C][C]0.017769[/C][C]0.2125[/C][C]0.416013[/C][/ROW]
[ROW][C]45[/C][C]0.029761[/C][C]0.3559[/C][C]0.361223[/C][/ROW]
[ROW][C]46[/C][C]-0.050392[/C][C]-0.6026[/C][C]0.273865[/C][/ROW]
[ROW][C]47[/C][C]-0.069697[/C][C]-0.8335[/C][C]0.20299[/C][/ROW]
[ROW][C]48[/C][C]0.123711[/C][C]1.4794[/C][C]0.070621[/C][/ROW]
[/TABLE]
Source: https://freestatistics.org/blog/index.php?pk=75081&T=1

Globally Unique Identifier (entire table): ba.freestatistics.org/blog/index.php?pk=75081&T=1

As an alternative you can also use a QR Code:  

The GUIDs for individual cells are displayed in the table below:

Autocorrelation Function
Time lag kACF(k)T-STATP-value
1-0.462693-5.5330
20.1268231.51660.06579
3-0.078763-0.94190.173923
4-0.079116-0.94610.17285
50.0995821.19080.117847
6-0.071623-0.85650.196581
70.0758420.90690.182981
80.0175890.21030.416851
9-0.059979-0.71720.237198
100.0230730.27590.391505
11-0.020144-0.24090.404994
120.0427710.51150.304905
130.0315240.3770.353378
14-0.082927-0.99170.161518
150.1062411.27050.102992
16-0.022364-0.26740.394762
17-0.006473-0.07740.469207
18-0.046943-0.56140.287715
190.0334710.40030.344783
20-0.043071-0.51510.303656
210.0600970.71870.236761
22-0.008353-0.09990.460286
23-0.001499-0.01790.492861
24-0.080545-0.96320.168541
25-0.014979-0.17910.429049
260.0620240.74170.229742
270.102991.23160.110063
28-0.093215-1.11470.133426
290.0261370.31250.37754
30-0.061699-0.73780.230919
31-0.026123-0.31240.377599
320.0425330.50860.305903
330.0331750.39670.346082
34-0.056582-0.67660.249868
350.0494360.59120.277669
36-0.0597-0.71390.238224
370.0393910.4710.319164
380.0087180.10420.45856
39-0.02124-0.2540.399931
400.020450.24450.40358
41-0.084724-1.01320.156348
420.0338870.40520.342957
430.0057780.06910.472505
440.0177690.21250.416013
450.0297610.35590.361223
46-0.050392-0.60260.273865
47-0.069697-0.83350.20299
480.1237111.47940.070621


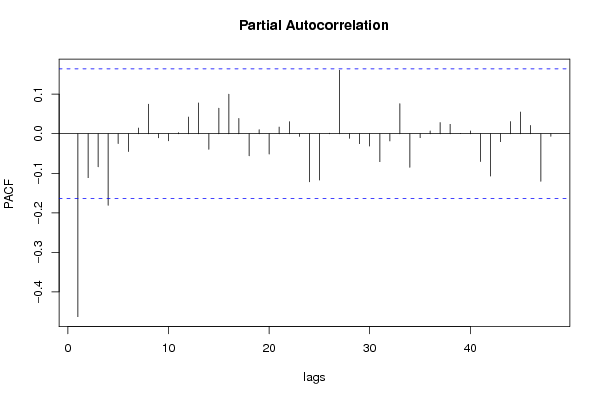
Partial Autocorrelation Function
Time lag kPACF(k)T-STATP-value
1-0.462693-5.5330
2-0.111032-1.32770.093189
3-0.083663-1.00050.159387
4-0.180997-2.16440.016046
5-0.024778-0.29630.383717
6-0.044985-0.53790.295728
70.0143060.17110.432205
80.0746370.89250.186804
9-0.010072-0.12040.452153
10-0.017889-0.21390.415458
110.0026670.03190.487301
120.0420990.50340.307718
130.0780030.93280.176251
14-0.039195-0.46870.319997
150.064530.77170.220791
160.1001431.19750.116541
170.0386620.46230.322275
18-0.055782-0.66710.252906
190.0102840.1230.451147
20-0.05134-0.61390.270118
210.0168080.2010.420496
220.0303810.36330.358458
23-0.006776-0.0810.467764
24-0.121397-1.45170.074389
25-0.116965-1.39870.082035
260.0011790.01410.494387
270.1605021.91930.028467
28-0.011342-0.13560.44615
29-0.025066-0.29980.382401
30-0.030939-0.370.355973
31-0.070537-0.84350.20018
32-0.018153-0.21710.414228
330.0759020.90770.182793
34-0.084882-1.0150.155901
35-0.009886-0.11820.453032
360.0068460.08190.467434
370.0281790.3370.368314
380.0236940.28330.388661
390.000410.00490.498048
400.0070960.08490.466247
41-0.070182-0.83930.201364
42-0.106798-1.27710.101815
43-0.020093-0.24030.405231
440.030770.3680.356725
450.05470.65410.257045
460.0209910.2510.401079
47-0.120117-1.43640.076537
48-0.006247-0.07470.470277

\begin{tabular}{lllllllll}
\hline
Partial Autocorrelation Function \tabularnewline
Time lag k & PACF(k) & T-STAT & P-value \tabularnewline
1 & -0.462693 & -5.533 & 0 \tabularnewline
2 & -0.111032 & -1.3277 & 0.093189 \tabularnewline
3 & -0.083663 & -1.0005 & 0.159387 \tabularnewline
4 & -0.180997 & -2.1644 & 0.016046 \tabularnewline
5 & -0.024778 & -0.2963 & 0.383717 \tabularnewline
6 & -0.044985 & -0.5379 & 0.295728 \tabularnewline
7 & 0.014306 & 0.1711 & 0.432205 \tabularnewline
8 & 0.074637 & 0.8925 & 0.186804 \tabularnewline
9 & -0.010072 & -0.1204 & 0.452153 \tabularnewline
10 & -0.017889 & -0.2139 & 0.415458 \tabularnewline
11 & 0.002667 & 0.0319 & 0.487301 \tabularnewline
12 & 0.042099 & 0.5034 & 0.307718 \tabularnewline
13 & 0.078003 & 0.9328 & 0.176251 \tabularnewline
14 & -0.039195 & -0.4687 & 0.319997 \tabularnewline
15 & 0.06453 & 0.7717 & 0.220791 \tabularnewline
16 & 0.100143 & 1.1975 & 0.116541 \tabularnewline
17 & 0.038662 & 0.4623 & 0.322275 \tabularnewline
18 & -0.055782 & -0.6671 & 0.252906 \tabularnewline
19 & 0.010284 & 0.123 & 0.451147 \tabularnewline
20 & -0.05134 & -0.6139 & 0.270118 \tabularnewline
21 & 0.016808 & 0.201 & 0.420496 \tabularnewline
22 & 0.030381 & 0.3633 & 0.358458 \tabularnewline
23 & -0.006776 & -0.081 & 0.467764 \tabularnewline
24 & -0.121397 & -1.4517 & 0.074389 \tabularnewline
25 & -0.116965 & -1.3987 & 0.082035 \tabularnewline
26 & 0.001179 & 0.0141 & 0.494387 \tabularnewline
27 & 0.160502 & 1.9193 & 0.028467 \tabularnewline
28 & -0.011342 & -0.1356 & 0.44615 \tabularnewline
29 & -0.025066 & -0.2998 & 0.382401 \tabularnewline
30 & -0.030939 & -0.37 & 0.355973 \tabularnewline
31 & -0.070537 & -0.8435 & 0.20018 \tabularnewline
32 & -0.018153 & -0.2171 & 0.414228 \tabularnewline
33 & 0.075902 & 0.9077 & 0.182793 \tabularnewline
34 & -0.084882 & -1.015 & 0.155901 \tabularnewline
35 & -0.009886 & -0.1182 & 0.453032 \tabularnewline
36 & 0.006846 & 0.0819 & 0.467434 \tabularnewline
37 & 0.028179 & 0.337 & 0.368314 \tabularnewline
38 & 0.023694 & 0.2833 & 0.388661 \tabularnewline
39 & 0.00041 & 0.0049 & 0.498048 \tabularnewline
40 & 0.007096 & 0.0849 & 0.466247 \tabularnewline
41 & -0.070182 & -0.8393 & 0.201364 \tabularnewline
42 & -0.106798 & -1.2771 & 0.101815 \tabularnewline
43 & -0.020093 & -0.2403 & 0.405231 \tabularnewline
44 & 0.03077 & 0.368 & 0.356725 \tabularnewline
45 & 0.0547 & 0.6541 & 0.257045 \tabularnewline
46 & 0.020991 & 0.251 & 0.401079 \tabularnewline
47 & -0.120117 & -1.4364 & 0.076537 \tabularnewline
48 & -0.006247 & -0.0747 & 0.470277 \tabularnewline
\hline
\end{tabular}
%Source: https://freestatistics.org/blog/index.php?pk=75081&T=2

[TABLE]
[ROW][C]Partial Autocorrelation Function[/C][/ROW]
[ROW][C]Time lag k[/C][C]PACF(k)[/C][C]T-STAT[/C][C]P-value[/C][/ROW]
[ROW][C]1[/C][C]-0.462693[/C][C]-5.533[/C][C]0[/C][/ROW]
[ROW][C]2[/C][C]-0.111032[/C][C]-1.3277[/C][C]0.093189[/C][/ROW]
[ROW][C]3[/C][C]-0.083663[/C][C]-1.0005[/C][C]0.159387[/C][/ROW]
[ROW][C]4[/C][C]-0.180997[/C][C]-2.1644[/C][C]0.016046[/C][/ROW]
[ROW][C]5[/C][C]-0.024778[/C][C]-0.2963[/C][C]0.383717[/C][/ROW]
[ROW][C]6[/C][C]-0.044985[/C][C]-0.5379[/C][C]0.295728[/C][/ROW]
[ROW][C]7[/C][C]0.014306[/C][C]0.1711[/C][C]0.432205[/C][/ROW]
[ROW][C]8[/C][C]0.074637[/C][C]0.8925[/C][C]0.186804[/C][/ROW]
[ROW][C]9[/C][C]-0.010072[/C][C]-0.1204[/C][C]0.452153[/C][/ROW]
[ROW][C]10[/C][C]-0.017889[/C][C]-0.2139[/C][C]0.415458[/C][/ROW]
[ROW][C]11[/C][C]0.002667[/C][C]0.0319[/C][C]0.487301[/C][/ROW]
[ROW][C]12[/C][C]0.042099[/C][C]0.5034[/C][C]0.307718[/C][/ROW]
[ROW][C]13[/C][C]0.078003[/C][C]0.9328[/C][C]0.176251[/C][/ROW]
[ROW][C]14[/C][C]-0.039195[/C][C]-0.4687[/C][C]0.319997[/C][/ROW]
[ROW][C]15[/C][C]0.06453[/C][C]0.7717[/C][C]0.220791[/C][/ROW]
[ROW][C]16[/C][C]0.100143[/C][C]1.1975[/C][C]0.116541[/C][/ROW]
[ROW][C]17[/C][C]0.038662[/C][C]0.4623[/C][C]0.322275[/C][/ROW]
[ROW][C]18[/C][C]-0.055782[/C][C]-0.6671[/C][C]0.252906[/C][/ROW]
[ROW][C]19[/C][C]0.010284[/C][C]0.123[/C][C]0.451147[/C][/ROW]
[ROW][C]20[/C][C]-0.05134[/C][C]-0.6139[/C][C]0.270118[/C][/ROW]
[ROW][C]21[/C][C]0.016808[/C][C]0.201[/C][C]0.420496[/C][/ROW]
[ROW][C]22[/C][C]0.030381[/C][C]0.3633[/C][C]0.358458[/C][/ROW]
[ROW][C]23[/C][C]-0.006776[/C][C]-0.081[/C][C]0.467764[/C][/ROW]
[ROW][C]24[/C][C]-0.121397[/C][C]-1.4517[/C][C]0.074389[/C][/ROW]
[ROW][C]25[/C][C]-0.116965[/C][C]-1.3987[/C][C]0.082035[/C][/ROW]
[ROW][C]26[/C][C]0.001179[/C][C]0.0141[/C][C]0.494387[/C][/ROW]
[ROW][C]27[/C][C]0.160502[/C][C]1.9193[/C][C]0.028467[/C][/ROW]
[ROW][C]28[/C][C]-0.011342[/C][C]-0.1356[/C][C]0.44615[/C][/ROW]
[ROW][C]29[/C][C]-0.025066[/C][C]-0.2998[/C][C]0.382401[/C][/ROW]
[ROW][C]30[/C][C]-0.030939[/C][C]-0.37[/C][C]0.355973[/C][/ROW]
[ROW][C]31[/C][C]-0.070537[/C][C]-0.8435[/C][C]0.20018[/C][/ROW]
[ROW][C]32[/C][C]-0.018153[/C][C]-0.2171[/C][C]0.414228[/C][/ROW]
[ROW][C]33[/C][C]0.075902[/C][C]0.9077[/C][C]0.182793[/C][/ROW]
[ROW][C]34[/C][C]-0.084882[/C][C]-1.015[/C][C]0.155901[/C][/ROW]
[ROW][C]35[/C][C]-0.009886[/C][C]-0.1182[/C][C]0.453032[/C][/ROW]
[ROW][C]36[/C][C]0.006846[/C][C]0.0819[/C][C]0.467434[/C][/ROW]
[ROW][C]37[/C][C]0.028179[/C][C]0.337[/C][C]0.368314[/C][/ROW]
[ROW][C]38[/C][C]0.023694[/C][C]0.2833[/C][C]0.388661[/C][/ROW]
[ROW][C]39[/C][C]0.00041[/C][C]0.0049[/C][C]0.498048[/C][/ROW]
[ROW][C]40[/C][C]0.007096[/C][C]0.0849[/C][C]0.466247[/C][/ROW]
[ROW][C]41[/C][C]-0.070182[/C][C]-0.8393[/C][C]0.201364[/C][/ROW]
[ROW][C]42[/C][C]-0.106798[/C][C]-1.2771[/C][C]0.101815[/C][/ROW]
[ROW][C]43[/C][C]-0.020093[/C][C]-0.2403[/C][C]0.405231[/C][/ROW]
[ROW][C]44[/C][C]0.03077[/C][C]0.368[/C][C]0.356725[/C][/ROW]
[ROW][C]45[/C][C]0.0547[/C][C]0.6541[/C][C]0.257045[/C][/ROW]
[ROW][C]46[/C][C]0.020991[/C][C]0.251[/C][C]0.401079[/C][/ROW]
[ROW][C]47[/C][C]-0.120117[/C][C]-1.4364[/C][C]0.076537[/C][/ROW]
[ROW][C]48[/C][C]-0.006247[/C][C]-0.0747[/C][C]0.470277[/C][/ROW]
[/TABLE]
Source: https://freestatistics.org/blog/index.php?pk=75081&T=2

Globally Unique Identifier (entire table): ba.freestatistics.org/blog/index.php?pk=75081&T=2

As an alternative you can also use a QR Code:  

The GUIDs for individual cells are displayed in the table below:

Partial Autocorrelation Function
Time lag kPACF(k)T-STATP-value
1-0.462693-5.5330
2-0.111032-1.32770.093189
3-0.083663-1.00050.159387
4-0.180997-2.16440.016046
5-0.024778-0.29630.383717
6-0.044985-0.53790.295728
70.0143060.17110.432205
80.0746370.89250.186804
9-0.010072-0.12040.452153
10-0.017889-0.21390.415458
110.0026670.03190.487301
120.0420990.50340.307718
130.0780030.93280.176251
14-0.039195-0.46870.319997
150.064530.77170.220791
160.1001431.19750.116541
170.0386620.46230.322275
18-0.055782-0.66710.252906
190.0102840.1230.451147
20-0.05134-0.61390.270118
210.0168080.2010.420496
220.0303810.36330.358458
23-0.006776-0.0810.467764
24-0.121397-1.45170.074389
25-0.116965-1.39870.082035
260.0011790.01410.494387
270.1605021.91930.028467
28-0.011342-0.13560.44615
29-0.025066-0.29980.382401
30-0.030939-0.370.355973
31-0.070537-0.84350.20018
32-0.018153-0.21710.414228
330.0759020.90770.182793
34-0.084882-1.0150.155901
35-0.009886-0.11820.453032
360.0068460.08190.467434
370.0281790.3370.368314
380.0236940.28330.388661
390.000410.00490.498048
400.0070960.08490.466247
41-0.070182-0.83930.201364
42-0.106798-1.27710.101815
43-0.020093-0.24030.405231
440.030770.3680.356725
450.05470.65410.257045
460.0209910.2510.401079
47-0.120117-1.43640.076537
48-0.006247-0.07470.470277


Parameters (Session):
par1 = 48 ; par2 = 1 ; par3 = 1 ; par4 = 0 ; par5 = 12 ; par6 = White Noise ; par7 = 0.95 ;
Parameters (R input):
par1 = 48 ; par2 = 1 ; par3 = 1 ; par4 = 0 ; par5 = 12 ; par6 = White Noise ; par7 = 0.95 ;
R code (references can be found in the software module):
if (par1 == 'Default') {
par1 = 10*log10(length(x))
} else {
par1 <- as.numeric(par1)
}
par2 <- as.numeric(par2)
par3 <- as.numeric(par3)
par4 <- as.numeric(par4)
par5 <- as.numeric(par5)
if (par6 == 'White Noise') par6 <- 'white' else par6 <- 'ma'
par7 <- as.numeric(par7)
if (par2 == 0) {
x <- log(x)
} else {
x <- (x ^ par2 - 1) / par2
}
if (par3 > 0) x <- diff(x,lag=1,difference=par3)
if (par4 > 0) x <- diff(x,lag=par5,difference=par4)
bitmap(file='pic1.png')
racf <- acf(x, par1, main='Autocorrelation', xlab='time lag', ylab='ACF', ci.type=par6, ci=par7, sub=paste('(lambda=',par2,', d=',par3,', D=',par4,', CI=', par7, ', CI type=',par6,')',sep=''))
dev.off()
bitmap(file='pic2.png')
rpacf <- pacf(x,par1,main='Partial Autocorrelation',xlab='lags',ylab='PACF')
dev.off()
(myacf <- c(racf$acf))
(mypacf <- c(rpacf$acf))
lengthx <- length(x)
sqrtn <- sqrt(lengthx)
load(file='createtable')
a<-table.start()
a<-table.row.start(a)
a<-table.element(a,'Autocorrelation Function',4,TRUE)
a<-table.row.end(a)
a<-table.row.start(a)
a<-table.element(a,'Time lag k',header=TRUE)
a<-table.element(a,hyperlink('basics.htm','ACF(k)','click here for more information about the Autocorrelation Function'),header=TRUE)
a<-table.element(a,'T-STAT',header=TRUE)
a<-table.element(a,'P-value',header=TRUE)
a<-table.row.end(a)
for (i in 2:(par1+1)) {
a<-table.row.start(a)
a<-table.element(a,i-1,header=TRUE)
a<-table.element(a,round(myacf[i],6))
mytstat <- myacf[i]*sqrtn
a<-table.element(a,round(mytstat,4))
a<-table.element(a,round(1-pt(abs(mytstat),lengthx),6))
a<-table.row.end(a)
}
a<-table.end(a)
table.save(a,file='mytable.tab')
a<-table.start()
a<-table.row.start(a)
a<-table.element(a,'Partial Autocorrelation Function',4,TRUE)
a<-table.row.end(a)
a<-table.row.start(a)
a<-table.element(a,'Time lag k',header=TRUE)
a<-table.element(a,hyperlink('basics.htm','PACF(k)','click here for more information about the Partial Autocorrelation Function'),header=TRUE)
a<-table.element(a,'T-STAT',header=TRUE)
a<-table.element(a,'P-value',header=TRUE)
a<-table.row.end(a)
for (i in 1:par1) {
a<-table.row.start(a)
a<-table.element(a,i,header=TRUE)
a<-table.element(a,round(mypacf[i],6))
mytstat <- mypacf[i]*sqrtn
a<-table.element(a,round(mytstat,4))
a<-table.element(a,round(1-pt(abs(mytstat),lengthx),6))
a<-table.row.end(a)
}
a<-table.end(a)
table.save(a,file='mytable1.tab')