Free Statistics

of Irreproducible Research!

Author's title

Author*Unverified author*
R Software Modulerwasp_autocorrelation.wasp
Title produced by software(Partial) Autocorrelation Function
Date of computationFri, 30 Apr 2010 14:37:59 +0000
Cite this page as followsStatistical Computations at FreeStatistics.org, Office for Research Development and Education, URL https://freestatistics.org/blog/index.php?v=date/2010/Apr/30/t12726384290fvyzo3czcclpsg.htm/, Retrieved Thu, 25 Apr 2024 10:51:35 +0000
Statistical Computations at FreeStatistics.org, Office for Research Development and Education, URL https://freestatistics.org/blog/index.php?pk=75080, Retrieved Thu, 25 Apr 2024 10:51:35 +0000
QR Codes:

Original text written by user:
IsPrivate?No (this computation is public)
User-defined keywordsKDGP2W21
Estimated Impact219
Family? (F = Feedback message, R = changed R code, M = changed R Module, P = changed Parameters, D = changed Data)
-       [(Partial) Autocorrelation Function] [Autocorrelatie - ...] [2010-04-30 14:37:59] [83074fc8d74b78a4134c1b297ef86df5] [Current]
Feedback Forum

Post a new message
Dataseries X:
178600
181600
178500
176700
183500
175900
179800
186500
182700
182800
178600
183300
182900
191400
189300
192200
187900
193900
189100
193100
194800
200200
211500
202100
200300
199200
204900
207300
200000
197700
202200
200200
208300
215100
210700
208100
209000
211000
210200
205500
211400
211700
209300
207500
203300
207100
206900
228700
226900
265000
227100
228100
226500
225200
217800
221300
215300
231300
227100
237800
230200
233400
231100
237200
243700
239700
248400
241000
254500
242800
268300
253900
262100
264100
261000
269300
260400
263200
279200
272200
269200
289600
283200
284300
283000
289100
289600
289100
287400
279600
289300
295000
299600
293600
294400
290200
301000
307900
298800
310300
293900
305000
311300
317300
296200
306800
291800
301900
314600
321500
329400
311700
309700
306500
307100
301300
292200
310100
316800
284400
284600
301200
287600
314300
298200
299400
301900
265500
287100
274000
290100
263100
245200
258600
259800
269800
274600
274800
271100
257800
290300
262200
270000
290600


Summary of computational transaction
Raw Inputview raw input (R code)
Raw Outputview raw output of R engine
Computing time2 seconds
R Server'Sir Ronald Aylmer Fisher' @ 193.190.124.24

\begin{tabular}{lllllllll}
\hline
Summary of computational transaction \tabularnewline
Raw Input & view raw input (R code)  \tabularnewline
Raw Output & view raw output of R engine  \tabularnewline
Computing time & 2 seconds \tabularnewline
R Server & 'Sir Ronald Aylmer Fisher' @ 193.190.124.24 \tabularnewline
\hline
\end{tabular}
%Source: https://freestatistics.org/blog/index.php?pk=75080&T=0

[TABLE]
[ROW][C]Summary of computational transaction[/C][/ROW]
[ROW][C]Raw Input[/C][C]view raw input (R code) [/C][/ROW]
[ROW][C]Raw Output[/C][C]view raw output of R engine [/C][/ROW]
[ROW][C]Computing time[/C][C]2 seconds[/C][/ROW]
[ROW][C]R Server[/C][C]'Sir Ronald Aylmer Fisher' @ 193.190.124.24[/C][/ROW]
[/TABLE]
Source: https://freestatistics.org/blog/index.php?pk=75080&T=0

Globally Unique Identifier (entire table): ba.freestatistics.org/blog/index.php?pk=75080&T=0

As an alternative you can also use a QR Code:  

The GUIDs for individual cells are displayed in the table below:

Summary of computational transaction
Raw Inputview raw input (R code)
Raw Outputview raw output of R engine
Computing time2 seconds
R Server'Sir Ronald Aylmer Fisher' @ 193.190.124.24


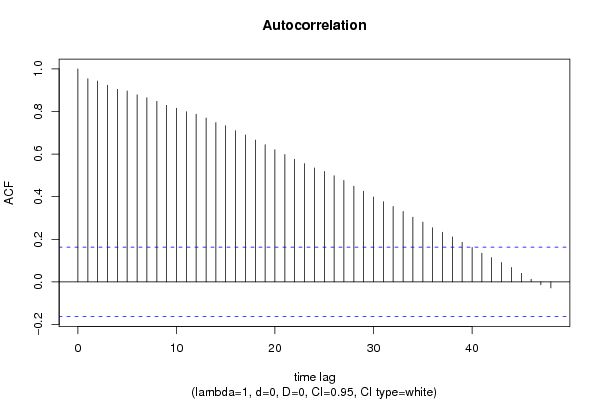
Autocorrelation Function
Time lag kACF(k)T-STATP-value
10.95403411.44840
20.94291911.3150
30.9233411.08010
40.90419710.85040
50.89667510.76010
60.87826610.53920
70.8648710.37840
80.84779910.17360
90.8290229.94830
100.815569.78670
110.7994089.59290
120.7875739.45090
130.7698679.23840
140.7479138.9750
150.7331368.79760
160.709688.51620
170.6895678.27480
180.6657347.98880
190.6438867.72660
200.6206247.44750
210.5979697.17560
220.5762336.91480
230.5556246.66750
240.5348956.41870
250.5189076.22690
260.4985245.98230
270.4760125.71210
280.4494625.39350
290.4257025.10841e-06
300.3983724.78052e-06
310.3760874.5137e-06
320.3542244.25071.9e-05
330.3308743.97055.6e-05
340.304013.64810.000184
350.280643.36770.000486
360.2539053.04690.001376
370.2329622.79550.002944
380.211032.53240.006201
390.1857562.22910.013679
400.1619481.94340.02696
410.134771.61720.054007
420.1139161.3670.08688
430.0907251.08870.139052
440.0679810.81580.207989
450.0401750.48210.315234
460.0126450.15170.439804
47-0.013241-0.15890.436989
48-0.028197-0.33840.367793

\begin{tabular}{lllllllll}
\hline
Autocorrelation Function \tabularnewline
Time lag k & ACF(k) & T-STAT & P-value \tabularnewline
1 & 0.954034 & 11.4484 & 0 \tabularnewline
2 & 0.942919 & 11.315 & 0 \tabularnewline
3 & 0.92334 & 11.0801 & 0 \tabularnewline
4 & 0.904197 & 10.8504 & 0 \tabularnewline
5 & 0.896675 & 10.7601 & 0 \tabularnewline
6 & 0.878266 & 10.5392 & 0 \tabularnewline
7 & 0.86487 & 10.3784 & 0 \tabularnewline
8 & 0.847799 & 10.1736 & 0 \tabularnewline
9 & 0.829022 & 9.9483 & 0 \tabularnewline
10 & 0.81556 & 9.7867 & 0 \tabularnewline
11 & 0.799408 & 9.5929 & 0 \tabularnewline
12 & 0.787573 & 9.4509 & 0 \tabularnewline
13 & 0.769867 & 9.2384 & 0 \tabularnewline
14 & 0.747913 & 8.975 & 0 \tabularnewline
15 & 0.733136 & 8.7976 & 0 \tabularnewline
16 & 0.70968 & 8.5162 & 0 \tabularnewline
17 & 0.689567 & 8.2748 & 0 \tabularnewline
18 & 0.665734 & 7.9888 & 0 \tabularnewline
19 & 0.643886 & 7.7266 & 0 \tabularnewline
20 & 0.620624 & 7.4475 & 0 \tabularnewline
21 & 0.597969 & 7.1756 & 0 \tabularnewline
22 & 0.576233 & 6.9148 & 0 \tabularnewline
23 & 0.555624 & 6.6675 & 0 \tabularnewline
24 & 0.534895 & 6.4187 & 0 \tabularnewline
25 & 0.518907 & 6.2269 & 0 \tabularnewline
26 & 0.498524 & 5.9823 & 0 \tabularnewline
27 & 0.476012 & 5.7121 & 0 \tabularnewline
28 & 0.449462 & 5.3935 & 0 \tabularnewline
29 & 0.425702 & 5.1084 & 1e-06 \tabularnewline
30 & 0.398372 & 4.7805 & 2e-06 \tabularnewline
31 & 0.376087 & 4.513 & 7e-06 \tabularnewline
32 & 0.354224 & 4.2507 & 1.9e-05 \tabularnewline
33 & 0.330874 & 3.9705 & 5.6e-05 \tabularnewline
34 & 0.30401 & 3.6481 & 0.000184 \tabularnewline
35 & 0.28064 & 3.3677 & 0.000486 \tabularnewline
36 & 0.253905 & 3.0469 & 0.001376 \tabularnewline
37 & 0.232962 & 2.7955 & 0.002944 \tabularnewline
38 & 0.21103 & 2.5324 & 0.006201 \tabularnewline
39 & 0.185756 & 2.2291 & 0.013679 \tabularnewline
40 & 0.161948 & 1.9434 & 0.02696 \tabularnewline
41 & 0.13477 & 1.6172 & 0.054007 \tabularnewline
42 & 0.113916 & 1.367 & 0.08688 \tabularnewline
43 & 0.090725 & 1.0887 & 0.139052 \tabularnewline
44 & 0.067981 & 0.8158 & 0.207989 \tabularnewline
45 & 0.040175 & 0.4821 & 0.315234 \tabularnewline
46 & 0.012645 & 0.1517 & 0.439804 \tabularnewline
47 & -0.013241 & -0.1589 & 0.436989 \tabularnewline
48 & -0.028197 & -0.3384 & 0.367793 \tabularnewline
\hline
\end{tabular}
%Source: https://freestatistics.org/blog/index.php?pk=75080&T=1

[TABLE]
[ROW][C]Autocorrelation Function[/C][/ROW]
[ROW][C]Time lag k[/C][C]ACF(k)[/C][C]T-STAT[/C][C]P-value[/C][/ROW]
[ROW][C]1[/C][C]0.954034[/C][C]11.4484[/C][C]0[/C][/ROW]
[ROW][C]2[/C][C]0.942919[/C][C]11.315[/C][C]0[/C][/ROW]
[ROW][C]3[/C][C]0.92334[/C][C]11.0801[/C][C]0[/C][/ROW]
[ROW][C]4[/C][C]0.904197[/C][C]10.8504[/C][C]0[/C][/ROW]
[ROW][C]5[/C][C]0.896675[/C][C]10.7601[/C][C]0[/C][/ROW]
[ROW][C]6[/C][C]0.878266[/C][C]10.5392[/C][C]0[/C][/ROW]
[ROW][C]7[/C][C]0.86487[/C][C]10.3784[/C][C]0[/C][/ROW]
[ROW][C]8[/C][C]0.847799[/C][C]10.1736[/C][C]0[/C][/ROW]
[ROW][C]9[/C][C]0.829022[/C][C]9.9483[/C][C]0[/C][/ROW]
[ROW][C]10[/C][C]0.81556[/C][C]9.7867[/C][C]0[/C][/ROW]
[ROW][C]11[/C][C]0.799408[/C][C]9.5929[/C][C]0[/C][/ROW]
[ROW][C]12[/C][C]0.787573[/C][C]9.4509[/C][C]0[/C][/ROW]
[ROW][C]13[/C][C]0.769867[/C][C]9.2384[/C][C]0[/C][/ROW]
[ROW][C]14[/C][C]0.747913[/C][C]8.975[/C][C]0[/C][/ROW]
[ROW][C]15[/C][C]0.733136[/C][C]8.7976[/C][C]0[/C][/ROW]
[ROW][C]16[/C][C]0.70968[/C][C]8.5162[/C][C]0[/C][/ROW]
[ROW][C]17[/C][C]0.689567[/C][C]8.2748[/C][C]0[/C][/ROW]
[ROW][C]18[/C][C]0.665734[/C][C]7.9888[/C][C]0[/C][/ROW]
[ROW][C]19[/C][C]0.643886[/C][C]7.7266[/C][C]0[/C][/ROW]
[ROW][C]20[/C][C]0.620624[/C][C]7.4475[/C][C]0[/C][/ROW]
[ROW][C]21[/C][C]0.597969[/C][C]7.1756[/C][C]0[/C][/ROW]
[ROW][C]22[/C][C]0.576233[/C][C]6.9148[/C][C]0[/C][/ROW]
[ROW][C]23[/C][C]0.555624[/C][C]6.6675[/C][C]0[/C][/ROW]
[ROW][C]24[/C][C]0.534895[/C][C]6.4187[/C][C]0[/C][/ROW]
[ROW][C]25[/C][C]0.518907[/C][C]6.2269[/C][C]0[/C][/ROW]
[ROW][C]26[/C][C]0.498524[/C][C]5.9823[/C][C]0[/C][/ROW]
[ROW][C]27[/C][C]0.476012[/C][C]5.7121[/C][C]0[/C][/ROW]
[ROW][C]28[/C][C]0.449462[/C][C]5.3935[/C][C]0[/C][/ROW]
[ROW][C]29[/C][C]0.425702[/C][C]5.1084[/C][C]1e-06[/C][/ROW]
[ROW][C]30[/C][C]0.398372[/C][C]4.7805[/C][C]2e-06[/C][/ROW]
[ROW][C]31[/C][C]0.376087[/C][C]4.513[/C][C]7e-06[/C][/ROW]
[ROW][C]32[/C][C]0.354224[/C][C]4.2507[/C][C]1.9e-05[/C][/ROW]
[ROW][C]33[/C][C]0.330874[/C][C]3.9705[/C][C]5.6e-05[/C][/ROW]
[ROW][C]34[/C][C]0.30401[/C][C]3.6481[/C][C]0.000184[/C][/ROW]
[ROW][C]35[/C][C]0.28064[/C][C]3.3677[/C][C]0.000486[/C][/ROW]
[ROW][C]36[/C][C]0.253905[/C][C]3.0469[/C][C]0.001376[/C][/ROW]
[ROW][C]37[/C][C]0.232962[/C][C]2.7955[/C][C]0.002944[/C][/ROW]
[ROW][C]38[/C][C]0.21103[/C][C]2.5324[/C][C]0.006201[/C][/ROW]
[ROW][C]39[/C][C]0.185756[/C][C]2.2291[/C][C]0.013679[/C][/ROW]
[ROW][C]40[/C][C]0.161948[/C][C]1.9434[/C][C]0.02696[/C][/ROW]
[ROW][C]41[/C][C]0.13477[/C][C]1.6172[/C][C]0.054007[/C][/ROW]
[ROW][C]42[/C][C]0.113916[/C][C]1.367[/C][C]0.08688[/C][/ROW]
[ROW][C]43[/C][C]0.090725[/C][C]1.0887[/C][C]0.139052[/C][/ROW]
[ROW][C]44[/C][C]0.067981[/C][C]0.8158[/C][C]0.207989[/C][/ROW]
[ROW][C]45[/C][C]0.040175[/C][C]0.4821[/C][C]0.315234[/C][/ROW]
[ROW][C]46[/C][C]0.012645[/C][C]0.1517[/C][C]0.439804[/C][/ROW]
[ROW][C]47[/C][C]-0.013241[/C][C]-0.1589[/C][C]0.436989[/C][/ROW]
[ROW][C]48[/C][C]-0.028197[/C][C]-0.3384[/C][C]0.367793[/C][/ROW]
[/TABLE]
Source: https://freestatistics.org/blog/index.php?pk=75080&T=1

Globally Unique Identifier (entire table): ba.freestatistics.org/blog/index.php?pk=75080&T=1

As an alternative you can also use a QR Code:  

The GUIDs for individual cells are displayed in the table below:

Autocorrelation Function
Time lag kACF(k)T-STATP-value
10.95403411.44840
20.94291911.3150
30.9233411.08010
40.90419710.85040
50.89667510.76010
60.87826610.53920
70.8648710.37840
80.84779910.17360
90.8290229.94830
100.815569.78670
110.7994089.59290
120.7875739.45090
130.7698679.23840
140.7479138.9750
150.7331368.79760
160.709688.51620
170.6895678.27480
180.6657347.98880
190.6438867.72660
200.6206247.44750
210.5979697.17560
220.5762336.91480
230.5556246.66750
240.5348956.41870
250.5189076.22690
260.4985245.98230
270.4760125.71210
280.4494625.39350
290.4257025.10841e-06
300.3983724.78052e-06
310.3760874.5137e-06
320.3542244.25071.9e-05
330.3308743.97055.6e-05
340.304013.64810.000184
350.280643.36770.000486
360.2539053.04690.001376
370.2329622.79550.002944
380.211032.53240.006201
390.1857562.22910.013679
400.1619481.94340.02696
410.134771.61720.054007
420.1139161.3670.08688
430.0907251.08870.139052
440.0679810.81580.207989
450.0401750.48210.315234
460.0126450.15170.439804
47-0.013241-0.15890.436989
48-0.028197-0.33840.367793


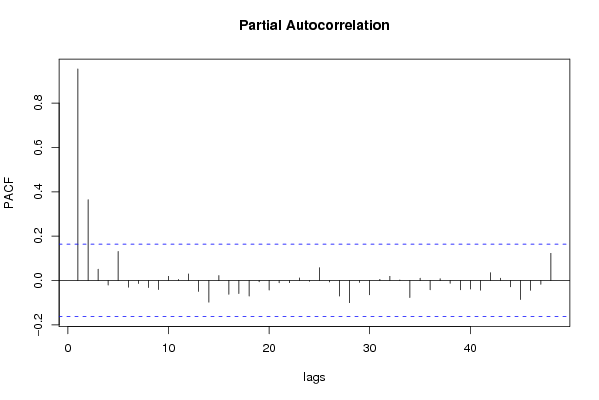
Partial Autocorrelation Function
Time lag kPACF(k)T-STATP-value
10.95403411.44840
20.3644874.37381.2e-05
30.0502640.60320.273672
4-0.020698-0.24840.4021
50.1309631.57160.059124
6-0.03023-0.36280.35866
7-0.013795-0.16550.434376
8-0.031603-0.37920.352534
9-0.041203-0.49440.310876
100.0184430.22130.412578
110.0041560.04990.480144
120.0289290.34710.364494
13-0.049326-0.59190.277419
14-0.097863-1.17440.121095
150.0217540.26110.397213
16-0.062082-0.7450.228747
17-0.058941-0.70730.240265
18-0.06995-0.83940.201318
19-0.006206-0.07450.470371
20-0.042991-0.51590.303361
21-0.010272-0.12330.451034
22-0.010086-0.1210.451917
230.011030.13240.44744
24-0.003542-0.04250.483079
250.0573980.68880.246036
26-0.006646-0.07980.468271
27-0.070583-0.8470.199202
28-0.10019-1.20230.115615
29-0.008945-0.10730.457333
30-0.06468-0.77620.219462
310.0048750.05850.476715
320.0184040.22080.412763
330.0019790.02370.490544
34-0.076748-0.9210.179303
350.0098490.11820.453039
36-0.042406-0.50890.305812
370.0073510.08820.464915
38-0.012378-0.14850.441063
39-0.041916-0.5030.307867
40-0.038781-0.46540.321184
41-0.043805-0.52570.299965
420.0347890.41750.338479
430.0103380.12410.450724
44-0.028336-0.340.367165
45-0.085708-1.02850.152721
46-0.04459-0.53510.296709
47-0.017685-0.21220.41612
480.1222041.46640.072354

\begin{tabular}{lllllllll}
\hline
Partial Autocorrelation Function \tabularnewline
Time lag k & PACF(k) & T-STAT & P-value \tabularnewline
1 & 0.954034 & 11.4484 & 0 \tabularnewline
2 & 0.364487 & 4.3738 & 1.2e-05 \tabularnewline
3 & 0.050264 & 0.6032 & 0.273672 \tabularnewline
4 & -0.020698 & -0.2484 & 0.4021 \tabularnewline
5 & 0.130963 & 1.5716 & 0.059124 \tabularnewline
6 & -0.03023 & -0.3628 & 0.35866 \tabularnewline
7 & -0.013795 & -0.1655 & 0.434376 \tabularnewline
8 & -0.031603 & -0.3792 & 0.352534 \tabularnewline
9 & -0.041203 & -0.4944 & 0.310876 \tabularnewline
10 & 0.018443 & 0.2213 & 0.412578 \tabularnewline
11 & 0.004156 & 0.0499 & 0.480144 \tabularnewline
12 & 0.028929 & 0.3471 & 0.364494 \tabularnewline
13 & -0.049326 & -0.5919 & 0.277419 \tabularnewline
14 & -0.097863 & -1.1744 & 0.121095 \tabularnewline
15 & 0.021754 & 0.2611 & 0.397213 \tabularnewline
16 & -0.062082 & -0.745 & 0.228747 \tabularnewline
17 & -0.058941 & -0.7073 & 0.240265 \tabularnewline
18 & -0.06995 & -0.8394 & 0.201318 \tabularnewline
19 & -0.006206 & -0.0745 & 0.470371 \tabularnewline
20 & -0.042991 & -0.5159 & 0.303361 \tabularnewline
21 & -0.010272 & -0.1233 & 0.451034 \tabularnewline
22 & -0.010086 & -0.121 & 0.451917 \tabularnewline
23 & 0.01103 & 0.1324 & 0.44744 \tabularnewline
24 & -0.003542 & -0.0425 & 0.483079 \tabularnewline
25 & 0.057398 & 0.6888 & 0.246036 \tabularnewline
26 & -0.006646 & -0.0798 & 0.468271 \tabularnewline
27 & -0.070583 & -0.847 & 0.199202 \tabularnewline
28 & -0.10019 & -1.2023 & 0.115615 \tabularnewline
29 & -0.008945 & -0.1073 & 0.457333 \tabularnewline
30 & -0.06468 & -0.7762 & 0.219462 \tabularnewline
31 & 0.004875 & 0.0585 & 0.476715 \tabularnewline
32 & 0.018404 & 0.2208 & 0.412763 \tabularnewline
33 & 0.001979 & 0.0237 & 0.490544 \tabularnewline
34 & -0.076748 & -0.921 & 0.179303 \tabularnewline
35 & 0.009849 & 0.1182 & 0.453039 \tabularnewline
36 & -0.042406 & -0.5089 & 0.305812 \tabularnewline
37 & 0.007351 & 0.0882 & 0.464915 \tabularnewline
38 & -0.012378 & -0.1485 & 0.441063 \tabularnewline
39 & -0.041916 & -0.503 & 0.307867 \tabularnewline
40 & -0.038781 & -0.4654 & 0.321184 \tabularnewline
41 & -0.043805 & -0.5257 & 0.299965 \tabularnewline
42 & 0.034789 & 0.4175 & 0.338479 \tabularnewline
43 & 0.010338 & 0.1241 & 0.450724 \tabularnewline
44 & -0.028336 & -0.34 & 0.367165 \tabularnewline
45 & -0.085708 & -1.0285 & 0.152721 \tabularnewline
46 & -0.04459 & -0.5351 & 0.296709 \tabularnewline
47 & -0.017685 & -0.2122 & 0.41612 \tabularnewline
48 & 0.122204 & 1.4664 & 0.072354 \tabularnewline
\hline
\end{tabular}
%Source: https://freestatistics.org/blog/index.php?pk=75080&T=2

[TABLE]
[ROW][C]Partial Autocorrelation Function[/C][/ROW]
[ROW][C]Time lag k[/C][C]PACF(k)[/C][C]T-STAT[/C][C]P-value[/C][/ROW]
[ROW][C]1[/C][C]0.954034[/C][C]11.4484[/C][C]0[/C][/ROW]
[ROW][C]2[/C][C]0.364487[/C][C]4.3738[/C][C]1.2e-05[/C][/ROW]
[ROW][C]3[/C][C]0.050264[/C][C]0.6032[/C][C]0.273672[/C][/ROW]
[ROW][C]4[/C][C]-0.020698[/C][C]-0.2484[/C][C]0.4021[/C][/ROW]
[ROW][C]5[/C][C]0.130963[/C][C]1.5716[/C][C]0.059124[/C][/ROW]
[ROW][C]6[/C][C]-0.03023[/C][C]-0.3628[/C][C]0.35866[/C][/ROW]
[ROW][C]7[/C][C]-0.013795[/C][C]-0.1655[/C][C]0.434376[/C][/ROW]
[ROW][C]8[/C][C]-0.031603[/C][C]-0.3792[/C][C]0.352534[/C][/ROW]
[ROW][C]9[/C][C]-0.041203[/C][C]-0.4944[/C][C]0.310876[/C][/ROW]
[ROW][C]10[/C][C]0.018443[/C][C]0.2213[/C][C]0.412578[/C][/ROW]
[ROW][C]11[/C][C]0.004156[/C][C]0.0499[/C][C]0.480144[/C][/ROW]
[ROW][C]12[/C][C]0.028929[/C][C]0.3471[/C][C]0.364494[/C][/ROW]
[ROW][C]13[/C][C]-0.049326[/C][C]-0.5919[/C][C]0.277419[/C][/ROW]
[ROW][C]14[/C][C]-0.097863[/C][C]-1.1744[/C][C]0.121095[/C][/ROW]
[ROW][C]15[/C][C]0.021754[/C][C]0.2611[/C][C]0.397213[/C][/ROW]
[ROW][C]16[/C][C]-0.062082[/C][C]-0.745[/C][C]0.228747[/C][/ROW]
[ROW][C]17[/C][C]-0.058941[/C][C]-0.7073[/C][C]0.240265[/C][/ROW]
[ROW][C]18[/C][C]-0.06995[/C][C]-0.8394[/C][C]0.201318[/C][/ROW]
[ROW][C]19[/C][C]-0.006206[/C][C]-0.0745[/C][C]0.470371[/C][/ROW]
[ROW][C]20[/C][C]-0.042991[/C][C]-0.5159[/C][C]0.303361[/C][/ROW]
[ROW][C]21[/C][C]-0.010272[/C][C]-0.1233[/C][C]0.451034[/C][/ROW]
[ROW][C]22[/C][C]-0.010086[/C][C]-0.121[/C][C]0.451917[/C][/ROW]
[ROW][C]23[/C][C]0.01103[/C][C]0.1324[/C][C]0.44744[/C][/ROW]
[ROW][C]24[/C][C]-0.003542[/C][C]-0.0425[/C][C]0.483079[/C][/ROW]
[ROW][C]25[/C][C]0.057398[/C][C]0.6888[/C][C]0.246036[/C][/ROW]
[ROW][C]26[/C][C]-0.006646[/C][C]-0.0798[/C][C]0.468271[/C][/ROW]
[ROW][C]27[/C][C]-0.070583[/C][C]-0.847[/C][C]0.199202[/C][/ROW]
[ROW][C]28[/C][C]-0.10019[/C][C]-1.2023[/C][C]0.115615[/C][/ROW]
[ROW][C]29[/C][C]-0.008945[/C][C]-0.1073[/C][C]0.457333[/C][/ROW]
[ROW][C]30[/C][C]-0.06468[/C][C]-0.7762[/C][C]0.219462[/C][/ROW]
[ROW][C]31[/C][C]0.004875[/C][C]0.0585[/C][C]0.476715[/C][/ROW]
[ROW][C]32[/C][C]0.018404[/C][C]0.2208[/C][C]0.412763[/C][/ROW]
[ROW][C]33[/C][C]0.001979[/C][C]0.0237[/C][C]0.490544[/C][/ROW]
[ROW][C]34[/C][C]-0.076748[/C][C]-0.921[/C][C]0.179303[/C][/ROW]
[ROW][C]35[/C][C]0.009849[/C][C]0.1182[/C][C]0.453039[/C][/ROW]
[ROW][C]36[/C][C]-0.042406[/C][C]-0.5089[/C][C]0.305812[/C][/ROW]
[ROW][C]37[/C][C]0.007351[/C][C]0.0882[/C][C]0.464915[/C][/ROW]
[ROW][C]38[/C][C]-0.012378[/C][C]-0.1485[/C][C]0.441063[/C][/ROW]
[ROW][C]39[/C][C]-0.041916[/C][C]-0.503[/C][C]0.307867[/C][/ROW]
[ROW][C]40[/C][C]-0.038781[/C][C]-0.4654[/C][C]0.321184[/C][/ROW]
[ROW][C]41[/C][C]-0.043805[/C][C]-0.5257[/C][C]0.299965[/C][/ROW]
[ROW][C]42[/C][C]0.034789[/C][C]0.4175[/C][C]0.338479[/C][/ROW]
[ROW][C]43[/C][C]0.010338[/C][C]0.1241[/C][C]0.450724[/C][/ROW]
[ROW][C]44[/C][C]-0.028336[/C][C]-0.34[/C][C]0.367165[/C][/ROW]
[ROW][C]45[/C][C]-0.085708[/C][C]-1.0285[/C][C]0.152721[/C][/ROW]
[ROW][C]46[/C][C]-0.04459[/C][C]-0.5351[/C][C]0.296709[/C][/ROW]
[ROW][C]47[/C][C]-0.017685[/C][C]-0.2122[/C][C]0.41612[/C][/ROW]
[ROW][C]48[/C][C]0.122204[/C][C]1.4664[/C][C]0.072354[/C][/ROW]
[/TABLE]
Source: https://freestatistics.org/blog/index.php?pk=75080&T=2

Globally Unique Identifier (entire table): ba.freestatistics.org/blog/index.php?pk=75080&T=2

As an alternative you can also use a QR Code:  

The GUIDs for individual cells are displayed in the table below:

Partial Autocorrelation Function
Time lag kPACF(k)T-STATP-value
10.95403411.44840
20.3644874.37381.2e-05
30.0502640.60320.273672
4-0.020698-0.24840.4021
50.1309631.57160.059124
6-0.03023-0.36280.35866
7-0.013795-0.16550.434376
8-0.031603-0.37920.352534
9-0.041203-0.49440.310876
100.0184430.22130.412578
110.0041560.04990.480144
120.0289290.34710.364494
13-0.049326-0.59190.277419
14-0.097863-1.17440.121095
150.0217540.26110.397213
16-0.062082-0.7450.228747
17-0.058941-0.70730.240265
18-0.06995-0.83940.201318
19-0.006206-0.07450.470371
20-0.042991-0.51590.303361
21-0.010272-0.12330.451034
22-0.010086-0.1210.451917
230.011030.13240.44744
24-0.003542-0.04250.483079
250.0573980.68880.246036
26-0.006646-0.07980.468271
27-0.070583-0.8470.199202
28-0.10019-1.20230.115615
29-0.008945-0.10730.457333
30-0.06468-0.77620.219462
310.0048750.05850.476715
320.0184040.22080.412763
330.0019790.02370.490544
34-0.076748-0.9210.179303
350.0098490.11820.453039
36-0.042406-0.50890.305812
370.0073510.08820.464915
38-0.012378-0.14850.441063
39-0.041916-0.5030.307867
40-0.038781-0.46540.321184
41-0.043805-0.52570.299965
420.0347890.41750.338479
430.0103380.12410.450724
44-0.028336-0.340.367165
45-0.085708-1.02850.152721
46-0.04459-0.53510.296709
47-0.017685-0.21220.41612
480.1222041.46640.072354


Parameters (Session):
par1 = 48 ; par2 = 1 ; par3 = 0 ; par4 = 0 ; par5 = 12 ; par6 = White Noise ; par7 = 0.95 ;
Parameters (R input):
par1 = 48 ; par2 = 1 ; par3 = 0 ; par4 = 0 ; par5 = 12 ; par6 = White Noise ; par7 = 0.95 ;
R code (references can be found in the software module):
if (par1 == 'Default') {
par1 = 10*log10(length(x))
} else {
par1 <- as.numeric(par1)
}
par2 <- as.numeric(par2)
par3 <- as.numeric(par3)
par4 <- as.numeric(par4)
par5 <- as.numeric(par5)
if (par6 == 'White Noise') par6 <- 'white' else par6 <- 'ma'
par7 <- as.numeric(par7)
if (par2 == 0) {
x <- log(x)
} else {
x <- (x ^ par2 - 1) / par2
}
if (par3 > 0) x <- diff(x,lag=1,difference=par3)
if (par4 > 0) x <- diff(x,lag=par5,difference=par4)
bitmap(file='pic1.png')
racf <- acf(x, par1, main='Autocorrelation', xlab='time lag', ylab='ACF', ci.type=par6, ci=par7, sub=paste('(lambda=',par2,', d=',par3,', D=',par4,', CI=', par7, ', CI type=',par6,')',sep=''))
dev.off()
bitmap(file='pic2.png')
rpacf <- pacf(x,par1,main='Partial Autocorrelation',xlab='lags',ylab='PACF')
dev.off()
(myacf <- c(racf$acf))
(mypacf <- c(rpacf$acf))
lengthx <- length(x)
sqrtn <- sqrt(lengthx)
load(file='createtable')
a<-table.start()
a<-table.row.start(a)
a<-table.element(a,'Autocorrelation Function',4,TRUE)
a<-table.row.end(a)
a<-table.row.start(a)
a<-table.element(a,'Time lag k',header=TRUE)
a<-table.element(a,hyperlink('basics.htm','ACF(k)','click here for more information about the Autocorrelation Function'),header=TRUE)
a<-table.element(a,'T-STAT',header=TRUE)
a<-table.element(a,'P-value',header=TRUE)
a<-table.row.end(a)
for (i in 2:(par1+1)) {
a<-table.row.start(a)
a<-table.element(a,i-1,header=TRUE)
a<-table.element(a,round(myacf[i],6))
mytstat <- myacf[i]*sqrtn
a<-table.element(a,round(mytstat,4))
a<-table.element(a,round(1-pt(abs(mytstat),lengthx),6))
a<-table.row.end(a)
}
a<-table.end(a)
table.save(a,file='mytable.tab')
a<-table.start()
a<-table.row.start(a)
a<-table.element(a,'Partial Autocorrelation Function',4,TRUE)
a<-table.row.end(a)
a<-table.row.start(a)
a<-table.element(a,'Time lag k',header=TRUE)
a<-table.element(a,hyperlink('basics.htm','PACF(k)','click here for more information about the Partial Autocorrelation Function'),header=TRUE)
a<-table.element(a,'T-STAT',header=TRUE)
a<-table.element(a,'P-value',header=TRUE)
a<-table.row.end(a)
for (i in 1:par1) {
a<-table.row.start(a)
a<-table.element(a,i,header=TRUE)
a<-table.element(a,round(mypacf[i],6))
mytstat <- mypacf[i]*sqrtn
a<-table.element(a,round(mytstat,4))
a<-table.element(a,round(1-pt(abs(mytstat),lengthx),6))
a<-table.row.end(a)
}
a<-table.end(a)
table.save(a,file='mytable1.tab')