Free Statistics

of Irreproducible Research!

Author's title

Author*Unverified author*
R Software Modulerwasp_autocorrelation.wasp
Title produced by software(Partial) Autocorrelation Function
Date of computationFri, 30 Apr 2010 13:23:49 +0000
Cite this page as followsStatistical Computations at FreeStatistics.org, Office for Research Development and Education, URL https://freestatistics.org/blog/index.php?v=date/2010/Apr/30/t1272633846j0ngj01jff7jv3f.htm/, Retrieved Tue, 23 Apr 2024 06:10:53 +0000
Statistical Computations at FreeStatistics.org, Office for Research Development and Education, URL https://freestatistics.org/blog/index.php?pk=75076, Retrieved Tue, 23 Apr 2024 06:10:53 +0000
QR Codes:

Original text written by user:
IsPrivate?No (this computation is public)
User-defined keywordsKDGP2W21
Estimated Impact213
Family? (F = Feedback message, R = changed R code, M = changed R Module, P = changed Parameters, D = changed Data)
-       [(Partial) Autocorrelation Function] [] [2010-04-30 13:23:49] [d38ec69e6463020b6f9ce85941b20918] [Current]
Feedback Forum

Post a new message
Dataseries X:
562674
599000
668516
597798
579889
668233
499232
215187
555813
586935
546136
571111
634712
639283
712182
621557
621000
675989
501322
220286
560727
602530
626379
605508
646783
658442
712906
687714
723916
707183
629000
237530
613296
730444
734925
651812
676155
748183
810681
729363
701108
790079
594621
230716
617189
691389
701067
705777
747636
773392
813788
766713
728875
749197
680954
241424
680234
708326
694238
772071
795337
788421
889968
797393
751000
821255
691605
290655
727147
868355
812390
799556
843038
847000
941952
804309
840307
871528
656330
370508
742000
847152
731675
898527
778139
856075
938833
813023
783417
828110
657311
310032
780000
860000
780000
807993
895217
856075
893268
875000
835088
934595
832500
300000
791443
900000
781729
880000
875024
992968
976804
968697
871675
1006852
832037
345587
849528
913871
868746
993733


Summary of computational transaction
Raw Inputview raw input (R code)
Raw Outputview raw output of R engine
Computing time3 seconds
R Server'George Udny Yule' @ 72.249.76.132

\begin{tabular}{lllllllll}
\hline
Summary of computational transaction \tabularnewline
Raw Input & view raw input (R code)  \tabularnewline
Raw Output & view raw output of R engine  \tabularnewline
Computing time & 3 seconds \tabularnewline
R Server & 'George Udny Yule' @ 72.249.76.132 \tabularnewline
\hline
\end{tabular}
%Source: https://freestatistics.org/blog/index.php?pk=75076&T=0

[TABLE]
[ROW][C]Summary of computational transaction[/C][/ROW]
[ROW][C]Raw Input[/C][C]view raw input (R code) [/C][/ROW]
[ROW][C]Raw Output[/C][C]view raw output of R engine [/C][/ROW]
[ROW][C]Computing time[/C][C]3 seconds[/C][/ROW]
[ROW][C]R Server[/C][C]'George Udny Yule' @ 72.249.76.132[/C][/ROW]
[/TABLE]
Source: https://freestatistics.org/blog/index.php?pk=75076&T=0

Globally Unique Identifier (entire table): ba.freestatistics.org/blog/index.php?pk=75076&T=0

As an alternative you can also use a QR Code:  

The GUIDs for individual cells are displayed in the table below:

Summary of computational transaction
Raw Inputview raw input (R code)
Raw Outputview raw output of R engine
Computing time3 seconds
R Server'George Udny Yule' @ 72.249.76.132


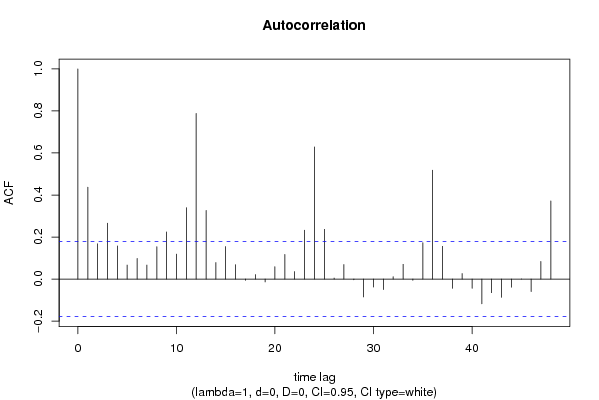
Autocorrelation Function
Time lag kACF(k)T-STATP-value
10.4370234.78732e-06
20.1675061.83490.034496
30.2656572.91010.002154
40.1579331.73010.043095
50.0667190.73090.23314
60.098071.07430.142421
70.0666540.73020.233357
80.1540671.68770.047031
90.2245312.45960.007667
100.1187151.30050.097968
110.3396743.72090.000152
120.7880498.63260
130.3266173.57790.00025
140.0786850.86190.195218
150.1545671.69320.046506
160.0686460.7520.226768
17-0.006055-0.06630.473613
180.0214590.23510.407276
19-0.013941-0.15270.43944
200.0586520.64250.260887
210.1172241.28410.100786
220.0357070.39110.348192
230.2324152.5460.006082
240.6287096.88720
250.236532.59110.005377
260.0046590.0510.479692
270.0689460.75530.225785
28-0.003879-0.04250.483088
29-0.085255-0.93390.176109
30-0.038218-0.41870.338108
31-0.049752-0.5450.293379
320.011490.12590.450024
330.0701850.76880.221751
34-0.006169-0.06760.473118
350.1728771.89380.030332
360.5179455.67380
370.1561461.71050.04488
38-0.04417-0.48390.314683
390.026340.28850.386717
40-0.043895-0.48080.315751
41-0.117862-1.29110.099573
42-0.06494-0.71140.239112
43-0.086706-0.94980.172058
44-0.038836-0.42540.335645
453.8e-054e-040.499832
46-0.059409-0.65080.258214
470.0836760.91660.180589
480.3716814.07164.2e-05

\begin{tabular}{lllllllll}
\hline
Autocorrelation Function \tabularnewline
Time lag k & ACF(k) & T-STAT & P-value \tabularnewline
1 & 0.437023 & 4.7873 & 2e-06 \tabularnewline
2 & 0.167506 & 1.8349 & 0.034496 \tabularnewline
3 & 0.265657 & 2.9101 & 0.002154 \tabularnewline
4 & 0.157933 & 1.7301 & 0.043095 \tabularnewline
5 & 0.066719 & 0.7309 & 0.23314 \tabularnewline
6 & 0.09807 & 1.0743 & 0.142421 \tabularnewline
7 & 0.066654 & 0.7302 & 0.233357 \tabularnewline
8 & 0.154067 & 1.6877 & 0.047031 \tabularnewline
9 & 0.224531 & 2.4596 & 0.007667 \tabularnewline
10 & 0.118715 & 1.3005 & 0.097968 \tabularnewline
11 & 0.339674 & 3.7209 & 0.000152 \tabularnewline
12 & 0.788049 & 8.6326 & 0 \tabularnewline
13 & 0.326617 & 3.5779 & 0.00025 \tabularnewline
14 & 0.078685 & 0.8619 & 0.195218 \tabularnewline
15 & 0.154567 & 1.6932 & 0.046506 \tabularnewline
16 & 0.068646 & 0.752 & 0.226768 \tabularnewline
17 & -0.006055 & -0.0663 & 0.473613 \tabularnewline
18 & 0.021459 & 0.2351 & 0.407276 \tabularnewline
19 & -0.013941 & -0.1527 & 0.43944 \tabularnewline
20 & 0.058652 & 0.6425 & 0.260887 \tabularnewline
21 & 0.117224 & 1.2841 & 0.100786 \tabularnewline
22 & 0.035707 & 0.3911 & 0.348192 \tabularnewline
23 & 0.232415 & 2.546 & 0.006082 \tabularnewline
24 & 0.628709 & 6.8872 & 0 \tabularnewline
25 & 0.23653 & 2.5911 & 0.005377 \tabularnewline
26 & 0.004659 & 0.051 & 0.479692 \tabularnewline
27 & 0.068946 & 0.7553 & 0.225785 \tabularnewline
28 & -0.003879 & -0.0425 & 0.483088 \tabularnewline
29 & -0.085255 & -0.9339 & 0.176109 \tabularnewline
30 & -0.038218 & -0.4187 & 0.338108 \tabularnewline
31 & -0.049752 & -0.545 & 0.293379 \tabularnewline
32 & 0.01149 & 0.1259 & 0.450024 \tabularnewline
33 & 0.070185 & 0.7688 & 0.221751 \tabularnewline
34 & -0.006169 & -0.0676 & 0.473118 \tabularnewline
35 & 0.172877 & 1.8938 & 0.030332 \tabularnewline
36 & 0.517945 & 5.6738 & 0 \tabularnewline
37 & 0.156146 & 1.7105 & 0.04488 \tabularnewline
38 & -0.04417 & -0.4839 & 0.314683 \tabularnewline
39 & 0.02634 & 0.2885 & 0.386717 \tabularnewline
40 & -0.043895 & -0.4808 & 0.315751 \tabularnewline
41 & -0.117862 & -1.2911 & 0.099573 \tabularnewline
42 & -0.06494 & -0.7114 & 0.239112 \tabularnewline
43 & -0.086706 & -0.9498 & 0.172058 \tabularnewline
44 & -0.038836 & -0.4254 & 0.335645 \tabularnewline
45 & 3.8e-05 & 4e-04 & 0.499832 \tabularnewline
46 & -0.059409 & -0.6508 & 0.258214 \tabularnewline
47 & 0.083676 & 0.9166 & 0.180589 \tabularnewline
48 & 0.371681 & 4.0716 & 4.2e-05 \tabularnewline
\hline
\end{tabular}
%Source: https://freestatistics.org/blog/index.php?pk=75076&T=1

[TABLE]
[ROW][C]Autocorrelation Function[/C][/ROW]
[ROW][C]Time lag k[/C][C]ACF(k)[/C][C]T-STAT[/C][C]P-value[/C][/ROW]
[ROW][C]1[/C][C]0.437023[/C][C]4.7873[/C][C]2e-06[/C][/ROW]
[ROW][C]2[/C][C]0.167506[/C][C]1.8349[/C][C]0.034496[/C][/ROW]
[ROW][C]3[/C][C]0.265657[/C][C]2.9101[/C][C]0.002154[/C][/ROW]
[ROW][C]4[/C][C]0.157933[/C][C]1.7301[/C][C]0.043095[/C][/ROW]
[ROW][C]5[/C][C]0.066719[/C][C]0.7309[/C][C]0.23314[/C][/ROW]
[ROW][C]6[/C][C]0.09807[/C][C]1.0743[/C][C]0.142421[/C][/ROW]
[ROW][C]7[/C][C]0.066654[/C][C]0.7302[/C][C]0.233357[/C][/ROW]
[ROW][C]8[/C][C]0.154067[/C][C]1.6877[/C][C]0.047031[/C][/ROW]
[ROW][C]9[/C][C]0.224531[/C][C]2.4596[/C][C]0.007667[/C][/ROW]
[ROW][C]10[/C][C]0.118715[/C][C]1.3005[/C][C]0.097968[/C][/ROW]
[ROW][C]11[/C][C]0.339674[/C][C]3.7209[/C][C]0.000152[/C][/ROW]
[ROW][C]12[/C][C]0.788049[/C][C]8.6326[/C][C]0[/C][/ROW]
[ROW][C]13[/C][C]0.326617[/C][C]3.5779[/C][C]0.00025[/C][/ROW]
[ROW][C]14[/C][C]0.078685[/C][C]0.8619[/C][C]0.195218[/C][/ROW]
[ROW][C]15[/C][C]0.154567[/C][C]1.6932[/C][C]0.046506[/C][/ROW]
[ROW][C]16[/C][C]0.068646[/C][C]0.752[/C][C]0.226768[/C][/ROW]
[ROW][C]17[/C][C]-0.006055[/C][C]-0.0663[/C][C]0.473613[/C][/ROW]
[ROW][C]18[/C][C]0.021459[/C][C]0.2351[/C][C]0.407276[/C][/ROW]
[ROW][C]19[/C][C]-0.013941[/C][C]-0.1527[/C][C]0.43944[/C][/ROW]
[ROW][C]20[/C][C]0.058652[/C][C]0.6425[/C][C]0.260887[/C][/ROW]
[ROW][C]21[/C][C]0.117224[/C][C]1.2841[/C][C]0.100786[/C][/ROW]
[ROW][C]22[/C][C]0.035707[/C][C]0.3911[/C][C]0.348192[/C][/ROW]
[ROW][C]23[/C][C]0.232415[/C][C]2.546[/C][C]0.006082[/C][/ROW]
[ROW][C]24[/C][C]0.628709[/C][C]6.8872[/C][C]0[/C][/ROW]
[ROW][C]25[/C][C]0.23653[/C][C]2.5911[/C][C]0.005377[/C][/ROW]
[ROW][C]26[/C][C]0.004659[/C][C]0.051[/C][C]0.479692[/C][/ROW]
[ROW][C]27[/C][C]0.068946[/C][C]0.7553[/C][C]0.225785[/C][/ROW]
[ROW][C]28[/C][C]-0.003879[/C][C]-0.0425[/C][C]0.483088[/C][/ROW]
[ROW][C]29[/C][C]-0.085255[/C][C]-0.9339[/C][C]0.176109[/C][/ROW]
[ROW][C]30[/C][C]-0.038218[/C][C]-0.4187[/C][C]0.338108[/C][/ROW]
[ROW][C]31[/C][C]-0.049752[/C][C]-0.545[/C][C]0.293379[/C][/ROW]
[ROW][C]32[/C][C]0.01149[/C][C]0.1259[/C][C]0.450024[/C][/ROW]
[ROW][C]33[/C][C]0.070185[/C][C]0.7688[/C][C]0.221751[/C][/ROW]
[ROW][C]34[/C][C]-0.006169[/C][C]-0.0676[/C][C]0.473118[/C][/ROW]
[ROW][C]35[/C][C]0.172877[/C][C]1.8938[/C][C]0.030332[/C][/ROW]
[ROW][C]36[/C][C]0.517945[/C][C]5.6738[/C][C]0[/C][/ROW]
[ROW][C]37[/C][C]0.156146[/C][C]1.7105[/C][C]0.04488[/C][/ROW]
[ROW][C]38[/C][C]-0.04417[/C][C]-0.4839[/C][C]0.314683[/C][/ROW]
[ROW][C]39[/C][C]0.02634[/C][C]0.2885[/C][C]0.386717[/C][/ROW]
[ROW][C]40[/C][C]-0.043895[/C][C]-0.4808[/C][C]0.315751[/C][/ROW]
[ROW][C]41[/C][C]-0.117862[/C][C]-1.2911[/C][C]0.099573[/C][/ROW]
[ROW][C]42[/C][C]-0.06494[/C][C]-0.7114[/C][C]0.239112[/C][/ROW]
[ROW][C]43[/C][C]-0.086706[/C][C]-0.9498[/C][C]0.172058[/C][/ROW]
[ROW][C]44[/C][C]-0.038836[/C][C]-0.4254[/C][C]0.335645[/C][/ROW]
[ROW][C]45[/C][C]3.8e-05[/C][C]4e-04[/C][C]0.499832[/C][/ROW]
[ROW][C]46[/C][C]-0.059409[/C][C]-0.6508[/C][C]0.258214[/C][/ROW]
[ROW][C]47[/C][C]0.083676[/C][C]0.9166[/C][C]0.180589[/C][/ROW]
[ROW][C]48[/C][C]0.371681[/C][C]4.0716[/C][C]4.2e-05[/C][/ROW]
[/TABLE]
Source: https://freestatistics.org/blog/index.php?pk=75076&T=1

Globally Unique Identifier (entire table): ba.freestatistics.org/blog/index.php?pk=75076&T=1

As an alternative you can also use a QR Code:  

The GUIDs for individual cells are displayed in the table below:

Autocorrelation Function
Time lag kACF(k)T-STATP-value
10.4370234.78732e-06
20.1675061.83490.034496
30.2656572.91010.002154
40.1579331.73010.043095
50.0667190.73090.23314
60.098071.07430.142421
70.0666540.73020.233357
80.1540671.68770.047031
90.2245312.45960.007667
100.1187151.30050.097968
110.3396743.72090.000152
120.7880498.63260
130.3266173.57790.00025
140.0786850.86190.195218
150.1545671.69320.046506
160.0686460.7520.226768
17-0.006055-0.06630.473613
180.0214590.23510.407276
19-0.013941-0.15270.43944
200.0586520.64250.260887
210.1172241.28410.100786
220.0357070.39110.348192
230.2324152.5460.006082
240.6287096.88720
250.236532.59110.005377
260.0046590.0510.479692
270.0689460.75530.225785
28-0.003879-0.04250.483088
29-0.085255-0.93390.176109
30-0.038218-0.41870.338108
31-0.049752-0.5450.293379
320.011490.12590.450024
330.0701850.76880.221751
34-0.006169-0.06760.473118
350.1728771.89380.030332
360.5179455.67380
370.1561461.71050.04488
38-0.04417-0.48390.314683
390.026340.28850.386717
40-0.043895-0.48080.315751
41-0.117862-1.29110.099573
42-0.06494-0.71140.239112
43-0.086706-0.94980.172058
44-0.038836-0.42540.335645
453.8e-054e-040.499832
46-0.059409-0.65080.258214
470.0836760.91660.180589
480.3716814.07164.2e-05


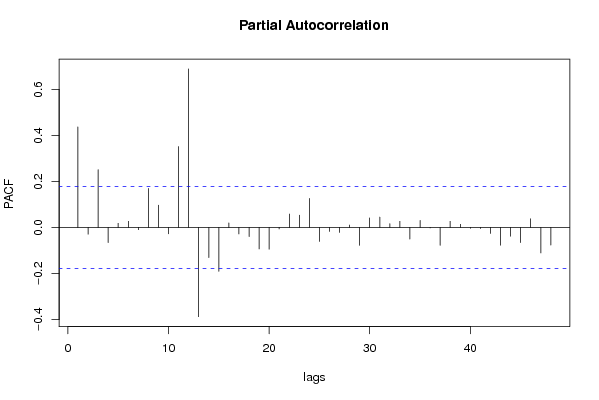
Partial Autocorrelation Function
Time lag kPACF(k)T-STATP-value
10.4370234.78732e-06
2-0.029027-0.3180.375527
30.2511522.75120.003429
4-0.065295-0.71530.237917
50.0180350.19760.421859
60.0268040.29360.384777
7-0.009629-0.10550.458087
80.1695551.85740.032855
90.0971451.06420.144693
10-0.027308-0.29910.382675
110.351383.84929.6e-05
120.6886447.54370
13-0.387259-4.24222.2e-05
14-0.13079-1.43270.077268
15-0.190576-2.08770.019472
160.0196060.21480.415154
17-0.028042-0.30720.379616
18-0.03943-0.43190.333282
19-0.092959-1.01830.155289
20-0.094482-1.0350.151375
21-0.006278-0.06880.472642
220.0583460.63910.261973
230.0533980.58490.279842
240.1264641.38530.084258
25-0.060743-0.66540.253533
26-0.016916-0.18530.426652
27-0.021455-0.2350.407294
280.0106250.11640.453769
29-0.077318-0.8470.199346
300.0412840.45220.325956
310.0450670.49370.311215
320.0163650.17930.429012
330.0270360.29620.383807
34-0.050011-0.54780.29241
350.0307070.33640.368585
36-0.001684-0.01850.492655
37-0.077585-0.84990.198535
380.0268950.29460.384396
390.0140610.1540.438922
40-0.003735-0.04090.483714
41-0.004537-0.04970.480223
42-0.025812-0.28280.388924
43-0.076837-0.84170.200812
44-0.03782-0.41430.3397
45-0.065552-0.71810.237051
460.0377370.41340.340029
47-0.110336-1.20870.114582
48-0.076389-0.83680.202186

\begin{tabular}{lllllllll}
\hline
Partial Autocorrelation Function \tabularnewline
Time lag k & PACF(k) & T-STAT & P-value \tabularnewline
1 & 0.437023 & 4.7873 & 2e-06 \tabularnewline
2 & -0.029027 & -0.318 & 0.375527 \tabularnewline
3 & 0.251152 & 2.7512 & 0.003429 \tabularnewline
4 & -0.065295 & -0.7153 & 0.237917 \tabularnewline
5 & 0.018035 & 0.1976 & 0.421859 \tabularnewline
6 & 0.026804 & 0.2936 & 0.384777 \tabularnewline
7 & -0.009629 & -0.1055 & 0.458087 \tabularnewline
8 & 0.169555 & 1.8574 & 0.032855 \tabularnewline
9 & 0.097145 & 1.0642 & 0.144693 \tabularnewline
10 & -0.027308 & -0.2991 & 0.382675 \tabularnewline
11 & 0.35138 & 3.8492 & 9.6e-05 \tabularnewline
12 & 0.688644 & 7.5437 & 0 \tabularnewline
13 & -0.387259 & -4.2422 & 2.2e-05 \tabularnewline
14 & -0.13079 & -1.4327 & 0.077268 \tabularnewline
15 & -0.190576 & -2.0877 & 0.019472 \tabularnewline
16 & 0.019606 & 0.2148 & 0.415154 \tabularnewline
17 & -0.028042 & -0.3072 & 0.379616 \tabularnewline
18 & -0.03943 & -0.4319 & 0.333282 \tabularnewline
19 & -0.092959 & -1.0183 & 0.155289 \tabularnewline
20 & -0.094482 & -1.035 & 0.151375 \tabularnewline
21 & -0.006278 & -0.0688 & 0.472642 \tabularnewline
22 & 0.058346 & 0.6391 & 0.261973 \tabularnewline
23 & 0.053398 & 0.5849 & 0.279842 \tabularnewline
24 & 0.126464 & 1.3853 & 0.084258 \tabularnewline
25 & -0.060743 & -0.6654 & 0.253533 \tabularnewline
26 & -0.016916 & -0.1853 & 0.426652 \tabularnewline
27 & -0.021455 & -0.235 & 0.407294 \tabularnewline
28 & 0.010625 & 0.1164 & 0.453769 \tabularnewline
29 & -0.077318 & -0.847 & 0.199346 \tabularnewline
30 & 0.041284 & 0.4522 & 0.325956 \tabularnewline
31 & 0.045067 & 0.4937 & 0.311215 \tabularnewline
32 & 0.016365 & 0.1793 & 0.429012 \tabularnewline
33 & 0.027036 & 0.2962 & 0.383807 \tabularnewline
34 & -0.050011 & -0.5478 & 0.29241 \tabularnewline
35 & 0.030707 & 0.3364 & 0.368585 \tabularnewline
36 & -0.001684 & -0.0185 & 0.492655 \tabularnewline
37 & -0.077585 & -0.8499 & 0.198535 \tabularnewline
38 & 0.026895 & 0.2946 & 0.384396 \tabularnewline
39 & 0.014061 & 0.154 & 0.438922 \tabularnewline
40 & -0.003735 & -0.0409 & 0.483714 \tabularnewline
41 & -0.004537 & -0.0497 & 0.480223 \tabularnewline
42 & -0.025812 & -0.2828 & 0.388924 \tabularnewline
43 & -0.076837 & -0.8417 & 0.200812 \tabularnewline
44 & -0.03782 & -0.4143 & 0.3397 \tabularnewline
45 & -0.065552 & -0.7181 & 0.237051 \tabularnewline
46 & 0.037737 & 0.4134 & 0.340029 \tabularnewline
47 & -0.110336 & -1.2087 & 0.114582 \tabularnewline
48 & -0.076389 & -0.8368 & 0.202186 \tabularnewline
\hline
\end{tabular}
%Source: https://freestatistics.org/blog/index.php?pk=75076&T=2

[TABLE]
[ROW][C]Partial Autocorrelation Function[/C][/ROW]
[ROW][C]Time lag k[/C][C]PACF(k)[/C][C]T-STAT[/C][C]P-value[/C][/ROW]
[ROW][C]1[/C][C]0.437023[/C][C]4.7873[/C][C]2e-06[/C][/ROW]
[ROW][C]2[/C][C]-0.029027[/C][C]-0.318[/C][C]0.375527[/C][/ROW]
[ROW][C]3[/C][C]0.251152[/C][C]2.7512[/C][C]0.003429[/C][/ROW]
[ROW][C]4[/C][C]-0.065295[/C][C]-0.7153[/C][C]0.237917[/C][/ROW]
[ROW][C]5[/C][C]0.018035[/C][C]0.1976[/C][C]0.421859[/C][/ROW]
[ROW][C]6[/C][C]0.026804[/C][C]0.2936[/C][C]0.384777[/C][/ROW]
[ROW][C]7[/C][C]-0.009629[/C][C]-0.1055[/C][C]0.458087[/C][/ROW]
[ROW][C]8[/C][C]0.169555[/C][C]1.8574[/C][C]0.032855[/C][/ROW]
[ROW][C]9[/C][C]0.097145[/C][C]1.0642[/C][C]0.144693[/C][/ROW]
[ROW][C]10[/C][C]-0.027308[/C][C]-0.2991[/C][C]0.382675[/C][/ROW]
[ROW][C]11[/C][C]0.35138[/C][C]3.8492[/C][C]9.6e-05[/C][/ROW]
[ROW][C]12[/C][C]0.688644[/C][C]7.5437[/C][C]0[/C][/ROW]
[ROW][C]13[/C][C]-0.387259[/C][C]-4.2422[/C][C]2.2e-05[/C][/ROW]
[ROW][C]14[/C][C]-0.13079[/C][C]-1.4327[/C][C]0.077268[/C][/ROW]
[ROW][C]15[/C][C]-0.190576[/C][C]-2.0877[/C][C]0.019472[/C][/ROW]
[ROW][C]16[/C][C]0.019606[/C][C]0.2148[/C][C]0.415154[/C][/ROW]
[ROW][C]17[/C][C]-0.028042[/C][C]-0.3072[/C][C]0.379616[/C][/ROW]
[ROW][C]18[/C][C]-0.03943[/C][C]-0.4319[/C][C]0.333282[/C][/ROW]
[ROW][C]19[/C][C]-0.092959[/C][C]-1.0183[/C][C]0.155289[/C][/ROW]
[ROW][C]20[/C][C]-0.094482[/C][C]-1.035[/C][C]0.151375[/C][/ROW]
[ROW][C]21[/C][C]-0.006278[/C][C]-0.0688[/C][C]0.472642[/C][/ROW]
[ROW][C]22[/C][C]0.058346[/C][C]0.6391[/C][C]0.261973[/C][/ROW]
[ROW][C]23[/C][C]0.053398[/C][C]0.5849[/C][C]0.279842[/C][/ROW]
[ROW][C]24[/C][C]0.126464[/C][C]1.3853[/C][C]0.084258[/C][/ROW]
[ROW][C]25[/C][C]-0.060743[/C][C]-0.6654[/C][C]0.253533[/C][/ROW]
[ROW][C]26[/C][C]-0.016916[/C][C]-0.1853[/C][C]0.426652[/C][/ROW]
[ROW][C]27[/C][C]-0.021455[/C][C]-0.235[/C][C]0.407294[/C][/ROW]
[ROW][C]28[/C][C]0.010625[/C][C]0.1164[/C][C]0.453769[/C][/ROW]
[ROW][C]29[/C][C]-0.077318[/C][C]-0.847[/C][C]0.199346[/C][/ROW]
[ROW][C]30[/C][C]0.041284[/C][C]0.4522[/C][C]0.325956[/C][/ROW]
[ROW][C]31[/C][C]0.045067[/C][C]0.4937[/C][C]0.311215[/C][/ROW]
[ROW][C]32[/C][C]0.016365[/C][C]0.1793[/C][C]0.429012[/C][/ROW]
[ROW][C]33[/C][C]0.027036[/C][C]0.2962[/C][C]0.383807[/C][/ROW]
[ROW][C]34[/C][C]-0.050011[/C][C]-0.5478[/C][C]0.29241[/C][/ROW]
[ROW][C]35[/C][C]0.030707[/C][C]0.3364[/C][C]0.368585[/C][/ROW]
[ROW][C]36[/C][C]-0.001684[/C][C]-0.0185[/C][C]0.492655[/C][/ROW]
[ROW][C]37[/C][C]-0.077585[/C][C]-0.8499[/C][C]0.198535[/C][/ROW]
[ROW][C]38[/C][C]0.026895[/C][C]0.2946[/C][C]0.384396[/C][/ROW]
[ROW][C]39[/C][C]0.014061[/C][C]0.154[/C][C]0.438922[/C][/ROW]
[ROW][C]40[/C][C]-0.003735[/C][C]-0.0409[/C][C]0.483714[/C][/ROW]
[ROW][C]41[/C][C]-0.004537[/C][C]-0.0497[/C][C]0.480223[/C][/ROW]
[ROW][C]42[/C][C]-0.025812[/C][C]-0.2828[/C][C]0.388924[/C][/ROW]
[ROW][C]43[/C][C]-0.076837[/C][C]-0.8417[/C][C]0.200812[/C][/ROW]
[ROW][C]44[/C][C]-0.03782[/C][C]-0.4143[/C][C]0.3397[/C][/ROW]
[ROW][C]45[/C][C]-0.065552[/C][C]-0.7181[/C][C]0.237051[/C][/ROW]
[ROW][C]46[/C][C]0.037737[/C][C]0.4134[/C][C]0.340029[/C][/ROW]
[ROW][C]47[/C][C]-0.110336[/C][C]-1.2087[/C][C]0.114582[/C][/ROW]
[ROW][C]48[/C][C]-0.076389[/C][C]-0.8368[/C][C]0.202186[/C][/ROW]
[/TABLE]
Source: https://freestatistics.org/blog/index.php?pk=75076&T=2

Globally Unique Identifier (entire table): ba.freestatistics.org/blog/index.php?pk=75076&T=2

As an alternative you can also use a QR Code:  

The GUIDs for individual cells are displayed in the table below:

Partial Autocorrelation Function
Time lag kPACF(k)T-STATP-value
10.4370234.78732e-06
2-0.029027-0.3180.375527
30.2511522.75120.003429
4-0.065295-0.71530.237917
50.0180350.19760.421859
60.0268040.29360.384777
7-0.009629-0.10550.458087
80.1695551.85740.032855
90.0971451.06420.144693
10-0.027308-0.29910.382675
110.351383.84929.6e-05
120.6886447.54370
13-0.387259-4.24222.2e-05
14-0.13079-1.43270.077268
15-0.190576-2.08770.019472
160.0196060.21480.415154
17-0.028042-0.30720.379616
18-0.03943-0.43190.333282
19-0.092959-1.01830.155289
20-0.094482-1.0350.151375
21-0.006278-0.06880.472642
220.0583460.63910.261973
230.0533980.58490.279842
240.1264641.38530.084258
25-0.060743-0.66540.253533
26-0.016916-0.18530.426652
27-0.021455-0.2350.407294
280.0106250.11640.453769
29-0.077318-0.8470.199346
300.0412840.45220.325956
310.0450670.49370.311215
320.0163650.17930.429012
330.0270360.29620.383807
34-0.050011-0.54780.29241
350.0307070.33640.368585
36-0.001684-0.01850.492655
37-0.077585-0.84990.198535
380.0268950.29460.384396
390.0140610.1540.438922
40-0.003735-0.04090.483714
41-0.004537-0.04970.480223
42-0.025812-0.28280.388924
43-0.076837-0.84170.200812
44-0.03782-0.41430.3397
45-0.065552-0.71810.237051
460.0377370.41340.340029
47-0.110336-1.20870.114582
48-0.076389-0.83680.202186


Parameters (Session):
par1 = 48 ; par2 = 1 ; par3 = 0 ; par4 = 0 ; par5 = 12 ; par6 = White Noise ; par7 = 0.95 ;
Parameters (R input):
par1 = 48 ; par2 = 1 ; par3 = 0 ; par4 = 0 ; par5 = 12 ; par6 = White Noise ; par7 = 0.95 ;
R code (references can be found in the software module):
if (par1 == 'Default') {
par1 = 10*log10(length(x))
} else {
par1 <- as.numeric(par1)
}
par2 <- as.numeric(par2)
par3 <- as.numeric(par3)
par4 <- as.numeric(par4)
par5 <- as.numeric(par5)
if (par6 == 'White Noise') par6 <- 'white' else par6 <- 'ma'
par7 <- as.numeric(par7)
if (par2 == 0) {
x <- log(x)
} else {
x <- (x ^ par2 - 1) / par2
}
if (par3 > 0) x <- diff(x,lag=1,difference=par3)
if (par4 > 0) x <- diff(x,lag=par5,difference=par4)
bitmap(file='pic1.png')
racf <- acf(x, par1, main='Autocorrelation', xlab='time lag', ylab='ACF', ci.type=par6, ci=par7, sub=paste('(lambda=',par2,', d=',par3,', D=',par4,', CI=', par7, ', CI type=',par6,')',sep=''))
dev.off()
bitmap(file='pic2.png')
rpacf <- pacf(x,par1,main='Partial Autocorrelation',xlab='lags',ylab='PACF')
dev.off()
(myacf <- c(racf$acf))
(mypacf <- c(rpacf$acf))
lengthx <- length(x)
sqrtn <- sqrt(lengthx)
load(file='createtable')
a<-table.start()
a<-table.row.start(a)
a<-table.element(a,'Autocorrelation Function',4,TRUE)
a<-table.row.end(a)
a<-table.row.start(a)
a<-table.element(a,'Time lag k',header=TRUE)
a<-table.element(a,hyperlink('basics.htm','ACF(k)','click here for more information about the Autocorrelation Function'),header=TRUE)
a<-table.element(a,'T-STAT',header=TRUE)
a<-table.element(a,'P-value',header=TRUE)
a<-table.row.end(a)
for (i in 2:(par1+1)) {
a<-table.row.start(a)
a<-table.element(a,i-1,header=TRUE)
a<-table.element(a,round(myacf[i],6))
mytstat <- myacf[i]*sqrtn
a<-table.element(a,round(mytstat,4))
a<-table.element(a,round(1-pt(abs(mytstat),lengthx),6))
a<-table.row.end(a)
}
a<-table.end(a)
table.save(a,file='mytable.tab')
a<-table.start()
a<-table.row.start(a)
a<-table.element(a,'Partial Autocorrelation Function',4,TRUE)
a<-table.row.end(a)
a<-table.row.start(a)
a<-table.element(a,'Time lag k',header=TRUE)
a<-table.element(a,hyperlink('basics.htm','PACF(k)','click here for more information about the Partial Autocorrelation Function'),header=TRUE)
a<-table.element(a,'T-STAT',header=TRUE)
a<-table.element(a,'P-value',header=TRUE)
a<-table.row.end(a)
for (i in 1:par1) {
a<-table.row.start(a)
a<-table.element(a,i,header=TRUE)
a<-table.element(a,round(mypacf[i],6))
mytstat <- mypacf[i]*sqrtn
a<-table.element(a,round(mytstat,4))
a<-table.element(a,round(1-pt(abs(mytstat),lengthx),6))
a<-table.row.end(a)
}
a<-table.end(a)
table.save(a,file='mytable1.tab')