Free Statistics

of Irreproducible Research!

Author's title

Author*Unverified author*
R Software Modulerwasp_autocorrelation.wasp
Title produced by software(Partial) Autocorrelation Function
Date of computationFri, 30 Apr 2010 12:33:59 +0000
Cite this page as followsStatistical Computations at FreeStatistics.org, Office for Research Development and Education, URL https://freestatistics.org/blog/index.php?v=date/2010/Apr/30/t12726309400av9ze65fobuwow.htm/, Retrieved Tue, 23 Apr 2024 19:35:53 +0000
Statistical Computations at FreeStatistics.org, Office for Research Development and Education, URL https://freestatistics.org/blog/index.php?pk=75071, Retrieved Tue, 23 Apr 2024 19:35:53 +0000
QR Codes:

Original text written by user:
IsPrivate?No (this computation is public)
User-defined keywordsKDGP2W21
Estimated Impact225
Family? (F = Feedback message, R = changed R code, M = changed R Module, P = changed Parameters, D = changed Data)
-       [(Partial) Autocorrelation Function] [] [2010-04-30 12:33:59] [64b736d20c8e0a8542a5a7c9128a9b74] [Current]
Feedback Forum

Post a new message
Dataseries X:
182900
191400
189300
192200
187900
193900
189100
193100
194800
200200
211500
202100
200300
199200
204900
207300
200000
197700
202200
200200
208300
215100
210700
208100
209000
211000
210200
205500
211400
211700
209300
207500
203300
207100
206900
228700
226900
226500
227100
228100
226500
225200
217800
221300
215300
231300
227100
237800
230200
233400
231100
237200
243700
239700
248400
241000
254500
242800
268300
253900
262100
264100
261000
269300
260400
263200
279200
272200
269200
289600
283200
284300
283000
289100
289600
289100
287400
279600
289300
295000
299600
293600
294400
290200
301000
307900
298800
310300
293900
305000
311300
317300
296200
306800
291800
301900
314600
321500
329400
311700
309700
306500
307100
301300
292200
310100
316800
284400
284600
301200
287600
314300
298200
299400
301900
265500
287100
274000
290100
263100
245200
258600
259800
269800
274600
274800
271100
257800
290300
262200
270000
290600


Summary of computational transaction
Raw Inputview raw input (R code)
Raw Outputview raw output of R engine
Computing time1 seconds
R Server'Gwilym Jenkins' @ 72.249.127.135

\begin{tabular}{lllllllll}
\hline
Summary of computational transaction \tabularnewline
Raw Input & view raw input (R code)  \tabularnewline
Raw Output & view raw output of R engine  \tabularnewline
Computing time & 1 seconds \tabularnewline
R Server & 'Gwilym Jenkins' @ 72.249.127.135 \tabularnewline
\hline
\end{tabular}
%Source: https://freestatistics.org/blog/index.php?pk=75071&T=0

[TABLE]
[ROW][C]Summary of computational transaction[/C][/ROW]
[ROW][C]Raw Input[/C][C]view raw input (R code) [/C][/ROW]
[ROW][C]Raw Output[/C][C]view raw output of R engine [/C][/ROW]
[ROW][C]Computing time[/C][C]1 seconds[/C][/ROW]
[ROW][C]R Server[/C][C]'Gwilym Jenkins' @ 72.249.127.135[/C][/ROW]
[/TABLE]
Source: https://freestatistics.org/blog/index.php?pk=75071&T=0

Globally Unique Identifier (entire table): ba.freestatistics.org/blog/index.php?pk=75071&T=0

As an alternative you can also use a QR Code:  

The GUIDs for individual cells are displayed in the table below:

Summary of computational transaction
Raw Inputview raw input (R code)
Raw Outputview raw output of R engine
Computing time1 seconds
R Server'Gwilym Jenkins' @ 72.249.127.135


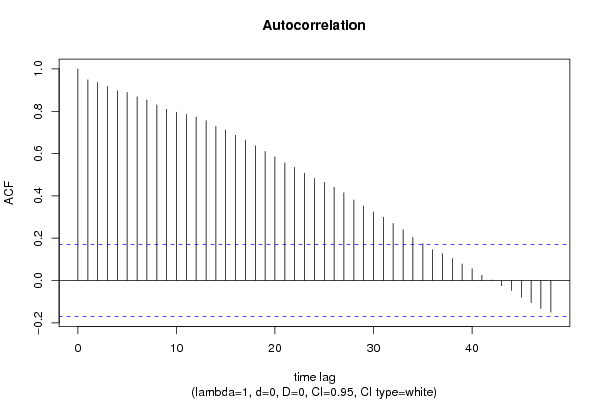
Autocorrelation Function
Time lag kACF(k)T-STATP-value
10.94882510.90120
20.93588110.75250
30.91683810.53370
40.8968310.30380
50.88881110.21170
60.8682549.97550
70.8538129.80950
80.8298079.53380
90.8093149.29830
100.7954519.1390
110.7846449.01490
120.7733378.8850
130.7553768.67860
140.7284328.36910
150.7118698.17880
160.6866477.8890
170.663717.62540
180.6365997.3140
190.6101397.010
200.5853256.72490
210.5562636.3910
220.534416.13990
230.506725.82180
240.4824575.5430
250.4644785.33650
260.4406855.06311e-06
270.4143854.76092e-06
280.3812214.37991.2e-05
290.3524984.04994.3e-05
300.3241443.72410.000145
310.2994243.44010.000389
320.2697113.09870.001188
330.2406352.76470.003257
340.2035682.33880.010423
350.1741862.00120.023709
360.1456651.67360.048292
370.1268671.45760.073665
380.1037841.19240.117623
390.0783120.89970.184948
400.0556730.63960.261759
410.0250430.28770.387007
420.0022690.02610.489623
43-0.024095-0.27680.391171
44-0.046601-0.53540.296635
45-0.078844-0.90590.183332
46-0.104147-1.19660.116811
47-0.131726-1.51340.066282
48-0.149226-1.71450.044394

\begin{tabular}{lllllllll}
\hline
Autocorrelation Function \tabularnewline
Time lag k & ACF(k) & T-STAT & P-value \tabularnewline
1 & 0.948825 & 10.9012 & 0 \tabularnewline
2 & 0.935881 & 10.7525 & 0 \tabularnewline
3 & 0.916838 & 10.5337 & 0 \tabularnewline
4 & 0.89683 & 10.3038 & 0 \tabularnewline
5 & 0.888811 & 10.2117 & 0 \tabularnewline
6 & 0.868254 & 9.9755 & 0 \tabularnewline
7 & 0.853812 & 9.8095 & 0 \tabularnewline
8 & 0.829807 & 9.5338 & 0 \tabularnewline
9 & 0.809314 & 9.2983 & 0 \tabularnewline
10 & 0.795451 & 9.139 & 0 \tabularnewline
11 & 0.784644 & 9.0149 & 0 \tabularnewline
12 & 0.773337 & 8.885 & 0 \tabularnewline
13 & 0.755376 & 8.6786 & 0 \tabularnewline
14 & 0.728432 & 8.3691 & 0 \tabularnewline
15 & 0.711869 & 8.1788 & 0 \tabularnewline
16 & 0.686647 & 7.889 & 0 \tabularnewline
17 & 0.66371 & 7.6254 & 0 \tabularnewline
18 & 0.636599 & 7.314 & 0 \tabularnewline
19 & 0.610139 & 7.01 & 0 \tabularnewline
20 & 0.585325 & 6.7249 & 0 \tabularnewline
21 & 0.556263 & 6.391 & 0 \tabularnewline
22 & 0.53441 & 6.1399 & 0 \tabularnewline
23 & 0.50672 & 5.8218 & 0 \tabularnewline
24 & 0.482457 & 5.543 & 0 \tabularnewline
25 & 0.464478 & 5.3365 & 0 \tabularnewline
26 & 0.440685 & 5.0631 & 1e-06 \tabularnewline
27 & 0.414385 & 4.7609 & 2e-06 \tabularnewline
28 & 0.381221 & 4.3799 & 1.2e-05 \tabularnewline
29 & 0.352498 & 4.0499 & 4.3e-05 \tabularnewline
30 & 0.324144 & 3.7241 & 0.000145 \tabularnewline
31 & 0.299424 & 3.4401 & 0.000389 \tabularnewline
32 & 0.269711 & 3.0987 & 0.001188 \tabularnewline
33 & 0.240635 & 2.7647 & 0.003257 \tabularnewline
34 & 0.203568 & 2.3388 & 0.010423 \tabularnewline
35 & 0.174186 & 2.0012 & 0.023709 \tabularnewline
36 & 0.145665 & 1.6736 & 0.048292 \tabularnewline
37 & 0.126867 & 1.4576 & 0.073665 \tabularnewline
38 & 0.103784 & 1.1924 & 0.117623 \tabularnewline
39 & 0.078312 & 0.8997 & 0.184948 \tabularnewline
40 & 0.055673 & 0.6396 & 0.261759 \tabularnewline
41 & 0.025043 & 0.2877 & 0.387007 \tabularnewline
42 & 0.002269 & 0.0261 & 0.489623 \tabularnewline
43 & -0.024095 & -0.2768 & 0.391171 \tabularnewline
44 & -0.046601 & -0.5354 & 0.296635 \tabularnewline
45 & -0.078844 & -0.9059 & 0.183332 \tabularnewline
46 & -0.104147 & -1.1966 & 0.116811 \tabularnewline
47 & -0.131726 & -1.5134 & 0.066282 \tabularnewline
48 & -0.149226 & -1.7145 & 0.044394 \tabularnewline
\hline
\end{tabular}
%Source: https://freestatistics.org/blog/index.php?pk=75071&T=1

[TABLE]
[ROW][C]Autocorrelation Function[/C][/ROW]
[ROW][C]Time lag k[/C][C]ACF(k)[/C][C]T-STAT[/C][C]P-value[/C][/ROW]
[ROW][C]1[/C][C]0.948825[/C][C]10.9012[/C][C]0[/C][/ROW]
[ROW][C]2[/C][C]0.935881[/C][C]10.7525[/C][C]0[/C][/ROW]
[ROW][C]3[/C][C]0.916838[/C][C]10.5337[/C][C]0[/C][/ROW]
[ROW][C]4[/C][C]0.89683[/C][C]10.3038[/C][C]0[/C][/ROW]
[ROW][C]5[/C][C]0.888811[/C][C]10.2117[/C][C]0[/C][/ROW]
[ROW][C]6[/C][C]0.868254[/C][C]9.9755[/C][C]0[/C][/ROW]
[ROW][C]7[/C][C]0.853812[/C][C]9.8095[/C][C]0[/C][/ROW]
[ROW][C]8[/C][C]0.829807[/C][C]9.5338[/C][C]0[/C][/ROW]
[ROW][C]9[/C][C]0.809314[/C][C]9.2983[/C][C]0[/C][/ROW]
[ROW][C]10[/C][C]0.795451[/C][C]9.139[/C][C]0[/C][/ROW]
[ROW][C]11[/C][C]0.784644[/C][C]9.0149[/C][C]0[/C][/ROW]
[ROW][C]12[/C][C]0.773337[/C][C]8.885[/C][C]0[/C][/ROW]
[ROW][C]13[/C][C]0.755376[/C][C]8.6786[/C][C]0[/C][/ROW]
[ROW][C]14[/C][C]0.728432[/C][C]8.3691[/C][C]0[/C][/ROW]
[ROW][C]15[/C][C]0.711869[/C][C]8.1788[/C][C]0[/C][/ROW]
[ROW][C]16[/C][C]0.686647[/C][C]7.889[/C][C]0[/C][/ROW]
[ROW][C]17[/C][C]0.66371[/C][C]7.6254[/C][C]0[/C][/ROW]
[ROW][C]18[/C][C]0.636599[/C][C]7.314[/C][C]0[/C][/ROW]
[ROW][C]19[/C][C]0.610139[/C][C]7.01[/C][C]0[/C][/ROW]
[ROW][C]20[/C][C]0.585325[/C][C]6.7249[/C][C]0[/C][/ROW]
[ROW][C]21[/C][C]0.556263[/C][C]6.391[/C][C]0[/C][/ROW]
[ROW][C]22[/C][C]0.53441[/C][C]6.1399[/C][C]0[/C][/ROW]
[ROW][C]23[/C][C]0.50672[/C][C]5.8218[/C][C]0[/C][/ROW]
[ROW][C]24[/C][C]0.482457[/C][C]5.543[/C][C]0[/C][/ROW]
[ROW][C]25[/C][C]0.464478[/C][C]5.3365[/C][C]0[/C][/ROW]
[ROW][C]26[/C][C]0.440685[/C][C]5.0631[/C][C]1e-06[/C][/ROW]
[ROW][C]27[/C][C]0.414385[/C][C]4.7609[/C][C]2e-06[/C][/ROW]
[ROW][C]28[/C][C]0.381221[/C][C]4.3799[/C][C]1.2e-05[/C][/ROW]
[ROW][C]29[/C][C]0.352498[/C][C]4.0499[/C][C]4.3e-05[/C][/ROW]
[ROW][C]30[/C][C]0.324144[/C][C]3.7241[/C][C]0.000145[/C][/ROW]
[ROW][C]31[/C][C]0.299424[/C][C]3.4401[/C][C]0.000389[/C][/ROW]
[ROW][C]32[/C][C]0.269711[/C][C]3.0987[/C][C]0.001188[/C][/ROW]
[ROW][C]33[/C][C]0.240635[/C][C]2.7647[/C][C]0.003257[/C][/ROW]
[ROW][C]34[/C][C]0.203568[/C][C]2.3388[/C][C]0.010423[/C][/ROW]
[ROW][C]35[/C][C]0.174186[/C][C]2.0012[/C][C]0.023709[/C][/ROW]
[ROW][C]36[/C][C]0.145665[/C][C]1.6736[/C][C]0.048292[/C][/ROW]
[ROW][C]37[/C][C]0.126867[/C][C]1.4576[/C][C]0.073665[/C][/ROW]
[ROW][C]38[/C][C]0.103784[/C][C]1.1924[/C][C]0.117623[/C][/ROW]
[ROW][C]39[/C][C]0.078312[/C][C]0.8997[/C][C]0.184948[/C][/ROW]
[ROW][C]40[/C][C]0.055673[/C][C]0.6396[/C][C]0.261759[/C][/ROW]
[ROW][C]41[/C][C]0.025043[/C][C]0.2877[/C][C]0.387007[/C][/ROW]
[ROW][C]42[/C][C]0.002269[/C][C]0.0261[/C][C]0.489623[/C][/ROW]
[ROW][C]43[/C][C]-0.024095[/C][C]-0.2768[/C][C]0.391171[/C][/ROW]
[ROW][C]44[/C][C]-0.046601[/C][C]-0.5354[/C][C]0.296635[/C][/ROW]
[ROW][C]45[/C][C]-0.078844[/C][C]-0.9059[/C][C]0.183332[/C][/ROW]
[ROW][C]46[/C][C]-0.104147[/C][C]-1.1966[/C][C]0.116811[/C][/ROW]
[ROW][C]47[/C][C]-0.131726[/C][C]-1.5134[/C][C]0.066282[/C][/ROW]
[ROW][C]48[/C][C]-0.149226[/C][C]-1.7145[/C][C]0.044394[/C][/ROW]
[/TABLE]
Source: https://freestatistics.org/blog/index.php?pk=75071&T=1

Globally Unique Identifier (entire table): ba.freestatistics.org/blog/index.php?pk=75071&T=1

As an alternative you can also use a QR Code:  

The GUIDs for individual cells are displayed in the table below:

Autocorrelation Function
Time lag kACF(k)T-STATP-value
10.94882510.90120
20.93588110.75250
30.91683810.53370
40.8968310.30380
50.88881110.21170
60.8682549.97550
70.8538129.80950
80.8298079.53380
90.8093149.29830
100.7954519.1390
110.7846449.01490
120.7733378.8850
130.7553768.67860
140.7284328.36910
150.7118698.17880
160.6866477.8890
170.663717.62540
180.6365997.3140
190.6101397.010
200.5853256.72490
210.5562636.3910
220.534416.13990
230.506725.82180
240.4824575.5430
250.4644785.33650
260.4406855.06311e-06
270.4143854.76092e-06
280.3812214.37991.2e-05
290.3524984.04994.3e-05
300.3241443.72410.000145
310.2994243.44010.000389
320.2697113.09870.001188
330.2406352.76470.003257
340.2035682.33880.010423
350.1741862.00120.023709
360.1456651.67360.048292
370.1268671.45760.073665
380.1037841.19240.117623
390.0783120.89970.184948
400.0556730.63960.261759
410.0250430.28770.387007
420.0022690.02610.489623
43-0.024095-0.27680.391171
44-0.046601-0.53540.296635
45-0.078844-0.90590.183332
46-0.104147-1.19660.116811
47-0.131726-1.51340.066282
48-0.149226-1.71450.044394


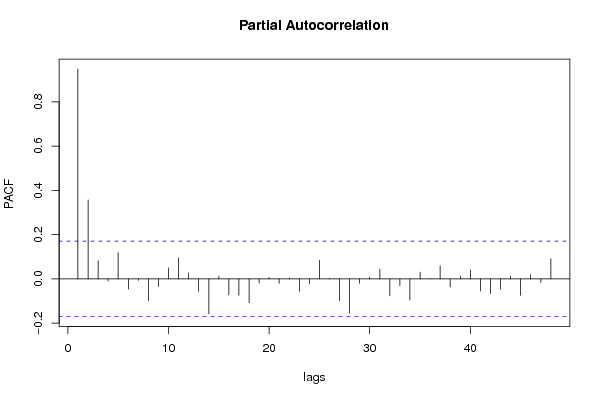
Partial Autocorrelation Function
Time lag kPACF(k)T-STATP-value
10.94882510.90120
20.3570784.10253.6e-05
30.0819060.9410.174205
4-0.009052-0.1040.458662
50.1178271.35370.089067
6-0.045774-0.52590.29992
7-0.007158-0.08220.467291
8-0.098438-1.1310.13006
9-0.034837-0.40030.344809
100.0495960.56980.284887
110.0952481.09430.137905
120.0267510.30730.379532
13-0.056184-0.64550.259862
14-0.157984-1.81510.03589
150.0118620.13630.445901
16-0.07201-0.82730.204769
17-0.074428-0.85510.197019
18-0.107487-1.23490.109524
19-0.018782-0.21580.414745
200.0060210.06920.472477
21-0.020188-0.23190.408473
220.0036150.04150.483465
23-0.055376-0.63620.262866
24-0.021438-0.24630.402915
250.0844110.96980.166957
260.0019850.02280.49092
27-0.098708-1.13410.129411
28-0.155049-1.78140.038575
29-0.019835-0.22790.410046
300.0077040.08850.464803
310.0440190.50570.306943
32-0.076301-0.87660.19114
33-0.030116-0.3460.364945
34-0.095367-1.09570.137606
350.0306770.35240.362533
36-0.000201-0.00230.499079
370.0587830.67540.250313
38-0.036277-0.41680.338754
390.0119540.13730.445487
400.0403040.46310.322044
41-0.054694-0.62840.265417
42-0.066225-0.76090.224045
43-0.046207-0.53090.298199
440.0121190.13920.44474
45-0.074028-0.85050.198289
460.0191880.22050.41293
47-0.016243-0.18660.426125
480.0912131.0480.148285

\begin{tabular}{lllllllll}
\hline
Partial Autocorrelation Function \tabularnewline
Time lag k & PACF(k) & T-STAT & P-value \tabularnewline
1 & 0.948825 & 10.9012 & 0 \tabularnewline
2 & 0.357078 & 4.1025 & 3.6e-05 \tabularnewline
3 & 0.081906 & 0.941 & 0.174205 \tabularnewline
4 & -0.009052 & -0.104 & 0.458662 \tabularnewline
5 & 0.117827 & 1.3537 & 0.089067 \tabularnewline
6 & -0.045774 & -0.5259 & 0.29992 \tabularnewline
7 & -0.007158 & -0.0822 & 0.467291 \tabularnewline
8 & -0.098438 & -1.131 & 0.13006 \tabularnewline
9 & -0.034837 & -0.4003 & 0.344809 \tabularnewline
10 & 0.049596 & 0.5698 & 0.284887 \tabularnewline
11 & 0.095248 & 1.0943 & 0.137905 \tabularnewline
12 & 0.026751 & 0.3073 & 0.379532 \tabularnewline
13 & -0.056184 & -0.6455 & 0.259862 \tabularnewline
14 & -0.157984 & -1.8151 & 0.03589 \tabularnewline
15 & 0.011862 & 0.1363 & 0.445901 \tabularnewline
16 & -0.07201 & -0.8273 & 0.204769 \tabularnewline
17 & -0.074428 & -0.8551 & 0.197019 \tabularnewline
18 & -0.107487 & -1.2349 & 0.109524 \tabularnewline
19 & -0.018782 & -0.2158 & 0.414745 \tabularnewline
20 & 0.006021 & 0.0692 & 0.472477 \tabularnewline
21 & -0.020188 & -0.2319 & 0.408473 \tabularnewline
22 & 0.003615 & 0.0415 & 0.483465 \tabularnewline
23 & -0.055376 & -0.6362 & 0.262866 \tabularnewline
24 & -0.021438 & -0.2463 & 0.402915 \tabularnewline
25 & 0.084411 & 0.9698 & 0.166957 \tabularnewline
26 & 0.001985 & 0.0228 & 0.49092 \tabularnewline
27 & -0.098708 & -1.1341 & 0.129411 \tabularnewline
28 & -0.155049 & -1.7814 & 0.038575 \tabularnewline
29 & -0.019835 & -0.2279 & 0.410046 \tabularnewline
30 & 0.007704 & 0.0885 & 0.464803 \tabularnewline
31 & 0.044019 & 0.5057 & 0.306943 \tabularnewline
32 & -0.076301 & -0.8766 & 0.19114 \tabularnewline
33 & -0.030116 & -0.346 & 0.364945 \tabularnewline
34 & -0.095367 & -1.0957 & 0.137606 \tabularnewline
35 & 0.030677 & 0.3524 & 0.362533 \tabularnewline
36 & -0.000201 & -0.0023 & 0.499079 \tabularnewline
37 & 0.058783 & 0.6754 & 0.250313 \tabularnewline
38 & -0.036277 & -0.4168 & 0.338754 \tabularnewline
39 & 0.011954 & 0.1373 & 0.445487 \tabularnewline
40 & 0.040304 & 0.4631 & 0.322044 \tabularnewline
41 & -0.054694 & -0.6284 & 0.265417 \tabularnewline
42 & -0.066225 & -0.7609 & 0.224045 \tabularnewline
43 & -0.046207 & -0.5309 & 0.298199 \tabularnewline
44 & 0.012119 & 0.1392 & 0.44474 \tabularnewline
45 & -0.074028 & -0.8505 & 0.198289 \tabularnewline
46 & 0.019188 & 0.2205 & 0.41293 \tabularnewline
47 & -0.016243 & -0.1866 & 0.426125 \tabularnewline
48 & 0.091213 & 1.048 & 0.148285 \tabularnewline
\hline
\end{tabular}
%Source: https://freestatistics.org/blog/index.php?pk=75071&T=2

[TABLE]
[ROW][C]Partial Autocorrelation Function[/C][/ROW]
[ROW][C]Time lag k[/C][C]PACF(k)[/C][C]T-STAT[/C][C]P-value[/C][/ROW]
[ROW][C]1[/C][C]0.948825[/C][C]10.9012[/C][C]0[/C][/ROW]
[ROW][C]2[/C][C]0.357078[/C][C]4.1025[/C][C]3.6e-05[/C][/ROW]
[ROW][C]3[/C][C]0.081906[/C][C]0.941[/C][C]0.174205[/C][/ROW]
[ROW][C]4[/C][C]-0.009052[/C][C]-0.104[/C][C]0.458662[/C][/ROW]
[ROW][C]5[/C][C]0.117827[/C][C]1.3537[/C][C]0.089067[/C][/ROW]
[ROW][C]6[/C][C]-0.045774[/C][C]-0.5259[/C][C]0.29992[/C][/ROW]
[ROW][C]7[/C][C]-0.007158[/C][C]-0.0822[/C][C]0.467291[/C][/ROW]
[ROW][C]8[/C][C]-0.098438[/C][C]-1.131[/C][C]0.13006[/C][/ROW]
[ROW][C]9[/C][C]-0.034837[/C][C]-0.4003[/C][C]0.344809[/C][/ROW]
[ROW][C]10[/C][C]0.049596[/C][C]0.5698[/C][C]0.284887[/C][/ROW]
[ROW][C]11[/C][C]0.095248[/C][C]1.0943[/C][C]0.137905[/C][/ROW]
[ROW][C]12[/C][C]0.026751[/C][C]0.3073[/C][C]0.379532[/C][/ROW]
[ROW][C]13[/C][C]-0.056184[/C][C]-0.6455[/C][C]0.259862[/C][/ROW]
[ROW][C]14[/C][C]-0.157984[/C][C]-1.8151[/C][C]0.03589[/C][/ROW]
[ROW][C]15[/C][C]0.011862[/C][C]0.1363[/C][C]0.445901[/C][/ROW]
[ROW][C]16[/C][C]-0.07201[/C][C]-0.8273[/C][C]0.204769[/C][/ROW]
[ROW][C]17[/C][C]-0.074428[/C][C]-0.8551[/C][C]0.197019[/C][/ROW]
[ROW][C]18[/C][C]-0.107487[/C][C]-1.2349[/C][C]0.109524[/C][/ROW]
[ROW][C]19[/C][C]-0.018782[/C][C]-0.2158[/C][C]0.414745[/C][/ROW]
[ROW][C]20[/C][C]0.006021[/C][C]0.0692[/C][C]0.472477[/C][/ROW]
[ROW][C]21[/C][C]-0.020188[/C][C]-0.2319[/C][C]0.408473[/C][/ROW]
[ROW][C]22[/C][C]0.003615[/C][C]0.0415[/C][C]0.483465[/C][/ROW]
[ROW][C]23[/C][C]-0.055376[/C][C]-0.6362[/C][C]0.262866[/C][/ROW]
[ROW][C]24[/C][C]-0.021438[/C][C]-0.2463[/C][C]0.402915[/C][/ROW]
[ROW][C]25[/C][C]0.084411[/C][C]0.9698[/C][C]0.166957[/C][/ROW]
[ROW][C]26[/C][C]0.001985[/C][C]0.0228[/C][C]0.49092[/C][/ROW]
[ROW][C]27[/C][C]-0.098708[/C][C]-1.1341[/C][C]0.129411[/C][/ROW]
[ROW][C]28[/C][C]-0.155049[/C][C]-1.7814[/C][C]0.038575[/C][/ROW]
[ROW][C]29[/C][C]-0.019835[/C][C]-0.2279[/C][C]0.410046[/C][/ROW]
[ROW][C]30[/C][C]0.007704[/C][C]0.0885[/C][C]0.464803[/C][/ROW]
[ROW][C]31[/C][C]0.044019[/C][C]0.5057[/C][C]0.306943[/C][/ROW]
[ROW][C]32[/C][C]-0.076301[/C][C]-0.8766[/C][C]0.19114[/C][/ROW]
[ROW][C]33[/C][C]-0.030116[/C][C]-0.346[/C][C]0.364945[/C][/ROW]
[ROW][C]34[/C][C]-0.095367[/C][C]-1.0957[/C][C]0.137606[/C][/ROW]
[ROW][C]35[/C][C]0.030677[/C][C]0.3524[/C][C]0.362533[/C][/ROW]
[ROW][C]36[/C][C]-0.000201[/C][C]-0.0023[/C][C]0.499079[/C][/ROW]
[ROW][C]37[/C][C]0.058783[/C][C]0.6754[/C][C]0.250313[/C][/ROW]
[ROW][C]38[/C][C]-0.036277[/C][C]-0.4168[/C][C]0.338754[/C][/ROW]
[ROW][C]39[/C][C]0.011954[/C][C]0.1373[/C][C]0.445487[/C][/ROW]
[ROW][C]40[/C][C]0.040304[/C][C]0.4631[/C][C]0.322044[/C][/ROW]
[ROW][C]41[/C][C]-0.054694[/C][C]-0.6284[/C][C]0.265417[/C][/ROW]
[ROW][C]42[/C][C]-0.066225[/C][C]-0.7609[/C][C]0.224045[/C][/ROW]
[ROW][C]43[/C][C]-0.046207[/C][C]-0.5309[/C][C]0.298199[/C][/ROW]
[ROW][C]44[/C][C]0.012119[/C][C]0.1392[/C][C]0.44474[/C][/ROW]
[ROW][C]45[/C][C]-0.074028[/C][C]-0.8505[/C][C]0.198289[/C][/ROW]
[ROW][C]46[/C][C]0.019188[/C][C]0.2205[/C][C]0.41293[/C][/ROW]
[ROW][C]47[/C][C]-0.016243[/C][C]-0.1866[/C][C]0.426125[/C][/ROW]
[ROW][C]48[/C][C]0.091213[/C][C]1.048[/C][C]0.148285[/C][/ROW]
[/TABLE]
Source: https://freestatistics.org/blog/index.php?pk=75071&T=2

Globally Unique Identifier (entire table): ba.freestatistics.org/blog/index.php?pk=75071&T=2

As an alternative you can also use a QR Code:  

The GUIDs for individual cells are displayed in the table below:

Partial Autocorrelation Function
Time lag kPACF(k)T-STATP-value
10.94882510.90120
20.3570784.10253.6e-05
30.0819060.9410.174205
4-0.009052-0.1040.458662
50.1178271.35370.089067
6-0.045774-0.52590.29992
7-0.007158-0.08220.467291
8-0.098438-1.1310.13006
9-0.034837-0.40030.344809
100.0495960.56980.284887
110.0952481.09430.137905
120.0267510.30730.379532
13-0.056184-0.64550.259862
14-0.157984-1.81510.03589
150.0118620.13630.445901
16-0.07201-0.82730.204769
17-0.074428-0.85510.197019
18-0.107487-1.23490.109524
19-0.018782-0.21580.414745
200.0060210.06920.472477
21-0.020188-0.23190.408473
220.0036150.04150.483465
23-0.055376-0.63620.262866
24-0.021438-0.24630.402915
250.0844110.96980.166957
260.0019850.02280.49092
27-0.098708-1.13410.129411
28-0.155049-1.78140.038575
29-0.019835-0.22790.410046
300.0077040.08850.464803
310.0440190.50570.306943
32-0.076301-0.87660.19114
33-0.030116-0.3460.364945
34-0.095367-1.09570.137606
350.0306770.35240.362533
36-0.000201-0.00230.499079
370.0587830.67540.250313
38-0.036277-0.41680.338754
390.0119540.13730.445487
400.0403040.46310.322044
41-0.054694-0.62840.265417
42-0.066225-0.76090.224045
43-0.046207-0.53090.298199
440.0121190.13920.44474
45-0.074028-0.85050.198289
460.0191880.22050.41293
47-0.016243-0.18660.426125
480.0912131.0480.148285


Parameters (Session):
par1 = 48 ; par2 = 1 ; par3 = 0 ; par4 = 0 ; par5 = 12 ; par6 = White Noise ; par7 = 0.95 ;
Parameters (R input):
par1 = 48 ; par2 = 1 ; par3 = 0 ; par4 = 0 ; par5 = 12 ; par6 = White Noise ; par7 = 0.95 ;
R code (references can be found in the software module):
if (par1 == 'Default') {
par1 = 10*log10(length(x))
} else {
par1 <- as.numeric(par1)
}
par2 <- as.numeric(par2)
par3 <- as.numeric(par3)
par4 <- as.numeric(par4)
par5 <- as.numeric(par5)
if (par6 == 'White Noise') par6 <- 'white' else par6 <- 'ma'
par7 <- as.numeric(par7)
if (par2 == 0) {
x <- log(x)
} else {
x <- (x ^ par2 - 1) / par2
}
if (par3 > 0) x <- diff(x,lag=1,difference=par3)
if (par4 > 0) x <- diff(x,lag=par5,difference=par4)
bitmap(file='pic1.png')
racf <- acf(x, par1, main='Autocorrelation', xlab='time lag', ylab='ACF', ci.type=par6, ci=par7, sub=paste('(lambda=',par2,', d=',par3,', D=',par4,', CI=', par7, ', CI type=',par6,')',sep=''))
dev.off()
bitmap(file='pic2.png')
rpacf <- pacf(x,par1,main='Partial Autocorrelation',xlab='lags',ylab='PACF')
dev.off()
(myacf <- c(racf$acf))
(mypacf <- c(rpacf$acf))
lengthx <- length(x)
sqrtn <- sqrt(lengthx)
load(file='createtable')
a<-table.start()
a<-table.row.start(a)
a<-table.element(a,'Autocorrelation Function',4,TRUE)
a<-table.row.end(a)
a<-table.row.start(a)
a<-table.element(a,'Time lag k',header=TRUE)
a<-table.element(a,hyperlink('basics.htm','ACF(k)','click here for more information about the Autocorrelation Function'),header=TRUE)
a<-table.element(a,'T-STAT',header=TRUE)
a<-table.element(a,'P-value',header=TRUE)
a<-table.row.end(a)
for (i in 2:(par1+1)) {
a<-table.row.start(a)
a<-table.element(a,i-1,header=TRUE)
a<-table.element(a,round(myacf[i],6))
mytstat <- myacf[i]*sqrtn
a<-table.element(a,round(mytstat,4))
a<-table.element(a,round(1-pt(abs(mytstat),lengthx),6))
a<-table.row.end(a)
}
a<-table.end(a)
table.save(a,file='mytable.tab')
a<-table.start()
a<-table.row.start(a)
a<-table.element(a,'Partial Autocorrelation Function',4,TRUE)
a<-table.row.end(a)
a<-table.row.start(a)
a<-table.element(a,'Time lag k',header=TRUE)
a<-table.element(a,hyperlink('basics.htm','PACF(k)','click here for more information about the Partial Autocorrelation Function'),header=TRUE)
a<-table.element(a,'T-STAT',header=TRUE)
a<-table.element(a,'P-value',header=TRUE)
a<-table.row.end(a)
for (i in 1:par1) {
a<-table.row.start(a)
a<-table.element(a,i,header=TRUE)
a<-table.element(a,round(mypacf[i],6))
mytstat <- mypacf[i]*sqrtn
a<-table.element(a,round(mytstat,4))
a<-table.element(a,round(1-pt(abs(mytstat),lengthx),6))
a<-table.row.end(a)
}
a<-table.end(a)
table.save(a,file='mytable1.tab')