Free Statistics

of Irreproducible Research!

Author's title

Author*Unverified author*
R Software Modulerwasp_autocorrelation.wasp
Title produced by software(Partial) Autocorrelation Function
Date of computationThu, 29 Apr 2010 08:12:20 +0000
Cite this page as followsStatistical Computations at FreeStatistics.org, Office for Research Development and Education, URL https://freestatistics.org/blog/index.php?v=date/2010/Apr/29/t1272528804aykzptybqnjac89.htm/, Retrieved Thu, 25 Apr 2024 22:33:08 +0000
Statistical Computations at FreeStatistics.org, Office for Research Development and Education, URL https://freestatistics.org/blog/index.php?pk=75037, Retrieved Thu, 25 Apr 2024 22:33:08 +0000
QR Codes:

Original text written by user:
IsPrivate?No (this computation is public)
User-defined keywordsKDGP2W21
Estimated Impact230
Family? (F = Feedback message, R = changed R code, M = changed R Module, P = changed Parameters, D = changed Data)
-       [(Partial) Autocorrelation Function] [autocorrelate met...] [2010-04-29 08:12:20] [e8bb75392cb2cf20c26f170b87ccd1b7] [Current]
Feedback Forum

Post a new message
Dataseries X:
154
96
73
49
36
59
95
169
210
278
298
245
200
118
90
79
78
91
167
169
289
347
375
203
223
104
107
85
75
99
135
211
335
460
488
326
346
261
224
141
148
145
223
272
445
560
612
467
518
404
300
210
196
186
247
343
464
680
711
610
613
392
273
322
189
257
324
404
677
858
895
664
628
308
324
248
272


Summary of computational transaction
Raw Inputview raw input (R code)
Raw Outputview raw output of R engine
Computing time1 seconds
R Server'Sir Ronald Aylmer Fisher' @ 193.190.124.24

\begin{tabular}{lllllllll}
\hline
Summary of computational transaction \tabularnewline
Raw Input & view raw input (R code)  \tabularnewline
Raw Output & view raw output of R engine  \tabularnewline
Computing time & 1 seconds \tabularnewline
R Server & 'Sir Ronald Aylmer Fisher' @ 193.190.124.24 \tabularnewline
\hline
\end{tabular}
%Source: https://freestatistics.org/blog/index.php?pk=75037&T=0

[TABLE]
[ROW][C]Summary of computational transaction[/C][/ROW]
[ROW][C]Raw Input[/C][C]view raw input (R code) [/C][/ROW]
[ROW][C]Raw Output[/C][C]view raw output of R engine [/C][/ROW]
[ROW][C]Computing time[/C][C]1 seconds[/C][/ROW]
[ROW][C]R Server[/C][C]'Sir Ronald Aylmer Fisher' @ 193.190.124.24[/C][/ROW]
[/TABLE]
Source: https://freestatistics.org/blog/index.php?pk=75037&T=0

Globally Unique Identifier (entire table): ba.freestatistics.org/blog/index.php?pk=75037&T=0

As an alternative you can also use a QR Code:  

The GUIDs for individual cells are displayed in the table below:

Summary of computational transaction
Raw Inputview raw input (R code)
Raw Outputview raw output of R engine
Computing time1 seconds
R Server'Sir Ronald Aylmer Fisher' @ 193.190.124.24


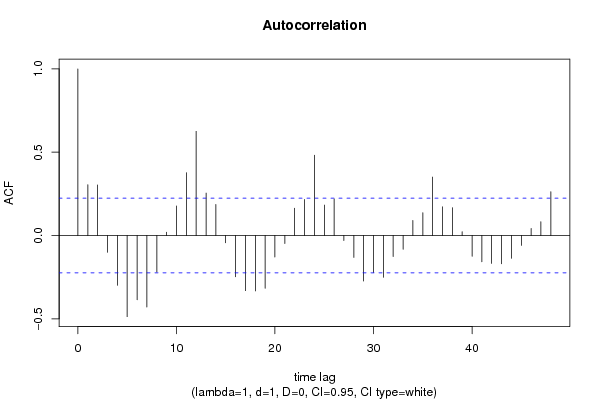
Autocorrelation Function
Time lag kACF(k)T-STATP-value
10.3051022.65980.004766
20.303992.65010.004892
3-0.100856-0.87920.191021
4-0.29839-2.60130.005579
5-0.487021-4.24583e-05
6-0.386231-3.36710.000597
7-0.428973-3.73970.000178
8-0.219159-1.91060.029915
90.0195080.17010.432705
100.1770391.54340.063445
110.376863.28540.000771
120.6252915.45120
130.2546582.22010.014698
140.1861191.62260.054413
15-0.043144-0.37610.353938
16-0.247422-2.1570.017084
17-0.330869-2.88450.002549
18-0.332563-2.89920.002444
19-0.316542-2.75960.003625
20-0.129017-1.12470.132119
21-0.048485-0.42270.336862
220.1636941.42710.07883
230.2159621.88270.031783
240.4817944.20023.6e-05
250.1825031.5910.057877
260.2199161.91720.029487
27-0.030176-0.26310.396605
28-0.131304-1.14470.127967
29-0.272736-2.37770.009969
30-0.222004-1.93540.028332
31-0.25086-2.18690.015911
32-0.126061-1.0990.137625
33-0.083068-0.72420.235593
340.0902290.78660.216981
350.1365871.19070.118731
360.3508513.05860.001535
370.1723151.50220.068594
380.1674731.460.074206
390.0227890.19870.421526
40-0.12491-1.08890.13981
41-0.157705-1.37480.08661
42-0.167519-1.46040.074151
43-0.169131-1.47440.072246
44-0.136576-1.19060.11875
45-0.059375-0.51760.303114
460.0426210.37160.355627
470.0823310.71770.237559
480.2626332.28960.012411

\begin{tabular}{lllllllll}
\hline
Autocorrelation Function \tabularnewline
Time lag k & ACF(k) & T-STAT & P-value \tabularnewline
1 & 0.305102 & 2.6598 & 0.004766 \tabularnewline
2 & 0.30399 & 2.6501 & 0.004892 \tabularnewline
3 & -0.100856 & -0.8792 & 0.191021 \tabularnewline
4 & -0.29839 & -2.6013 & 0.005579 \tabularnewline
5 & -0.487021 & -4.2458 & 3e-05 \tabularnewline
6 & -0.386231 & -3.3671 & 0.000597 \tabularnewline
7 & -0.428973 & -3.7397 & 0.000178 \tabularnewline
8 & -0.219159 & -1.9106 & 0.029915 \tabularnewline
9 & 0.019508 & 0.1701 & 0.432705 \tabularnewline
10 & 0.177039 & 1.5434 & 0.063445 \tabularnewline
11 & 0.37686 & 3.2854 & 0.000771 \tabularnewline
12 & 0.625291 & 5.4512 & 0 \tabularnewline
13 & 0.254658 & 2.2201 & 0.014698 \tabularnewline
14 & 0.186119 & 1.6226 & 0.054413 \tabularnewline
15 & -0.043144 & -0.3761 & 0.353938 \tabularnewline
16 & -0.247422 & -2.157 & 0.017084 \tabularnewline
17 & -0.330869 & -2.8845 & 0.002549 \tabularnewline
18 & -0.332563 & -2.8992 & 0.002444 \tabularnewline
19 & -0.316542 & -2.7596 & 0.003625 \tabularnewline
20 & -0.129017 & -1.1247 & 0.132119 \tabularnewline
21 & -0.048485 & -0.4227 & 0.336862 \tabularnewline
22 & 0.163694 & 1.4271 & 0.07883 \tabularnewline
23 & 0.215962 & 1.8827 & 0.031783 \tabularnewline
24 & 0.481794 & 4.2002 & 3.6e-05 \tabularnewline
25 & 0.182503 & 1.591 & 0.057877 \tabularnewline
26 & 0.219916 & 1.9172 & 0.029487 \tabularnewline
27 & -0.030176 & -0.2631 & 0.396605 \tabularnewline
28 & -0.131304 & -1.1447 & 0.127967 \tabularnewline
29 & -0.272736 & -2.3777 & 0.009969 \tabularnewline
30 & -0.222004 & -1.9354 & 0.028332 \tabularnewline
31 & -0.25086 & -2.1869 & 0.015911 \tabularnewline
32 & -0.126061 & -1.099 & 0.137625 \tabularnewline
33 & -0.083068 & -0.7242 & 0.235593 \tabularnewline
34 & 0.090229 & 0.7866 & 0.216981 \tabularnewline
35 & 0.136587 & 1.1907 & 0.118731 \tabularnewline
36 & 0.350851 & 3.0586 & 0.001535 \tabularnewline
37 & 0.172315 & 1.5022 & 0.068594 \tabularnewline
38 & 0.167473 & 1.46 & 0.074206 \tabularnewline
39 & 0.022789 & 0.1987 & 0.421526 \tabularnewline
40 & -0.12491 & -1.0889 & 0.13981 \tabularnewline
41 & -0.157705 & -1.3748 & 0.08661 \tabularnewline
42 & -0.167519 & -1.4604 & 0.074151 \tabularnewline
43 & -0.169131 & -1.4744 & 0.072246 \tabularnewline
44 & -0.136576 & -1.1906 & 0.11875 \tabularnewline
45 & -0.059375 & -0.5176 & 0.303114 \tabularnewline
46 & 0.042621 & 0.3716 & 0.355627 \tabularnewline
47 & 0.082331 & 0.7177 & 0.237559 \tabularnewline
48 & 0.262633 & 2.2896 & 0.012411 \tabularnewline
\hline
\end{tabular}
%Source: https://freestatistics.org/blog/index.php?pk=75037&T=1

[TABLE]
[ROW][C]Autocorrelation Function[/C][/ROW]
[ROW][C]Time lag k[/C][C]ACF(k)[/C][C]T-STAT[/C][C]P-value[/C][/ROW]
[ROW][C]1[/C][C]0.305102[/C][C]2.6598[/C][C]0.004766[/C][/ROW]
[ROW][C]2[/C][C]0.30399[/C][C]2.6501[/C][C]0.004892[/C][/ROW]
[ROW][C]3[/C][C]-0.100856[/C][C]-0.8792[/C][C]0.191021[/C][/ROW]
[ROW][C]4[/C][C]-0.29839[/C][C]-2.6013[/C][C]0.005579[/C][/ROW]
[ROW][C]5[/C][C]-0.487021[/C][C]-4.2458[/C][C]3e-05[/C][/ROW]
[ROW][C]6[/C][C]-0.386231[/C][C]-3.3671[/C][C]0.000597[/C][/ROW]
[ROW][C]7[/C][C]-0.428973[/C][C]-3.7397[/C][C]0.000178[/C][/ROW]
[ROW][C]8[/C][C]-0.219159[/C][C]-1.9106[/C][C]0.029915[/C][/ROW]
[ROW][C]9[/C][C]0.019508[/C][C]0.1701[/C][C]0.432705[/C][/ROW]
[ROW][C]10[/C][C]0.177039[/C][C]1.5434[/C][C]0.063445[/C][/ROW]
[ROW][C]11[/C][C]0.37686[/C][C]3.2854[/C][C]0.000771[/C][/ROW]
[ROW][C]12[/C][C]0.625291[/C][C]5.4512[/C][C]0[/C][/ROW]
[ROW][C]13[/C][C]0.254658[/C][C]2.2201[/C][C]0.014698[/C][/ROW]
[ROW][C]14[/C][C]0.186119[/C][C]1.6226[/C][C]0.054413[/C][/ROW]
[ROW][C]15[/C][C]-0.043144[/C][C]-0.3761[/C][C]0.353938[/C][/ROW]
[ROW][C]16[/C][C]-0.247422[/C][C]-2.157[/C][C]0.017084[/C][/ROW]
[ROW][C]17[/C][C]-0.330869[/C][C]-2.8845[/C][C]0.002549[/C][/ROW]
[ROW][C]18[/C][C]-0.332563[/C][C]-2.8992[/C][C]0.002444[/C][/ROW]
[ROW][C]19[/C][C]-0.316542[/C][C]-2.7596[/C][C]0.003625[/C][/ROW]
[ROW][C]20[/C][C]-0.129017[/C][C]-1.1247[/C][C]0.132119[/C][/ROW]
[ROW][C]21[/C][C]-0.048485[/C][C]-0.4227[/C][C]0.336862[/C][/ROW]
[ROW][C]22[/C][C]0.163694[/C][C]1.4271[/C][C]0.07883[/C][/ROW]
[ROW][C]23[/C][C]0.215962[/C][C]1.8827[/C][C]0.031783[/C][/ROW]
[ROW][C]24[/C][C]0.481794[/C][C]4.2002[/C][C]3.6e-05[/C][/ROW]
[ROW][C]25[/C][C]0.182503[/C][C]1.591[/C][C]0.057877[/C][/ROW]
[ROW][C]26[/C][C]0.219916[/C][C]1.9172[/C][C]0.029487[/C][/ROW]
[ROW][C]27[/C][C]-0.030176[/C][C]-0.2631[/C][C]0.396605[/C][/ROW]
[ROW][C]28[/C][C]-0.131304[/C][C]-1.1447[/C][C]0.127967[/C][/ROW]
[ROW][C]29[/C][C]-0.272736[/C][C]-2.3777[/C][C]0.009969[/C][/ROW]
[ROW][C]30[/C][C]-0.222004[/C][C]-1.9354[/C][C]0.028332[/C][/ROW]
[ROW][C]31[/C][C]-0.25086[/C][C]-2.1869[/C][C]0.015911[/C][/ROW]
[ROW][C]32[/C][C]-0.126061[/C][C]-1.099[/C][C]0.137625[/C][/ROW]
[ROW][C]33[/C][C]-0.083068[/C][C]-0.7242[/C][C]0.235593[/C][/ROW]
[ROW][C]34[/C][C]0.090229[/C][C]0.7866[/C][C]0.216981[/C][/ROW]
[ROW][C]35[/C][C]0.136587[/C][C]1.1907[/C][C]0.118731[/C][/ROW]
[ROW][C]36[/C][C]0.350851[/C][C]3.0586[/C][C]0.001535[/C][/ROW]
[ROW][C]37[/C][C]0.172315[/C][C]1.5022[/C][C]0.068594[/C][/ROW]
[ROW][C]38[/C][C]0.167473[/C][C]1.46[/C][C]0.074206[/C][/ROW]
[ROW][C]39[/C][C]0.022789[/C][C]0.1987[/C][C]0.421526[/C][/ROW]
[ROW][C]40[/C][C]-0.12491[/C][C]-1.0889[/C][C]0.13981[/C][/ROW]
[ROW][C]41[/C][C]-0.157705[/C][C]-1.3748[/C][C]0.08661[/C][/ROW]
[ROW][C]42[/C][C]-0.167519[/C][C]-1.4604[/C][C]0.074151[/C][/ROW]
[ROW][C]43[/C][C]-0.169131[/C][C]-1.4744[/C][C]0.072246[/C][/ROW]
[ROW][C]44[/C][C]-0.136576[/C][C]-1.1906[/C][C]0.11875[/C][/ROW]
[ROW][C]45[/C][C]-0.059375[/C][C]-0.5176[/C][C]0.303114[/C][/ROW]
[ROW][C]46[/C][C]0.042621[/C][C]0.3716[/C][C]0.355627[/C][/ROW]
[ROW][C]47[/C][C]0.082331[/C][C]0.7177[/C][C]0.237559[/C][/ROW]
[ROW][C]48[/C][C]0.262633[/C][C]2.2896[/C][C]0.012411[/C][/ROW]
[/TABLE]
Source: https://freestatistics.org/blog/index.php?pk=75037&T=1

Globally Unique Identifier (entire table): ba.freestatistics.org/blog/index.php?pk=75037&T=1

As an alternative you can also use a QR Code:  

The GUIDs for individual cells are displayed in the table below:

Autocorrelation Function
Time lag kACF(k)T-STATP-value
10.3051022.65980.004766
20.303992.65010.004892
3-0.100856-0.87920.191021
4-0.29839-2.60130.005579
5-0.487021-4.24583e-05
6-0.386231-3.36710.000597
7-0.428973-3.73970.000178
8-0.219159-1.91060.029915
90.0195080.17010.432705
100.1770391.54340.063445
110.376863.28540.000771
120.6252915.45120
130.2546582.22010.014698
140.1861191.62260.054413
15-0.043144-0.37610.353938
16-0.247422-2.1570.017084
17-0.330869-2.88450.002549
18-0.332563-2.89920.002444
19-0.316542-2.75960.003625
20-0.129017-1.12470.132119
21-0.048485-0.42270.336862
220.1636941.42710.07883
230.2159621.88270.031783
240.4817944.20023.6e-05
250.1825031.5910.057877
260.2199161.91720.029487
27-0.030176-0.26310.396605
28-0.131304-1.14470.127967
29-0.272736-2.37770.009969
30-0.222004-1.93540.028332
31-0.25086-2.18690.015911
32-0.126061-1.0990.137625
33-0.083068-0.72420.235593
340.0902290.78660.216981
350.1365871.19070.118731
360.3508513.05860.001535
370.1723151.50220.068594
380.1674731.460.074206
390.0227890.19870.421526
40-0.12491-1.08890.13981
41-0.157705-1.37480.08661
42-0.167519-1.46040.074151
43-0.169131-1.47440.072246
44-0.136576-1.19060.11875
45-0.059375-0.51760.303114
460.0426210.37160.355627
470.0823310.71770.237559
480.2626332.28960.012411


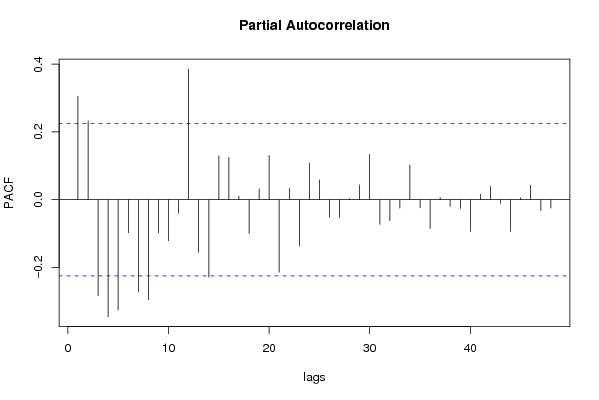
Partial Autocorrelation Function
Time lag kPACF(k)T-STATP-value
10.3051022.65980.004766
20.232552.02730.023068
3-0.283246-2.46930.007892
4-0.34544-3.01150.001764
5-0.325442-2.83710.002916
6-0.097519-0.85010.198957
7-0.271762-2.36920.010184
8-0.295808-2.57880.005923
9-0.097947-0.85390.197926
10-0.121305-1.05750.146814
11-0.039995-0.34870.36415
120.3860423.36546e-04
13-0.154921-1.35060.090421
14-0.229335-1.99930.024576
150.1293761.12790.131461
160.1244651.08510.140662
170.0105530.0920.463469
18-0.10007-0.87240.192871
190.0316420.27580.391708
200.1307321.13970.128996
21-0.213954-1.86520.033006
220.03310.28860.386851
23-0.136631-1.19110.118656
240.1074130.93640.176015
250.0583590.50880.306196
26-0.05149-0.44890.327397
27-0.052801-0.46030.323305
280.0030880.02690.489297
290.043120.37590.354016
300.1335091.16390.124051
31-0.072302-0.63030.26519
32-0.061371-0.5350.2971
33-0.024635-0.21480.415265
340.1020550.88970.188219
35-0.023738-0.20690.418305
36-0.084878-0.740.230804
370.0061610.05370.478652
38-0.019786-0.17250.431754
39-0.026363-0.22980.409422
40-0.093466-0.81480.208861
410.0162890.1420.443727
420.0392410.34210.366611
43-0.010465-0.09120.463774
44-0.093513-0.81520.208744
450.005370.04680.481392
460.0427730.37290.355135
47-0.031958-0.27860.390654
48-0.024434-0.2130.415944

\begin{tabular}{lllllllll}
\hline
Partial Autocorrelation Function \tabularnewline
Time lag k & PACF(k) & T-STAT & P-value \tabularnewline
1 & 0.305102 & 2.6598 & 0.004766 \tabularnewline
2 & 0.23255 & 2.0273 & 0.023068 \tabularnewline
3 & -0.283246 & -2.4693 & 0.007892 \tabularnewline
4 & -0.34544 & -3.0115 & 0.001764 \tabularnewline
5 & -0.325442 & -2.8371 & 0.002916 \tabularnewline
6 & -0.097519 & -0.8501 & 0.198957 \tabularnewline
7 & -0.271762 & -2.3692 & 0.010184 \tabularnewline
8 & -0.295808 & -2.5788 & 0.005923 \tabularnewline
9 & -0.097947 & -0.8539 & 0.197926 \tabularnewline
10 & -0.121305 & -1.0575 & 0.146814 \tabularnewline
11 & -0.039995 & -0.3487 & 0.36415 \tabularnewline
12 & 0.386042 & 3.3654 & 6e-04 \tabularnewline
13 & -0.154921 & -1.3506 & 0.090421 \tabularnewline
14 & -0.229335 & -1.9993 & 0.024576 \tabularnewline
15 & 0.129376 & 1.1279 & 0.131461 \tabularnewline
16 & 0.124465 & 1.0851 & 0.140662 \tabularnewline
17 & 0.010553 & 0.092 & 0.463469 \tabularnewline
18 & -0.10007 & -0.8724 & 0.192871 \tabularnewline
19 & 0.031642 & 0.2758 & 0.391708 \tabularnewline
20 & 0.130732 & 1.1397 & 0.128996 \tabularnewline
21 & -0.213954 & -1.8652 & 0.033006 \tabularnewline
22 & 0.0331 & 0.2886 & 0.386851 \tabularnewline
23 & -0.136631 & -1.1911 & 0.118656 \tabularnewline
24 & 0.107413 & 0.9364 & 0.176015 \tabularnewline
25 & 0.058359 & 0.5088 & 0.306196 \tabularnewline
26 & -0.05149 & -0.4489 & 0.327397 \tabularnewline
27 & -0.052801 & -0.4603 & 0.323305 \tabularnewline
28 & 0.003088 & 0.0269 & 0.489297 \tabularnewline
29 & 0.04312 & 0.3759 & 0.354016 \tabularnewline
30 & 0.133509 & 1.1639 & 0.124051 \tabularnewline
31 & -0.072302 & -0.6303 & 0.26519 \tabularnewline
32 & -0.061371 & -0.535 & 0.2971 \tabularnewline
33 & -0.024635 & -0.2148 & 0.415265 \tabularnewline
34 & 0.102055 & 0.8897 & 0.188219 \tabularnewline
35 & -0.023738 & -0.2069 & 0.418305 \tabularnewline
36 & -0.084878 & -0.74 & 0.230804 \tabularnewline
37 & 0.006161 & 0.0537 & 0.478652 \tabularnewline
38 & -0.019786 & -0.1725 & 0.431754 \tabularnewline
39 & -0.026363 & -0.2298 & 0.409422 \tabularnewline
40 & -0.093466 & -0.8148 & 0.208861 \tabularnewline
41 & 0.016289 & 0.142 & 0.443727 \tabularnewline
42 & 0.039241 & 0.3421 & 0.366611 \tabularnewline
43 & -0.010465 & -0.0912 & 0.463774 \tabularnewline
44 & -0.093513 & -0.8152 & 0.208744 \tabularnewline
45 & 0.00537 & 0.0468 & 0.481392 \tabularnewline
46 & 0.042773 & 0.3729 & 0.355135 \tabularnewline
47 & -0.031958 & -0.2786 & 0.390654 \tabularnewline
48 & -0.024434 & -0.213 & 0.415944 \tabularnewline
\hline
\end{tabular}
%Source: https://freestatistics.org/blog/index.php?pk=75037&T=2

[TABLE]
[ROW][C]Partial Autocorrelation Function[/C][/ROW]
[ROW][C]Time lag k[/C][C]PACF(k)[/C][C]T-STAT[/C][C]P-value[/C][/ROW]
[ROW][C]1[/C][C]0.305102[/C][C]2.6598[/C][C]0.004766[/C][/ROW]
[ROW][C]2[/C][C]0.23255[/C][C]2.0273[/C][C]0.023068[/C][/ROW]
[ROW][C]3[/C][C]-0.283246[/C][C]-2.4693[/C][C]0.007892[/C][/ROW]
[ROW][C]4[/C][C]-0.34544[/C][C]-3.0115[/C][C]0.001764[/C][/ROW]
[ROW][C]5[/C][C]-0.325442[/C][C]-2.8371[/C][C]0.002916[/C][/ROW]
[ROW][C]6[/C][C]-0.097519[/C][C]-0.8501[/C][C]0.198957[/C][/ROW]
[ROW][C]7[/C][C]-0.271762[/C][C]-2.3692[/C][C]0.010184[/C][/ROW]
[ROW][C]8[/C][C]-0.295808[/C][C]-2.5788[/C][C]0.005923[/C][/ROW]
[ROW][C]9[/C][C]-0.097947[/C][C]-0.8539[/C][C]0.197926[/C][/ROW]
[ROW][C]10[/C][C]-0.121305[/C][C]-1.0575[/C][C]0.146814[/C][/ROW]
[ROW][C]11[/C][C]-0.039995[/C][C]-0.3487[/C][C]0.36415[/C][/ROW]
[ROW][C]12[/C][C]0.386042[/C][C]3.3654[/C][C]6e-04[/C][/ROW]
[ROW][C]13[/C][C]-0.154921[/C][C]-1.3506[/C][C]0.090421[/C][/ROW]
[ROW][C]14[/C][C]-0.229335[/C][C]-1.9993[/C][C]0.024576[/C][/ROW]
[ROW][C]15[/C][C]0.129376[/C][C]1.1279[/C][C]0.131461[/C][/ROW]
[ROW][C]16[/C][C]0.124465[/C][C]1.0851[/C][C]0.140662[/C][/ROW]
[ROW][C]17[/C][C]0.010553[/C][C]0.092[/C][C]0.463469[/C][/ROW]
[ROW][C]18[/C][C]-0.10007[/C][C]-0.8724[/C][C]0.192871[/C][/ROW]
[ROW][C]19[/C][C]0.031642[/C][C]0.2758[/C][C]0.391708[/C][/ROW]
[ROW][C]20[/C][C]0.130732[/C][C]1.1397[/C][C]0.128996[/C][/ROW]
[ROW][C]21[/C][C]-0.213954[/C][C]-1.8652[/C][C]0.033006[/C][/ROW]
[ROW][C]22[/C][C]0.0331[/C][C]0.2886[/C][C]0.386851[/C][/ROW]
[ROW][C]23[/C][C]-0.136631[/C][C]-1.1911[/C][C]0.118656[/C][/ROW]
[ROW][C]24[/C][C]0.107413[/C][C]0.9364[/C][C]0.176015[/C][/ROW]
[ROW][C]25[/C][C]0.058359[/C][C]0.5088[/C][C]0.306196[/C][/ROW]
[ROW][C]26[/C][C]-0.05149[/C][C]-0.4489[/C][C]0.327397[/C][/ROW]
[ROW][C]27[/C][C]-0.052801[/C][C]-0.4603[/C][C]0.323305[/C][/ROW]
[ROW][C]28[/C][C]0.003088[/C][C]0.0269[/C][C]0.489297[/C][/ROW]
[ROW][C]29[/C][C]0.04312[/C][C]0.3759[/C][C]0.354016[/C][/ROW]
[ROW][C]30[/C][C]0.133509[/C][C]1.1639[/C][C]0.124051[/C][/ROW]
[ROW][C]31[/C][C]-0.072302[/C][C]-0.6303[/C][C]0.26519[/C][/ROW]
[ROW][C]32[/C][C]-0.061371[/C][C]-0.535[/C][C]0.2971[/C][/ROW]
[ROW][C]33[/C][C]-0.024635[/C][C]-0.2148[/C][C]0.415265[/C][/ROW]
[ROW][C]34[/C][C]0.102055[/C][C]0.8897[/C][C]0.188219[/C][/ROW]
[ROW][C]35[/C][C]-0.023738[/C][C]-0.2069[/C][C]0.418305[/C][/ROW]
[ROW][C]36[/C][C]-0.084878[/C][C]-0.74[/C][C]0.230804[/C][/ROW]
[ROW][C]37[/C][C]0.006161[/C][C]0.0537[/C][C]0.478652[/C][/ROW]
[ROW][C]38[/C][C]-0.019786[/C][C]-0.1725[/C][C]0.431754[/C][/ROW]
[ROW][C]39[/C][C]-0.026363[/C][C]-0.2298[/C][C]0.409422[/C][/ROW]
[ROW][C]40[/C][C]-0.093466[/C][C]-0.8148[/C][C]0.208861[/C][/ROW]
[ROW][C]41[/C][C]0.016289[/C][C]0.142[/C][C]0.443727[/C][/ROW]
[ROW][C]42[/C][C]0.039241[/C][C]0.3421[/C][C]0.366611[/C][/ROW]
[ROW][C]43[/C][C]-0.010465[/C][C]-0.0912[/C][C]0.463774[/C][/ROW]
[ROW][C]44[/C][C]-0.093513[/C][C]-0.8152[/C][C]0.208744[/C][/ROW]
[ROW][C]45[/C][C]0.00537[/C][C]0.0468[/C][C]0.481392[/C][/ROW]
[ROW][C]46[/C][C]0.042773[/C][C]0.3729[/C][C]0.355135[/C][/ROW]
[ROW][C]47[/C][C]-0.031958[/C][C]-0.2786[/C][C]0.390654[/C][/ROW]
[ROW][C]48[/C][C]-0.024434[/C][C]-0.213[/C][C]0.415944[/C][/ROW]
[/TABLE]
Source: https://freestatistics.org/blog/index.php?pk=75037&T=2

Globally Unique Identifier (entire table): ba.freestatistics.org/blog/index.php?pk=75037&T=2

As an alternative you can also use a QR Code:  

The GUIDs for individual cells are displayed in the table below:

Partial Autocorrelation Function
Time lag kPACF(k)T-STATP-value
10.3051022.65980.004766
20.232552.02730.023068
3-0.283246-2.46930.007892
4-0.34544-3.01150.001764
5-0.325442-2.83710.002916
6-0.097519-0.85010.198957
7-0.271762-2.36920.010184
8-0.295808-2.57880.005923
9-0.097947-0.85390.197926
10-0.121305-1.05750.146814
11-0.039995-0.34870.36415
120.3860423.36546e-04
13-0.154921-1.35060.090421
14-0.229335-1.99930.024576
150.1293761.12790.131461
160.1244651.08510.140662
170.0105530.0920.463469
18-0.10007-0.87240.192871
190.0316420.27580.391708
200.1307321.13970.128996
21-0.213954-1.86520.033006
220.03310.28860.386851
23-0.136631-1.19110.118656
240.1074130.93640.176015
250.0583590.50880.306196
26-0.05149-0.44890.327397
27-0.052801-0.46030.323305
280.0030880.02690.489297
290.043120.37590.354016
300.1335091.16390.124051
31-0.072302-0.63030.26519
32-0.061371-0.5350.2971
33-0.024635-0.21480.415265
340.1020550.88970.188219
35-0.023738-0.20690.418305
36-0.084878-0.740.230804
370.0061610.05370.478652
38-0.019786-0.17250.431754
39-0.026363-0.22980.409422
40-0.093466-0.81480.208861
410.0162890.1420.443727
420.0392410.34210.366611
43-0.010465-0.09120.463774
44-0.093513-0.81520.208744
450.005370.04680.481392
460.0427730.37290.355135
47-0.031958-0.27860.390654
48-0.024434-0.2130.415944


Parameters (Session):
par1 = 48 ; par2 = 1 ; par3 = 1 ; par4 = 0 ; par5 = 12 ; par6 = White Noise ; par7 = 0.95 ;
Parameters (R input):
par1 = 48 ; par2 = 1 ; par3 = 1 ; par4 = 0 ; par5 = 12 ; par6 = White Noise ; par7 = 0.95 ;
R code (references can be found in the software module):
if (par1 == 'Default') {
par1 = 10*log10(length(x))
} else {
par1 <- as.numeric(par1)
}
par2 <- as.numeric(par2)
par3 <- as.numeric(par3)
par4 <- as.numeric(par4)
par5 <- as.numeric(par5)
if (par6 == 'White Noise') par6 <- 'white' else par6 <- 'ma'
par7 <- as.numeric(par7)
if (par2 == 0) {
x <- log(x)
} else {
x <- (x ^ par2 - 1) / par2
}
if (par3 > 0) x <- diff(x,lag=1,difference=par3)
if (par4 > 0) x <- diff(x,lag=par5,difference=par4)
bitmap(file='pic1.png')
racf <- acf(x, par1, main='Autocorrelation', xlab='time lag', ylab='ACF', ci.type=par6, ci=par7, sub=paste('(lambda=',par2,', d=',par3,', D=',par4,', CI=', par7, ', CI type=',par6,')',sep=''))
dev.off()
bitmap(file='pic2.png')
rpacf <- pacf(x,par1,main='Partial Autocorrelation',xlab='lags',ylab='PACF')
dev.off()
(myacf <- c(racf$acf))
(mypacf <- c(rpacf$acf))
lengthx <- length(x)
sqrtn <- sqrt(lengthx)
load(file='createtable')
a<-table.start()
a<-table.row.start(a)
a<-table.element(a,'Autocorrelation Function',4,TRUE)
a<-table.row.end(a)
a<-table.row.start(a)
a<-table.element(a,'Time lag k',header=TRUE)
a<-table.element(a,hyperlink('basics.htm','ACF(k)','click here for more information about the Autocorrelation Function'),header=TRUE)
a<-table.element(a,'T-STAT',header=TRUE)
a<-table.element(a,'P-value',header=TRUE)
a<-table.row.end(a)
for (i in 2:(par1+1)) {
a<-table.row.start(a)
a<-table.element(a,i-1,header=TRUE)
a<-table.element(a,round(myacf[i],6))
mytstat <- myacf[i]*sqrtn
a<-table.element(a,round(mytstat,4))
a<-table.element(a,round(1-pt(abs(mytstat),lengthx),6))
a<-table.row.end(a)
}
a<-table.end(a)
table.save(a,file='mytable.tab')
a<-table.start()
a<-table.row.start(a)
a<-table.element(a,'Partial Autocorrelation Function',4,TRUE)
a<-table.row.end(a)
a<-table.row.start(a)
a<-table.element(a,'Time lag k',header=TRUE)
a<-table.element(a,hyperlink('basics.htm','PACF(k)','click here for more information about the Partial Autocorrelation Function'),header=TRUE)
a<-table.element(a,'T-STAT',header=TRUE)
a<-table.element(a,'P-value',header=TRUE)
a<-table.row.end(a)
for (i in 1:par1) {
a<-table.row.start(a)
a<-table.element(a,i,header=TRUE)
a<-table.element(a,round(mypacf[i],6))
mytstat <- mypacf[i]*sqrtn
a<-table.element(a,round(mytstat,4))
a<-table.element(a,round(1-pt(abs(mytstat),lengthx),6))
a<-table.row.end(a)
}
a<-table.end(a)
table.save(a,file='mytable1.tab')