Free Statistics

of Irreproducible Research!

Author's title

Author*Unverified author*
R Software Modulerwasp_autocorrelation.wasp
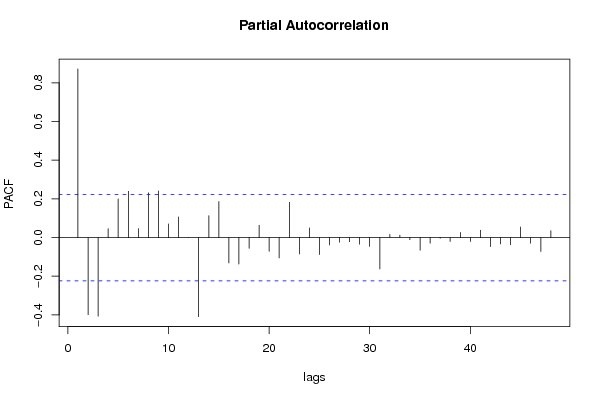
Title produced by software(Partial) Autocorrelation Function
Date of computationThu, 29 Apr 2010 08:08:11 +0000
Cite this page as followsStatistical Computations at FreeStatistics.org, Office for Research Development and Education, URL https://freestatistics.org/blog/index.php?v=date/2010/Apr/29/t1272528617rp1rj0sx6zxfzah.htm/, Retrieved Thu, 25 Apr 2024 05:25:53 +0000
Statistical Computations at FreeStatistics.org, Office for Research Development and Education, URL https://freestatistics.org/blog/index.php?pk=75036, Retrieved Thu, 25 Apr 2024 05:25:53 +0000
QR Codes:

Original text written by user:
IsPrivate?No (this computation is public)
User-defined keywordsKDGP2W21
Estimated Impact227
Family? (F = Feedback message, R = changed R code, M = changed R Module, P = changed Parameters, D = changed Data)
-       [(Partial) Autocorrelation Function] [autocorrelatie - ...] [2010-04-29 08:08:11] [e8bb75392cb2cf20c26f170b87ccd1b7] [Current]
Feedback Forum

Post a new message
Dataseries X:
154
96
73
49
36
59
95
169
210
278
298
245
200
118
90
79
78
91
167
169
289
347
375
203
223
104
107
85
75
99
135
211
335
460
488
326
346
261
224
141
148
145
223
272
445
560
612
467
518
404
300
210
196
186
247
343
464
680
711
610
613
392
273
322
189
257
324
404
677
858
895
664
628
308
324
248
272


Summary of computational transaction
Raw Inputview raw input (R code)
Raw Outputview raw output of R engine
Computing time1 seconds
R Server'Gwilym Jenkins' @ 72.249.127.135

\begin{tabular}{lllllllll}
\hline
Summary of computational transaction \tabularnewline
Raw Input & view raw input (R code)  \tabularnewline
Raw Output & view raw output of R engine  \tabularnewline
Computing time & 1 seconds \tabularnewline
R Server & 'Gwilym Jenkins' @ 72.249.127.135 \tabularnewline
\hline
\end{tabular}
%Source: https://freestatistics.org/blog/index.php?pk=75036&T=0

[TABLE]
[ROW][C]Summary of computational transaction[/C][/ROW]
[ROW][C]Raw Input[/C][C]view raw input (R code) [/C][/ROW]
[ROW][C]Raw Output[/C][C]view raw output of R engine [/C][/ROW]
[ROW][C]Computing time[/C][C]1 seconds[/C][/ROW]
[ROW][C]R Server[/C][C]'Gwilym Jenkins' @ 72.249.127.135[/C][/ROW]
[/TABLE]
Source: https://freestatistics.org/blog/index.php?pk=75036&T=0

Globally Unique Identifier (entire table): ba.freestatistics.org/blog/index.php?pk=75036&T=0

As an alternative you can also use a QR Code:  

The GUIDs for individual cells are displayed in the table below:

Summary of computational transaction
Raw Inputview raw input (R code)
Raw Outputview raw output of R engine
Computing time1 seconds
R Server'Gwilym Jenkins' @ 72.249.127.135


Autocorrelation Function
Time lag kACF(k)T-STATP-value
10.871347.6460
20.6632985.82040
30.3786693.32280.000683
40.1178241.03390.152209
5-0.066521-0.58370.280559
6-0.127973-1.1230.132472
7-0.08949-0.78530.217351
80.0591410.5190.302638
90.2627082.30530.011923
100.4621964.05585.9e-05
110.6176525.41990
120.6757095.92930
130.5746315.04241e-06
140.4069753.57120.000308
150.1908891.6750.048991
16-0.014064-0.12340.451051
17-0.155537-1.36480.088141
18-0.213955-1.87740.032122
19-0.184952-1.62290.054344
20-0.077253-0.67790.249936
210.0664850.58340.280662
220.2240641.96620.026443
230.3412632.99460.001847
240.3956113.47150.000426
250.3305312.90040.002428
260.2141211.87890.032021
270.0435380.3820.351741
28-0.119831-1.05150.148155
29-0.250096-2.19460.015604
30-0.311668-2.73490.003871
31-0.314981-2.76390.003571
32-0.252562-2.21620.014814
33-0.153735-1.3490.090642
34-0.02956-0.25940.398015
350.0730820.64130.261618
360.133131.16820.123164
370.106510.93460.176453
380.032670.28670.387563
39-0.08413-0.73820.231306
40-0.210402-1.84630.034348
41-0.304486-2.67190.004601
42-0.359584-3.15530.001144
43-0.36777-3.22720.000919
44-0.331679-2.91050.002358
45-0.254169-2.23030.014319
46-0.157211-1.37950.085863
47-0.068863-0.60430.273721
48-0.008263-0.07250.471194

\begin{tabular}{lllllllll}
\hline
Autocorrelation Function \tabularnewline
Time lag k & ACF(k) & T-STAT & P-value \tabularnewline
1 & 0.87134 & 7.646 & 0 \tabularnewline
2 & 0.663298 & 5.8204 & 0 \tabularnewline
3 & 0.378669 & 3.3228 & 0.000683 \tabularnewline
4 & 0.117824 & 1.0339 & 0.152209 \tabularnewline
5 & -0.066521 & -0.5837 & 0.280559 \tabularnewline
6 & -0.127973 & -1.123 & 0.132472 \tabularnewline
7 & -0.08949 & -0.7853 & 0.217351 \tabularnewline
8 & 0.059141 & 0.519 & 0.302638 \tabularnewline
9 & 0.262708 & 2.3053 & 0.011923 \tabularnewline
10 & 0.462196 & 4.0558 & 5.9e-05 \tabularnewline
11 & 0.617652 & 5.4199 & 0 \tabularnewline
12 & 0.675709 & 5.9293 & 0 \tabularnewline
13 & 0.574631 & 5.0424 & 1e-06 \tabularnewline
14 & 0.406975 & 3.5712 & 0.000308 \tabularnewline
15 & 0.190889 & 1.675 & 0.048991 \tabularnewline
16 & -0.014064 & -0.1234 & 0.451051 \tabularnewline
17 & -0.155537 & -1.3648 & 0.088141 \tabularnewline
18 & -0.213955 & -1.8774 & 0.032122 \tabularnewline
19 & -0.184952 & -1.6229 & 0.054344 \tabularnewline
20 & -0.077253 & -0.6779 & 0.249936 \tabularnewline
21 & 0.066485 & 0.5834 & 0.280662 \tabularnewline
22 & 0.224064 & 1.9662 & 0.026443 \tabularnewline
23 & 0.341263 & 2.9946 & 0.001847 \tabularnewline
24 & 0.395611 & 3.4715 & 0.000426 \tabularnewline
25 & 0.330531 & 2.9004 & 0.002428 \tabularnewline
26 & 0.214121 & 1.8789 & 0.032021 \tabularnewline
27 & 0.043538 & 0.382 & 0.351741 \tabularnewline
28 & -0.119831 & -1.0515 & 0.148155 \tabularnewline
29 & -0.250096 & -2.1946 & 0.015604 \tabularnewline
30 & -0.311668 & -2.7349 & 0.003871 \tabularnewline
31 & -0.314981 & -2.7639 & 0.003571 \tabularnewline
32 & -0.252562 & -2.2162 & 0.014814 \tabularnewline
33 & -0.153735 & -1.349 & 0.090642 \tabularnewline
34 & -0.02956 & -0.2594 & 0.398015 \tabularnewline
35 & 0.073082 & 0.6413 & 0.261618 \tabularnewline
36 & 0.13313 & 1.1682 & 0.123164 \tabularnewline
37 & 0.10651 & 0.9346 & 0.176453 \tabularnewline
38 & 0.03267 & 0.2867 & 0.387563 \tabularnewline
39 & -0.08413 & -0.7382 & 0.231306 \tabularnewline
40 & -0.210402 & -1.8463 & 0.034348 \tabularnewline
41 & -0.304486 & -2.6719 & 0.004601 \tabularnewline
42 & -0.359584 & -3.1553 & 0.001144 \tabularnewline
43 & -0.36777 & -3.2272 & 0.000919 \tabularnewline
44 & -0.331679 & -2.9105 & 0.002358 \tabularnewline
45 & -0.254169 & -2.2303 & 0.014319 \tabularnewline
46 & -0.157211 & -1.3795 & 0.085863 \tabularnewline
47 & -0.068863 & -0.6043 & 0.273721 \tabularnewline
48 & -0.008263 & -0.0725 & 0.471194 \tabularnewline
\hline
\end{tabular}
%Source: https://freestatistics.org/blog/index.php?pk=75036&T=1

[TABLE]
[ROW][C]Autocorrelation Function[/C][/ROW]
[ROW][C]Time lag k[/C][C]ACF(k)[/C][C]T-STAT[/C][C]P-value[/C][/ROW]
[ROW][C]1[/C][C]0.87134[/C][C]7.646[/C][C]0[/C][/ROW]
[ROW][C]2[/C][C]0.663298[/C][C]5.8204[/C][C]0[/C][/ROW]
[ROW][C]3[/C][C]0.378669[/C][C]3.3228[/C][C]0.000683[/C][/ROW]
[ROW][C]4[/C][C]0.117824[/C][C]1.0339[/C][C]0.152209[/C][/ROW]
[ROW][C]5[/C][C]-0.066521[/C][C]-0.5837[/C][C]0.280559[/C][/ROW]
[ROW][C]6[/C][C]-0.127973[/C][C]-1.123[/C][C]0.132472[/C][/ROW]
[ROW][C]7[/C][C]-0.08949[/C][C]-0.7853[/C][C]0.217351[/C][/ROW]
[ROW][C]8[/C][C]0.059141[/C][C]0.519[/C][C]0.302638[/C][/ROW]
[ROW][C]9[/C][C]0.262708[/C][C]2.3053[/C][C]0.011923[/C][/ROW]
[ROW][C]10[/C][C]0.462196[/C][C]4.0558[/C][C]5.9e-05[/C][/ROW]
[ROW][C]11[/C][C]0.617652[/C][C]5.4199[/C][C]0[/C][/ROW]
[ROW][C]12[/C][C]0.675709[/C][C]5.9293[/C][C]0[/C][/ROW]
[ROW][C]13[/C][C]0.574631[/C][C]5.0424[/C][C]1e-06[/C][/ROW]
[ROW][C]14[/C][C]0.406975[/C][C]3.5712[/C][C]0.000308[/C][/ROW]
[ROW][C]15[/C][C]0.190889[/C][C]1.675[/C][C]0.048991[/C][/ROW]
[ROW][C]16[/C][C]-0.014064[/C][C]-0.1234[/C][C]0.451051[/C][/ROW]
[ROW][C]17[/C][C]-0.155537[/C][C]-1.3648[/C][C]0.088141[/C][/ROW]
[ROW][C]18[/C][C]-0.213955[/C][C]-1.8774[/C][C]0.032122[/C][/ROW]
[ROW][C]19[/C][C]-0.184952[/C][C]-1.6229[/C][C]0.054344[/C][/ROW]
[ROW][C]20[/C][C]-0.077253[/C][C]-0.6779[/C][C]0.249936[/C][/ROW]
[ROW][C]21[/C][C]0.066485[/C][C]0.5834[/C][C]0.280662[/C][/ROW]
[ROW][C]22[/C][C]0.224064[/C][C]1.9662[/C][C]0.026443[/C][/ROW]
[ROW][C]23[/C][C]0.341263[/C][C]2.9946[/C][C]0.001847[/C][/ROW]
[ROW][C]24[/C][C]0.395611[/C][C]3.4715[/C][C]0.000426[/C][/ROW]
[ROW][C]25[/C][C]0.330531[/C][C]2.9004[/C][C]0.002428[/C][/ROW]
[ROW][C]26[/C][C]0.214121[/C][C]1.8789[/C][C]0.032021[/C][/ROW]
[ROW][C]27[/C][C]0.043538[/C][C]0.382[/C][C]0.351741[/C][/ROW]
[ROW][C]28[/C][C]-0.119831[/C][C]-1.0515[/C][C]0.148155[/C][/ROW]
[ROW][C]29[/C][C]-0.250096[/C][C]-2.1946[/C][C]0.015604[/C][/ROW]
[ROW][C]30[/C][C]-0.311668[/C][C]-2.7349[/C][C]0.003871[/C][/ROW]
[ROW][C]31[/C][C]-0.314981[/C][C]-2.7639[/C][C]0.003571[/C][/ROW]
[ROW][C]32[/C][C]-0.252562[/C][C]-2.2162[/C][C]0.014814[/C][/ROW]
[ROW][C]33[/C][C]-0.153735[/C][C]-1.349[/C][C]0.090642[/C][/ROW]
[ROW][C]34[/C][C]-0.02956[/C][C]-0.2594[/C][C]0.398015[/C][/ROW]
[ROW][C]35[/C][C]0.073082[/C][C]0.6413[/C][C]0.261618[/C][/ROW]
[ROW][C]36[/C][C]0.13313[/C][C]1.1682[/C][C]0.123164[/C][/ROW]
[ROW][C]37[/C][C]0.10651[/C][C]0.9346[/C][C]0.176453[/C][/ROW]
[ROW][C]38[/C][C]0.03267[/C][C]0.2867[/C][C]0.387563[/C][/ROW]
[ROW][C]39[/C][C]-0.08413[/C][C]-0.7382[/C][C]0.231306[/C][/ROW]
[ROW][C]40[/C][C]-0.210402[/C][C]-1.8463[/C][C]0.034348[/C][/ROW]
[ROW][C]41[/C][C]-0.304486[/C][C]-2.6719[/C][C]0.004601[/C][/ROW]
[ROW][C]42[/C][C]-0.359584[/C][C]-3.1553[/C][C]0.001144[/C][/ROW]
[ROW][C]43[/C][C]-0.36777[/C][C]-3.2272[/C][C]0.000919[/C][/ROW]
[ROW][C]44[/C][C]-0.331679[/C][C]-2.9105[/C][C]0.002358[/C][/ROW]
[ROW][C]45[/C][C]-0.254169[/C][C]-2.2303[/C][C]0.014319[/C][/ROW]
[ROW][C]46[/C][C]-0.157211[/C][C]-1.3795[/C][C]0.085863[/C][/ROW]
[ROW][C]47[/C][C]-0.068863[/C][C]-0.6043[/C][C]0.273721[/C][/ROW]
[ROW][C]48[/C][C]-0.008263[/C][C]-0.0725[/C][C]0.471194[/C][/ROW]
[/TABLE]
Source: https://freestatistics.org/blog/index.php?pk=75036&T=1

Globally Unique Identifier (entire table): ba.freestatistics.org/blog/index.php?pk=75036&T=1

As an alternative you can also use a QR Code:  

The GUIDs for individual cells are displayed in the table below:

Autocorrelation Function
Time lag kACF(k)T-STATP-value
10.871347.6460
20.6632985.82040
30.3786693.32280.000683
40.1178241.03390.152209
5-0.066521-0.58370.280559
6-0.127973-1.1230.132472
7-0.08949-0.78530.217351
80.0591410.5190.302638
90.2627082.30530.011923
100.4621964.05585.9e-05
110.6176525.41990
120.6757095.92930
130.5746315.04241e-06
140.4069753.57120.000308
150.1908891.6750.048991
16-0.014064-0.12340.451051
17-0.155537-1.36480.088141
18-0.213955-1.87740.032122
19-0.184952-1.62290.054344
20-0.077253-0.67790.249936
210.0664850.58340.280662
220.2240641.96620.026443
230.3412632.99460.001847
240.3956113.47150.000426
250.3305312.90040.002428
260.2141211.87890.032021
270.0435380.3820.351741
28-0.119831-1.05150.148155
29-0.250096-2.19460.015604
30-0.311668-2.73490.003871
31-0.314981-2.76390.003571
32-0.252562-2.21620.014814
33-0.153735-1.3490.090642
34-0.02956-0.25940.398015
350.0730820.64130.261618
360.133131.16820.123164
370.106510.93460.176453
380.032670.28670.387563
39-0.08413-0.73820.231306
40-0.210402-1.84630.034348
41-0.304486-2.67190.004601
42-0.359584-3.15530.001144
43-0.36777-3.22720.000919
44-0.331679-2.91050.002358
45-0.254169-2.23030.014319
46-0.157211-1.37950.085863
47-0.068863-0.60430.273721
48-0.008263-0.07250.471194


Partial Autocorrelation Function
Time lag kPACF(k)T-STATP-value
10.871347.6460
2-0.398463-3.49650.000393
3-0.406771-3.56940.00031
40.0457880.40180.344475
50.1997121.75250.041837
60.2388762.09610.019678
70.0461840.40530.343203
80.2314222.03070.022868
90.2409882.11470.018847
100.0700670.61480.270237
110.106240.93230.17706
12-0.001008-0.00880.496483
13-0.408889-3.5880.000292
140.1127040.9890.162886
150.1861591.63350.053219
16-0.131047-1.14990.126866
17-0.137231-1.20420.1161
18-0.055397-0.48610.314135
190.0636780.55880.288969
20-0.071203-0.62480.266972
21-0.105721-0.92770.178232
220.1822031.59880.056978
23-0.084839-0.74450.229432
240.0495940.43520.332323
25-0.088062-0.77270.221021
26-0.037951-0.3330.370013
27-0.023757-0.20850.417706
28-0.021444-0.18820.42562
29-0.03413-0.29950.382686
30-0.045725-0.40120.344679
31-0.16206-1.42210.079522
320.0162420.14250.443519
330.0122940.10790.457186
34-0.011024-0.09670.461595
35-0.065111-0.57130.284714
36-0.029047-0.25490.399746
37-0.004137-0.03630.485568
38-0.020096-0.17630.430244
390.0263760.23140.40879
40-0.019978-0.17530.430651
410.0377170.3310.370785
42-0.046672-0.40950.341639
43-0.033117-0.29060.386068
44-0.037505-0.32910.371486
450.054460.47790.317045
46-0.029257-0.25670.399035
47-0.072015-0.63190.264651
480.0352550.30940.378942

\begin{tabular}{lllllllll}
\hline
Partial Autocorrelation Function \tabularnewline
Time lag k & PACF(k) & T-STAT & P-value \tabularnewline
1 & 0.87134 & 7.646 & 0 \tabularnewline
2 & -0.398463 & -3.4965 & 0.000393 \tabularnewline
3 & -0.406771 & -3.5694 & 0.00031 \tabularnewline
4 & 0.045788 & 0.4018 & 0.344475 \tabularnewline
5 & 0.199712 & 1.7525 & 0.041837 \tabularnewline
6 & 0.238876 & 2.0961 & 0.019678 \tabularnewline
7 & 0.046184 & 0.4053 & 0.343203 \tabularnewline
8 & 0.231422 & 2.0307 & 0.022868 \tabularnewline
9 & 0.240988 & 2.1147 & 0.018847 \tabularnewline
10 & 0.070067 & 0.6148 & 0.270237 \tabularnewline
11 & 0.10624 & 0.9323 & 0.17706 \tabularnewline
12 & -0.001008 & -0.0088 & 0.496483 \tabularnewline
13 & -0.408889 & -3.588 & 0.000292 \tabularnewline
14 & 0.112704 & 0.989 & 0.162886 \tabularnewline
15 & 0.186159 & 1.6335 & 0.053219 \tabularnewline
16 & -0.131047 & -1.1499 & 0.126866 \tabularnewline
17 & -0.137231 & -1.2042 & 0.1161 \tabularnewline
18 & -0.055397 & -0.4861 & 0.314135 \tabularnewline
19 & 0.063678 & 0.5588 & 0.288969 \tabularnewline
20 & -0.071203 & -0.6248 & 0.266972 \tabularnewline
21 & -0.105721 & -0.9277 & 0.178232 \tabularnewline
22 & 0.182203 & 1.5988 & 0.056978 \tabularnewline
23 & -0.084839 & -0.7445 & 0.229432 \tabularnewline
24 & 0.049594 & 0.4352 & 0.332323 \tabularnewline
25 & -0.088062 & -0.7727 & 0.221021 \tabularnewline
26 & -0.037951 & -0.333 & 0.370013 \tabularnewline
27 & -0.023757 & -0.2085 & 0.417706 \tabularnewline
28 & -0.021444 & -0.1882 & 0.42562 \tabularnewline
29 & -0.03413 & -0.2995 & 0.382686 \tabularnewline
30 & -0.045725 & -0.4012 & 0.344679 \tabularnewline
31 & -0.16206 & -1.4221 & 0.079522 \tabularnewline
32 & 0.016242 & 0.1425 & 0.443519 \tabularnewline
33 & 0.012294 & 0.1079 & 0.457186 \tabularnewline
34 & -0.011024 & -0.0967 & 0.461595 \tabularnewline
35 & -0.065111 & -0.5713 & 0.284714 \tabularnewline
36 & -0.029047 & -0.2549 & 0.399746 \tabularnewline
37 & -0.004137 & -0.0363 & 0.485568 \tabularnewline
38 & -0.020096 & -0.1763 & 0.430244 \tabularnewline
39 & 0.026376 & 0.2314 & 0.40879 \tabularnewline
40 & -0.019978 & -0.1753 & 0.430651 \tabularnewline
41 & 0.037717 & 0.331 & 0.370785 \tabularnewline
42 & -0.046672 & -0.4095 & 0.341639 \tabularnewline
43 & -0.033117 & -0.2906 & 0.386068 \tabularnewline
44 & -0.037505 & -0.3291 & 0.371486 \tabularnewline
45 & 0.05446 & 0.4779 & 0.317045 \tabularnewline
46 & -0.029257 & -0.2567 & 0.399035 \tabularnewline
47 & -0.072015 & -0.6319 & 0.264651 \tabularnewline
48 & 0.035255 & 0.3094 & 0.378942 \tabularnewline
\hline
\end{tabular}
%Source: https://freestatistics.org/blog/index.php?pk=75036&T=2

[TABLE]
[ROW][C]Partial Autocorrelation Function[/C][/ROW]
[ROW][C]Time lag k[/C][C]PACF(k)[/C][C]T-STAT[/C][C]P-value[/C][/ROW]
[ROW][C]1[/C][C]0.87134[/C][C]7.646[/C][C]0[/C][/ROW]
[ROW][C]2[/C][C]-0.398463[/C][C]-3.4965[/C][C]0.000393[/C][/ROW]
[ROW][C]3[/C][C]-0.406771[/C][C]-3.5694[/C][C]0.00031[/C][/ROW]
[ROW][C]4[/C][C]0.045788[/C][C]0.4018[/C][C]0.344475[/C][/ROW]
[ROW][C]5[/C][C]0.199712[/C][C]1.7525[/C][C]0.041837[/C][/ROW]
[ROW][C]6[/C][C]0.238876[/C][C]2.0961[/C][C]0.019678[/C][/ROW]
[ROW][C]7[/C][C]0.046184[/C][C]0.4053[/C][C]0.343203[/C][/ROW]
[ROW][C]8[/C][C]0.231422[/C][C]2.0307[/C][C]0.022868[/C][/ROW]
[ROW][C]9[/C][C]0.240988[/C][C]2.1147[/C][C]0.018847[/C][/ROW]
[ROW][C]10[/C][C]0.070067[/C][C]0.6148[/C][C]0.270237[/C][/ROW]
[ROW][C]11[/C][C]0.10624[/C][C]0.9323[/C][C]0.17706[/C][/ROW]
[ROW][C]12[/C][C]-0.001008[/C][C]-0.0088[/C][C]0.496483[/C][/ROW]
[ROW][C]13[/C][C]-0.408889[/C][C]-3.588[/C][C]0.000292[/C][/ROW]
[ROW][C]14[/C][C]0.112704[/C][C]0.989[/C][C]0.162886[/C][/ROW]
[ROW][C]15[/C][C]0.186159[/C][C]1.6335[/C][C]0.053219[/C][/ROW]
[ROW][C]16[/C][C]-0.131047[/C][C]-1.1499[/C][C]0.126866[/C][/ROW]
[ROW][C]17[/C][C]-0.137231[/C][C]-1.2042[/C][C]0.1161[/C][/ROW]
[ROW][C]18[/C][C]-0.055397[/C][C]-0.4861[/C][C]0.314135[/C][/ROW]
[ROW][C]19[/C][C]0.063678[/C][C]0.5588[/C][C]0.288969[/C][/ROW]
[ROW][C]20[/C][C]-0.071203[/C][C]-0.6248[/C][C]0.266972[/C][/ROW]
[ROW][C]21[/C][C]-0.105721[/C][C]-0.9277[/C][C]0.178232[/C][/ROW]
[ROW][C]22[/C][C]0.182203[/C][C]1.5988[/C][C]0.056978[/C][/ROW]
[ROW][C]23[/C][C]-0.084839[/C][C]-0.7445[/C][C]0.229432[/C][/ROW]
[ROW][C]24[/C][C]0.049594[/C][C]0.4352[/C][C]0.332323[/C][/ROW]
[ROW][C]25[/C][C]-0.088062[/C][C]-0.7727[/C][C]0.221021[/C][/ROW]
[ROW][C]26[/C][C]-0.037951[/C][C]-0.333[/C][C]0.370013[/C][/ROW]
[ROW][C]27[/C][C]-0.023757[/C][C]-0.2085[/C][C]0.417706[/C][/ROW]
[ROW][C]28[/C][C]-0.021444[/C][C]-0.1882[/C][C]0.42562[/C][/ROW]
[ROW][C]29[/C][C]-0.03413[/C][C]-0.2995[/C][C]0.382686[/C][/ROW]
[ROW][C]30[/C][C]-0.045725[/C][C]-0.4012[/C][C]0.344679[/C][/ROW]
[ROW][C]31[/C][C]-0.16206[/C][C]-1.4221[/C][C]0.079522[/C][/ROW]
[ROW][C]32[/C][C]0.016242[/C][C]0.1425[/C][C]0.443519[/C][/ROW]
[ROW][C]33[/C][C]0.012294[/C][C]0.1079[/C][C]0.457186[/C][/ROW]
[ROW][C]34[/C][C]-0.011024[/C][C]-0.0967[/C][C]0.461595[/C][/ROW]
[ROW][C]35[/C][C]-0.065111[/C][C]-0.5713[/C][C]0.284714[/C][/ROW]
[ROW][C]36[/C][C]-0.029047[/C][C]-0.2549[/C][C]0.399746[/C][/ROW]
[ROW][C]37[/C][C]-0.004137[/C][C]-0.0363[/C][C]0.485568[/C][/ROW]
[ROW][C]38[/C][C]-0.020096[/C][C]-0.1763[/C][C]0.430244[/C][/ROW]
[ROW][C]39[/C][C]0.026376[/C][C]0.2314[/C][C]0.40879[/C][/ROW]
[ROW][C]40[/C][C]-0.019978[/C][C]-0.1753[/C][C]0.430651[/C][/ROW]
[ROW][C]41[/C][C]0.037717[/C][C]0.331[/C][C]0.370785[/C][/ROW]
[ROW][C]42[/C][C]-0.046672[/C][C]-0.4095[/C][C]0.341639[/C][/ROW]
[ROW][C]43[/C][C]-0.033117[/C][C]-0.2906[/C][C]0.386068[/C][/ROW]
[ROW][C]44[/C][C]-0.037505[/C][C]-0.3291[/C][C]0.371486[/C][/ROW]
[ROW][C]45[/C][C]0.05446[/C][C]0.4779[/C][C]0.317045[/C][/ROW]
[ROW][C]46[/C][C]-0.029257[/C][C]-0.2567[/C][C]0.399035[/C][/ROW]
[ROW][C]47[/C][C]-0.072015[/C][C]-0.6319[/C][C]0.264651[/C][/ROW]
[ROW][C]48[/C][C]0.035255[/C][C]0.3094[/C][C]0.378942[/C][/ROW]
[/TABLE]
Source: https://freestatistics.org/blog/index.php?pk=75036&T=2

Globally Unique Identifier (entire table): ba.freestatistics.org/blog/index.php?pk=75036&T=2

As an alternative you can also use a QR Code:  

The GUIDs for individual cells are displayed in the table below:

Partial Autocorrelation Function
Time lag kPACF(k)T-STATP-value
10.871347.6460
2-0.398463-3.49650.000393
3-0.406771-3.56940.00031
40.0457880.40180.344475
50.1997121.75250.041837
60.2388762.09610.019678
70.0461840.40530.343203
80.2314222.03070.022868
90.2409882.11470.018847
100.0700670.61480.270237
110.106240.93230.17706
12-0.001008-0.00880.496483
13-0.408889-3.5880.000292
140.1127040.9890.162886
150.1861591.63350.053219
16-0.131047-1.14990.126866
17-0.137231-1.20420.1161
18-0.055397-0.48610.314135
190.0636780.55880.288969
20-0.071203-0.62480.266972
21-0.105721-0.92770.178232
220.1822031.59880.056978
23-0.084839-0.74450.229432
240.0495940.43520.332323
25-0.088062-0.77270.221021
26-0.037951-0.3330.370013
27-0.023757-0.20850.417706
28-0.021444-0.18820.42562
29-0.03413-0.29950.382686
30-0.045725-0.40120.344679
31-0.16206-1.42210.079522
320.0162420.14250.443519
330.0122940.10790.457186
34-0.011024-0.09670.461595
35-0.065111-0.57130.284714
36-0.029047-0.25490.399746
37-0.004137-0.03630.485568
38-0.020096-0.17630.430244
390.0263760.23140.40879
40-0.019978-0.17530.430651
410.0377170.3310.370785
42-0.046672-0.40950.341639
43-0.033117-0.29060.386068
44-0.037505-0.32910.371486
450.054460.47790.317045
46-0.029257-0.25670.399035
47-0.072015-0.63190.264651
480.0352550.30940.378942


Parameters (Session):
par1 = 48 ; par2 = 1 ; par3 = 0 ; par4 = 0 ; par5 = 12 ; par6 = White Noise ; par7 = 0.95 ;
Parameters (R input):
par1 = 48 ; par2 = 1 ; par3 = 0 ; par4 = 0 ; par5 = 12 ; par6 = White Noise ; par7 = 0.95 ;
R code (references can be found in the software module):
if (par1 == 'Default') {
par1 = 10*log10(length(x))
} else {
par1 <- as.numeric(par1)
}
par2 <- as.numeric(par2)
par3 <- as.numeric(par3)
par4 <- as.numeric(par4)
par5 <- as.numeric(par5)
if (par6 == 'White Noise') par6 <- 'white' else par6 <- 'ma'
par7 <- as.numeric(par7)
if (par2 == 0) {
x <- log(x)
} else {
x <- (x ^ par2 - 1) / par2
}
if (par3 > 0) x <- diff(x,lag=1,difference=par3)
if (par4 > 0) x <- diff(x,lag=par5,difference=par4)
bitmap(file='pic1.png')
racf <- acf(x, par1, main='Autocorrelation', xlab='time lag', ylab='ACF', ci.type=par6, ci=par7, sub=paste('(lambda=',par2,', d=',par3,', D=',par4,', CI=', par7, ', CI type=',par6,')',sep=''))
dev.off()
bitmap(file='pic2.png')
rpacf <- pacf(x,par1,main='Partial Autocorrelation',xlab='lags',ylab='PACF')
dev.off()
(myacf <- c(racf$acf))
(mypacf <- c(rpacf$acf))
lengthx <- length(x)
sqrtn <- sqrt(lengthx)
load(file='createtable')
a<-table.start()
a<-table.row.start(a)
a<-table.element(a,'Autocorrelation Function',4,TRUE)
a<-table.row.end(a)
a<-table.row.start(a)
a<-table.element(a,'Time lag k',header=TRUE)
a<-table.element(a,hyperlink('basics.htm','ACF(k)','click here for more information about the Autocorrelation Function'),header=TRUE)
a<-table.element(a,'T-STAT',header=TRUE)
a<-table.element(a,'P-value',header=TRUE)
a<-table.row.end(a)
for (i in 2:(par1+1)) {
a<-table.row.start(a)
a<-table.element(a,i-1,header=TRUE)
a<-table.element(a,round(myacf[i],6))
mytstat <- myacf[i]*sqrtn
a<-table.element(a,round(mytstat,4))
a<-table.element(a,round(1-pt(abs(mytstat),lengthx),6))
a<-table.row.end(a)
}
a<-table.end(a)
table.save(a,file='mytable.tab')
a<-table.start()
a<-table.row.start(a)
a<-table.element(a,'Partial Autocorrelation Function',4,TRUE)
a<-table.row.end(a)
a<-table.row.start(a)
a<-table.element(a,'Time lag k',header=TRUE)
a<-table.element(a,hyperlink('basics.htm','PACF(k)','click here for more information about the Partial Autocorrelation Function'),header=TRUE)
a<-table.element(a,'T-STAT',header=TRUE)
a<-table.element(a,'P-value',header=TRUE)
a<-table.row.end(a)
for (i in 1:par1) {
a<-table.row.start(a)
a<-table.element(a,i,header=TRUE)
a<-table.element(a,round(mypacf[i],6))
mytstat <- mypacf[i]*sqrtn
a<-table.element(a,round(mytstat,4))
a<-table.element(a,round(1-pt(abs(mytstat),lengthx),6))
a<-table.row.end(a)
}
a<-table.end(a)
table.save(a,file='mytable1.tab')