Free Statistics
of Irreproducible Research!
Description of Statistical Computation | |||||||||||||||||||||
|---|---|---|---|---|---|---|---|---|---|---|---|---|---|---|---|---|---|---|---|---|---|
| Author's title | |||||||||||||||||||||
| Author | *Unverified author* | ||||||||||||||||||||
| R Software Module | rwasp_meanplot.wasp | ||||||||||||||||||||
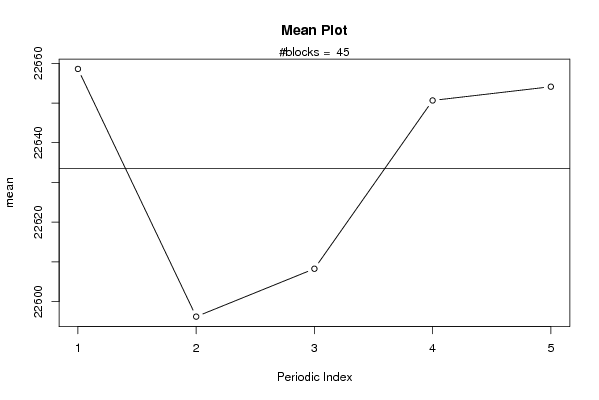
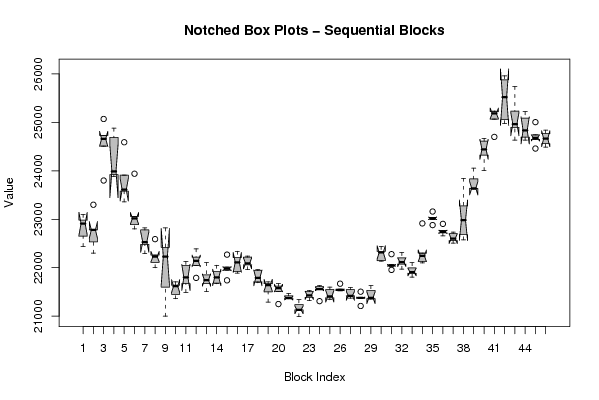
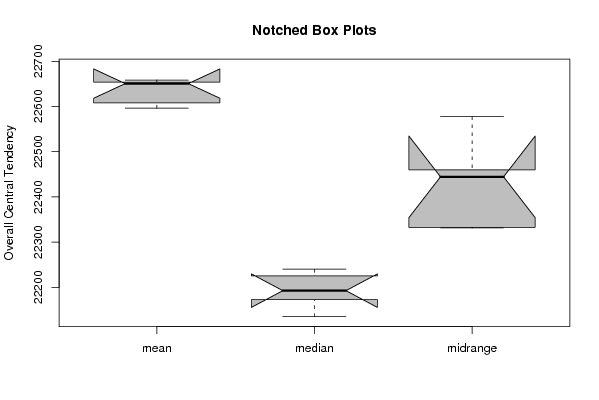
| Title produced by software | Mean Plot | ||||||||||||||||||||
| Date of computation | Wed, 28 Apr 2010 22:05:17 +0000 | ||||||||||||||||||||
| Cite this page as follows | Statistical Computations at FreeStatistics.org, Office for Research Development and Education, URL https://freestatistics.org/blog/index.php?v=date/2010/Apr/29/t1272492420np85oentfpfr10x.htm/, Retrieved Wed, 24 Apr 2024 13:22:33 +0000 | ||||||||||||||||||||
| Statistical Computations at FreeStatistics.org, Office for Research Development and Education, URL https://freestatistics.org/blog/index.php?pk=75029, Retrieved Wed, 24 Apr 2024 13:22:33 +0000 | |||||||||||||||||||||
| QR Codes: | |||||||||||||||||||||
|
| |||||||||||||||||||||
| Original text written by user: | Laurens-Jan - Opgave 6 eigen reeks, goudkoers | ||||||||||||||||||||
| IsPrivate? | No (this computation is public) | ||||||||||||||||||||
| User-defined keywords | KDGP2W12 | ||||||||||||||||||||
| Estimated Impact | 219 | ||||||||||||||||||||
Tree of Dependent Computations | |||||||||||||||||||||
| Family? (F = Feedback message, R = changed R code, M = changed R Module, P = changed Parameters, D = changed Data) | |||||||||||||||||||||
| - [Mean Plot] [Goudkoers Brussel...] [2010-04-28 22:05:17] [52430d682409e27a0d0e07da361cea73] [Current] - RMP [Univariate Data Series] [Opgave 6: Goudkoe...] [2010-06-04 13:00:05] [6161c2e3b695d45e6326d4bda3093101] - RMP [Univariate Data Series] [Opgave 6: Goudkoe...] [2010-06-04 13:02:02] [6161c2e3b695d45e6326d4bda3093101] | |||||||||||||||||||||
| Feedback Forum | |||||||||||||||||||||
Post a new message | |||||||||||||||||||||
Dataset | |||||||||||||||||||||
| Dataseries X: | |||||||||||||||||||||
23100 22650 22440 22910 22980 22535 22300 22780 22780 23300 23800 24510 24660 24730 25070 24690 24880 23920 23880 23990 24590 23610 23580 23360 23910 23940 23060 22800 23020 22890 22780 22530 22290 22820 22480 22110 22000 22230 22260 22590 22820 22420 22230 21600 21000 21360 21640 21450 21710 21620 21800 21490 21670 22130 22050 22050 22140 22390 22220 21790 21510 21670 21745 21850 22105 22050 21670 21680 21800 21920 21980 22270 21740 21950 22010 21890 21920 22110 22340 22210 22240 21960 22220 22060 22090 21960 21940 21790 21710 21690 21710 21670 21640 21500 21290 21250 21580 21670 21620 21510 21360 21420 21470 21370 21370 21340 21130 21130 20990 21240 21320 21430 21390 21530 21510 21630 21560 21610 21560 21310 21340 21410 21550 21380 21600 21530 21560 21670 21540 21540 21550 21590 21420 21420 21370 21380 21210 21505 21365 21385 21350 21360 21530 21380 21630 22145 22315 22340 22440 22135 21955 22060 22050 22035 22280 22315 22205 21970 22075 22115 22105 21885 21805 21910 21995 22245 22100 22130 22300 22915 23040 22880 23000 23160 23020 22770 22660 22740 22905 22720 22705 22735 22600 22510 22560 22575 22685 22980 23275 23845 23640 23640 23835 23625 24055 24005 24325 24445 24670 24615 24700 25065 25185 25220 25235 24975 25055 25520 25880 25960 25740 24965 25235 24895 24635 24835 24635 24695 25090 25220 24740 25005 24650 24460 24680 24840 24630 24490 24695 | |||||||||||||||||||||
Tables (Output of Computation) | |||||||||||||||||||||
| |||||||||||||||||||||
Figures (Output of Computation) | |||||||||||||||||||||
Input Parameters & R Code | |||||||||||||||||||||
| Parameters (Session): | |||||||||||||||||||||
| par1 = 5 ; | |||||||||||||||||||||
| Parameters (R input): | |||||||||||||||||||||
| par1 = 5 ; | |||||||||||||||||||||
| R code (references can be found in the software module): | |||||||||||||||||||||
par1 <- as.numeric(par1) | |||||||||||||||||||||