Free Statistics

of Irreproducible Research!

Author's title

Author*Unverified author*
R Software Modulerwasp_autocorrelation.wasp
Title produced by software(Partial) Autocorrelation Function
Date of computationWed, 28 Apr 2010 16:02:27 +0000
Cite this page as followsStatistical Computations at FreeStatistics.org, Office for Research Development and Education, URL https://freestatistics.org/blog/index.php?v=date/2010/Apr/28/t12724706271s6h8fzy21liwc7.htm/, Retrieved Fri, 26 Apr 2024 16:30:50 +0000
Statistical Computations at FreeStatistics.org, Office for Research Development and Education, URL https://freestatistics.org/blog/index.php?pk=74988, Retrieved Fri, 26 Apr 2024 16:30:50 +0000
QR Codes:

Original text written by user:
IsPrivate?No (this computation is public)
User-defined keywordsKDGP2W21
Estimated Impact149
Family? (F = Feedback message, R = changed R code, M = changed R Module, P = changed Parameters, D = changed Data)
-       [(Partial) Autocorrelation Function] [Autocorrelatie - ...] [2010-04-28 16:02:27] [615289131d9f16e370470ddcc9ade44c] [Current]
Feedback Forum

Post a new message
Dataseries X:
25204
24977
24320
22680
22052
21467
21383
21777
21928
21814
22937
23595
20830
19650
19195
19644
18483
18079
19178
18391
18441
18584
20108
20148
19394
17745
17696
17032
16438
15683
15594
15713
15937
16171
15928
16348
15579
15305
15648
14954
15137
15839
16050
15168
17064
16005
14886
14931
14544
13812
13031
12574
11964
11451
11346
11353
10702
10646
10556
10463
10407
10625
10872
10805
10653
10574
10431
10383
10296
10872
10635
10297
10570


Summary of computational transaction
Raw Inputview raw input (R code)
Raw Outputview raw output of R engine
Computing time2 seconds
R Server'Sir Ronald Aylmer Fisher' @ 193.190.124.24

\begin{tabular}{lllllllll}
\hline
Summary of computational transaction \tabularnewline
Raw Input & view raw input (R code)  \tabularnewline
Raw Output & view raw output of R engine  \tabularnewline
Computing time & 2 seconds \tabularnewline
R Server & 'Sir Ronald Aylmer Fisher' @ 193.190.124.24 \tabularnewline
\hline
\end{tabular}
%Source: https://freestatistics.org/blog/index.php?pk=74988&T=0

[TABLE]
[ROW][C]Summary of computational transaction[/C][/ROW]
[ROW][C]Raw Input[/C][C]view raw input (R code) [/C][/ROW]
[ROW][C]Raw Output[/C][C]view raw output of R engine [/C][/ROW]
[ROW][C]Computing time[/C][C]2 seconds[/C][/ROW]
[ROW][C]R Server[/C][C]'Sir Ronald Aylmer Fisher' @ 193.190.124.24[/C][/ROW]
[/TABLE]
Source: https://freestatistics.org/blog/index.php?pk=74988&T=0

Globally Unique Identifier (entire table): ba.freestatistics.org/blog/index.php?pk=74988&T=0

As an alternative you can also use a QR Code:  

The GUIDs for individual cells are displayed in the table below:

Summary of computational transaction
Raw Inputview raw input (R code)
Raw Outputview raw output of R engine
Computing time2 seconds
R Server'Sir Ronald Aylmer Fisher' @ 193.190.124.24


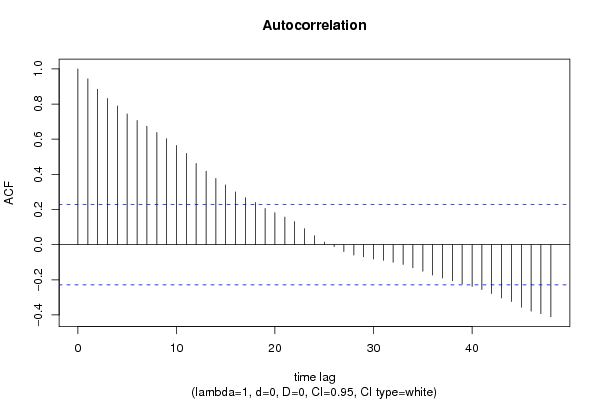
Autocorrelation Function
Time lag kACF(k)T-STATP-value
10.9437988.06380
20.8844497.55670
30.8323217.11140
40.7890796.74190
50.743626.35350
60.706486.03620
70.6743095.76130
80.6387915.45780
90.6027455.14991e-06
100.5646924.82474e-06
110.5188594.43311.6e-05
120.4617813.94559.1e-05
130.4178213.56990.000318
140.3771423.22230.000951
150.3394632.90040.002461
160.299412.55820.006299
170.2670072.28130.012724
180.2403142.05320.021816
190.2063571.76310.041033
200.1820021.5550.062133
210.1569891.34130.091988
220.1311631.12070.133054
230.0904880.77310.220972
240.0503650.43030.334115
250.0147230.12580.450121
26-0.010645-0.0910.463889
27-0.038756-0.33110.370748
28-0.059469-0.50810.306457
29-0.069304-0.59210.277795
30-0.081435-0.69580.244387
31-0.088949-0.760.224857
32-0.099782-0.85250.198352
33-0.112347-0.95990.170139
34-0.131513-1.12360.132423
35-0.150784-1.28830.100856
36-0.173069-1.47870.071761
37-0.190252-1.62550.054182
38-0.205368-1.75470.041756
39-0.22428-1.91630.029624
40-0.237591-2.030.023002
41-0.255296-2.18130.016193
42-0.278031-2.37550.010076
43-0.303-2.58880.005808
44-0.323453-2.76360.003616
45-0.355512-3.03750.001654
46-0.378534-3.23420.000917
47-0.39274-3.35560.00063
48-0.409724-3.50070.000398

\begin{tabular}{lllllllll}
\hline
Autocorrelation Function \tabularnewline
Time lag k & ACF(k) & T-STAT & P-value \tabularnewline
1 & 0.943798 & 8.0638 & 0 \tabularnewline
2 & 0.884449 & 7.5567 & 0 \tabularnewline
3 & 0.832321 & 7.1114 & 0 \tabularnewline
4 & 0.789079 & 6.7419 & 0 \tabularnewline
5 & 0.74362 & 6.3535 & 0 \tabularnewline
6 & 0.70648 & 6.0362 & 0 \tabularnewline
7 & 0.674309 & 5.7613 & 0 \tabularnewline
8 & 0.638791 & 5.4578 & 0 \tabularnewline
9 & 0.602745 & 5.1499 & 1e-06 \tabularnewline
10 & 0.564692 & 4.8247 & 4e-06 \tabularnewline
11 & 0.518859 & 4.4331 & 1.6e-05 \tabularnewline
12 & 0.461781 & 3.9455 & 9.1e-05 \tabularnewline
13 & 0.417821 & 3.5699 & 0.000318 \tabularnewline
14 & 0.377142 & 3.2223 & 0.000951 \tabularnewline
15 & 0.339463 & 2.9004 & 0.002461 \tabularnewline
16 & 0.29941 & 2.5582 & 0.006299 \tabularnewline
17 & 0.267007 & 2.2813 & 0.012724 \tabularnewline
18 & 0.240314 & 2.0532 & 0.021816 \tabularnewline
19 & 0.206357 & 1.7631 & 0.041033 \tabularnewline
20 & 0.182002 & 1.555 & 0.062133 \tabularnewline
21 & 0.156989 & 1.3413 & 0.091988 \tabularnewline
22 & 0.131163 & 1.1207 & 0.133054 \tabularnewline
23 & 0.090488 & 0.7731 & 0.220972 \tabularnewline
24 & 0.050365 & 0.4303 & 0.334115 \tabularnewline
25 & 0.014723 & 0.1258 & 0.450121 \tabularnewline
26 & -0.010645 & -0.091 & 0.463889 \tabularnewline
27 & -0.038756 & -0.3311 & 0.370748 \tabularnewline
28 & -0.059469 & -0.5081 & 0.306457 \tabularnewline
29 & -0.069304 & -0.5921 & 0.277795 \tabularnewline
30 & -0.081435 & -0.6958 & 0.244387 \tabularnewline
31 & -0.088949 & -0.76 & 0.224857 \tabularnewline
32 & -0.099782 & -0.8525 & 0.198352 \tabularnewline
33 & -0.112347 & -0.9599 & 0.170139 \tabularnewline
34 & -0.131513 & -1.1236 & 0.132423 \tabularnewline
35 & -0.150784 & -1.2883 & 0.100856 \tabularnewline
36 & -0.173069 & -1.4787 & 0.071761 \tabularnewline
37 & -0.190252 & -1.6255 & 0.054182 \tabularnewline
38 & -0.205368 & -1.7547 & 0.041756 \tabularnewline
39 & -0.22428 & -1.9163 & 0.029624 \tabularnewline
40 & -0.237591 & -2.03 & 0.023002 \tabularnewline
41 & -0.255296 & -2.1813 & 0.016193 \tabularnewline
42 & -0.278031 & -2.3755 & 0.010076 \tabularnewline
43 & -0.303 & -2.5888 & 0.005808 \tabularnewline
44 & -0.323453 & -2.7636 & 0.003616 \tabularnewline
45 & -0.355512 & -3.0375 & 0.001654 \tabularnewline
46 & -0.378534 & -3.2342 & 0.000917 \tabularnewline
47 & -0.39274 & -3.3556 & 0.00063 \tabularnewline
48 & -0.409724 & -3.5007 & 0.000398 \tabularnewline
\hline
\end{tabular}
%Source: https://freestatistics.org/blog/index.php?pk=74988&T=1

[TABLE]
[ROW][C]Autocorrelation Function[/C][/ROW]
[ROW][C]Time lag k[/C][C]ACF(k)[/C][C]T-STAT[/C][C]P-value[/C][/ROW]
[ROW][C]1[/C][C]0.943798[/C][C]8.0638[/C][C]0[/C][/ROW]
[ROW][C]2[/C][C]0.884449[/C][C]7.5567[/C][C]0[/C][/ROW]
[ROW][C]3[/C][C]0.832321[/C][C]7.1114[/C][C]0[/C][/ROW]
[ROW][C]4[/C][C]0.789079[/C][C]6.7419[/C][C]0[/C][/ROW]
[ROW][C]5[/C][C]0.74362[/C][C]6.3535[/C][C]0[/C][/ROW]
[ROW][C]6[/C][C]0.70648[/C][C]6.0362[/C][C]0[/C][/ROW]
[ROW][C]7[/C][C]0.674309[/C][C]5.7613[/C][C]0[/C][/ROW]
[ROW][C]8[/C][C]0.638791[/C][C]5.4578[/C][C]0[/C][/ROW]
[ROW][C]9[/C][C]0.602745[/C][C]5.1499[/C][C]1e-06[/C][/ROW]
[ROW][C]10[/C][C]0.564692[/C][C]4.8247[/C][C]4e-06[/C][/ROW]
[ROW][C]11[/C][C]0.518859[/C][C]4.4331[/C][C]1.6e-05[/C][/ROW]
[ROW][C]12[/C][C]0.461781[/C][C]3.9455[/C][C]9.1e-05[/C][/ROW]
[ROW][C]13[/C][C]0.417821[/C][C]3.5699[/C][C]0.000318[/C][/ROW]
[ROW][C]14[/C][C]0.377142[/C][C]3.2223[/C][C]0.000951[/C][/ROW]
[ROW][C]15[/C][C]0.339463[/C][C]2.9004[/C][C]0.002461[/C][/ROW]
[ROW][C]16[/C][C]0.29941[/C][C]2.5582[/C][C]0.006299[/C][/ROW]
[ROW][C]17[/C][C]0.267007[/C][C]2.2813[/C][C]0.012724[/C][/ROW]
[ROW][C]18[/C][C]0.240314[/C][C]2.0532[/C][C]0.021816[/C][/ROW]
[ROW][C]19[/C][C]0.206357[/C][C]1.7631[/C][C]0.041033[/C][/ROW]
[ROW][C]20[/C][C]0.182002[/C][C]1.555[/C][C]0.062133[/C][/ROW]
[ROW][C]21[/C][C]0.156989[/C][C]1.3413[/C][C]0.091988[/C][/ROW]
[ROW][C]22[/C][C]0.131163[/C][C]1.1207[/C][C]0.133054[/C][/ROW]
[ROW][C]23[/C][C]0.090488[/C][C]0.7731[/C][C]0.220972[/C][/ROW]
[ROW][C]24[/C][C]0.050365[/C][C]0.4303[/C][C]0.334115[/C][/ROW]
[ROW][C]25[/C][C]0.014723[/C][C]0.1258[/C][C]0.450121[/C][/ROW]
[ROW][C]26[/C][C]-0.010645[/C][C]-0.091[/C][C]0.463889[/C][/ROW]
[ROW][C]27[/C][C]-0.038756[/C][C]-0.3311[/C][C]0.370748[/C][/ROW]
[ROW][C]28[/C][C]-0.059469[/C][C]-0.5081[/C][C]0.306457[/C][/ROW]
[ROW][C]29[/C][C]-0.069304[/C][C]-0.5921[/C][C]0.277795[/C][/ROW]
[ROW][C]30[/C][C]-0.081435[/C][C]-0.6958[/C][C]0.244387[/C][/ROW]
[ROW][C]31[/C][C]-0.088949[/C][C]-0.76[/C][C]0.224857[/C][/ROW]
[ROW][C]32[/C][C]-0.099782[/C][C]-0.8525[/C][C]0.198352[/C][/ROW]
[ROW][C]33[/C][C]-0.112347[/C][C]-0.9599[/C][C]0.170139[/C][/ROW]
[ROW][C]34[/C][C]-0.131513[/C][C]-1.1236[/C][C]0.132423[/C][/ROW]
[ROW][C]35[/C][C]-0.150784[/C][C]-1.2883[/C][C]0.100856[/C][/ROW]
[ROW][C]36[/C][C]-0.173069[/C][C]-1.4787[/C][C]0.071761[/C][/ROW]
[ROW][C]37[/C][C]-0.190252[/C][C]-1.6255[/C][C]0.054182[/C][/ROW]
[ROW][C]38[/C][C]-0.205368[/C][C]-1.7547[/C][C]0.041756[/C][/ROW]
[ROW][C]39[/C][C]-0.22428[/C][C]-1.9163[/C][C]0.029624[/C][/ROW]
[ROW][C]40[/C][C]-0.237591[/C][C]-2.03[/C][C]0.023002[/C][/ROW]
[ROW][C]41[/C][C]-0.255296[/C][C]-2.1813[/C][C]0.016193[/C][/ROW]
[ROW][C]42[/C][C]-0.278031[/C][C]-2.3755[/C][C]0.010076[/C][/ROW]
[ROW][C]43[/C][C]-0.303[/C][C]-2.5888[/C][C]0.005808[/C][/ROW]
[ROW][C]44[/C][C]-0.323453[/C][C]-2.7636[/C][C]0.003616[/C][/ROW]
[ROW][C]45[/C][C]-0.355512[/C][C]-3.0375[/C][C]0.001654[/C][/ROW]
[ROW][C]46[/C][C]-0.378534[/C][C]-3.2342[/C][C]0.000917[/C][/ROW]
[ROW][C]47[/C][C]-0.39274[/C][C]-3.3556[/C][C]0.00063[/C][/ROW]
[ROW][C]48[/C][C]-0.409724[/C][C]-3.5007[/C][C]0.000398[/C][/ROW]
[/TABLE]
Source: https://freestatistics.org/blog/index.php?pk=74988&T=1

Globally Unique Identifier (entire table): ba.freestatistics.org/blog/index.php?pk=74988&T=1

As an alternative you can also use a QR Code:  

The GUIDs for individual cells are displayed in the table below:

Autocorrelation Function
Time lag kACF(k)T-STATP-value
10.9437988.06380
20.8844497.55670
30.8323217.11140
40.7890796.74190
50.743626.35350
60.706486.03620
70.6743095.76130
80.6387915.45780
90.6027455.14991e-06
100.5646924.82474e-06
110.5188594.43311.6e-05
120.4617813.94559.1e-05
130.4178213.56990.000318
140.3771423.22230.000951
150.3394632.90040.002461
160.299412.55820.006299
170.2670072.28130.012724
180.2403142.05320.021816
190.2063571.76310.041033
200.1820021.5550.062133
210.1569891.34130.091988
220.1311631.12070.133054
230.0904880.77310.220972
240.0503650.43030.334115
250.0147230.12580.450121
26-0.010645-0.0910.463889
27-0.038756-0.33110.370748
28-0.059469-0.50810.306457
29-0.069304-0.59210.277795
30-0.081435-0.69580.244387
31-0.088949-0.760.224857
32-0.099782-0.85250.198352
33-0.112347-0.95990.170139
34-0.131513-1.12360.132423
35-0.150784-1.28830.100856
36-0.173069-1.47870.071761
37-0.190252-1.62550.054182
38-0.205368-1.75470.041756
39-0.22428-1.91630.029624
40-0.237591-2.030.023002
41-0.255296-2.18130.016193
42-0.278031-2.37550.010076
43-0.303-2.58880.005808
44-0.323453-2.76360.003616
45-0.355512-3.03750.001654
46-0.378534-3.23420.000917
47-0.39274-3.35560.00063
48-0.409724-3.50070.000398


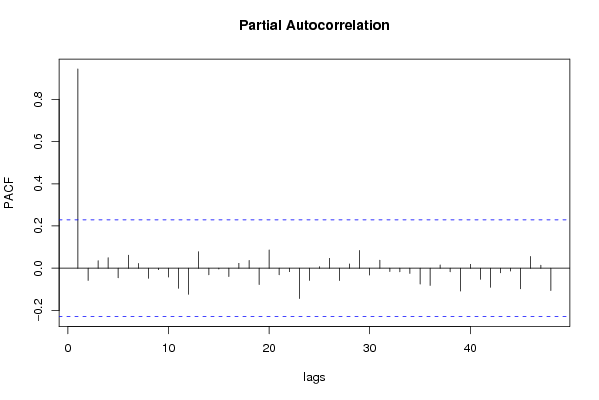
Partial Autocorrelation Function
Time lag kPACF(k)T-STATP-value
10.9437988.06380
2-0.057716-0.49310.311703
30.0355850.3040.380981
40.0493650.42180.337215
5-0.045565-0.38930.34909
60.0613010.52380.301018
70.0221310.18910.425275
8-0.047552-0.40630.34286
9-0.006696-0.05720.477266
10-0.041428-0.3540.362193
11-0.095453-0.81560.208705
12-0.123711-1.0570.147001
130.0779130.66570.253853
14-0.031469-0.26890.394393
15-0.003689-0.03150.48747
16-0.039684-0.33910.36777
170.0231670.19790.421823
180.0363980.3110.378348
19-0.077147-0.65910.255939
200.0867460.74120.230488
21-0.030851-0.26360.39642
22-0.016229-0.13870.445049
23-0.143374-1.2250.112259
24-0.057805-0.49390.311434
250.006930.05920.476473
260.0467760.39970.345289
27-0.058468-0.49950.309448
280.0199080.17010.432703
290.084350.72070.236702
30-0.031927-0.27280.392894
310.0381270.32580.372771
32-0.015317-0.13090.44812
33-0.016485-0.14090.444187
34-0.024686-0.21090.416769
35-0.075213-0.64260.261241
36-0.081416-0.69560.244439
370.0154770.13220.44758
38-0.016828-0.14380.443037
39-0.108389-0.92610.178729
400.0184770.15790.4375
41-0.052244-0.44640.328326
42-0.090274-0.77130.221508
43-0.021218-0.18130.428323
44-0.013147-0.11230.455436
45-0.097633-0.83420.203452
460.0556680.47560.317879
470.0140620.12010.452347
48-0.105804-0.9040.184487

\begin{tabular}{lllllllll}
\hline
Partial Autocorrelation Function \tabularnewline
Time lag k & PACF(k) & T-STAT & P-value \tabularnewline
1 & 0.943798 & 8.0638 & 0 \tabularnewline
2 & -0.057716 & -0.4931 & 0.311703 \tabularnewline
3 & 0.035585 & 0.304 & 0.380981 \tabularnewline
4 & 0.049365 & 0.4218 & 0.337215 \tabularnewline
5 & -0.045565 & -0.3893 & 0.34909 \tabularnewline
6 & 0.061301 & 0.5238 & 0.301018 \tabularnewline
7 & 0.022131 & 0.1891 & 0.425275 \tabularnewline
8 & -0.047552 & -0.4063 & 0.34286 \tabularnewline
9 & -0.006696 & -0.0572 & 0.477266 \tabularnewline
10 & -0.041428 & -0.354 & 0.362193 \tabularnewline
11 & -0.095453 & -0.8156 & 0.208705 \tabularnewline
12 & -0.123711 & -1.057 & 0.147001 \tabularnewline
13 & 0.077913 & 0.6657 & 0.253853 \tabularnewline
14 & -0.031469 & -0.2689 & 0.394393 \tabularnewline
15 & -0.003689 & -0.0315 & 0.48747 \tabularnewline
16 & -0.039684 & -0.3391 & 0.36777 \tabularnewline
17 & 0.023167 & 0.1979 & 0.421823 \tabularnewline
18 & 0.036398 & 0.311 & 0.378348 \tabularnewline
19 & -0.077147 & -0.6591 & 0.255939 \tabularnewline
20 & 0.086746 & 0.7412 & 0.230488 \tabularnewline
21 & -0.030851 & -0.2636 & 0.39642 \tabularnewline
22 & -0.016229 & -0.1387 & 0.445049 \tabularnewline
23 & -0.143374 & -1.225 & 0.112259 \tabularnewline
24 & -0.057805 & -0.4939 & 0.311434 \tabularnewline
25 & 0.00693 & 0.0592 & 0.476473 \tabularnewline
26 & 0.046776 & 0.3997 & 0.345289 \tabularnewline
27 & -0.058468 & -0.4995 & 0.309448 \tabularnewline
28 & 0.019908 & 0.1701 & 0.432703 \tabularnewline
29 & 0.08435 & 0.7207 & 0.236702 \tabularnewline
30 & -0.031927 & -0.2728 & 0.392894 \tabularnewline
31 & 0.038127 & 0.3258 & 0.372771 \tabularnewline
32 & -0.015317 & -0.1309 & 0.44812 \tabularnewline
33 & -0.016485 & -0.1409 & 0.444187 \tabularnewline
34 & -0.024686 & -0.2109 & 0.416769 \tabularnewline
35 & -0.075213 & -0.6426 & 0.261241 \tabularnewline
36 & -0.081416 & -0.6956 & 0.244439 \tabularnewline
37 & 0.015477 & 0.1322 & 0.44758 \tabularnewline
38 & -0.016828 & -0.1438 & 0.443037 \tabularnewline
39 & -0.108389 & -0.9261 & 0.178729 \tabularnewline
40 & 0.018477 & 0.1579 & 0.4375 \tabularnewline
41 & -0.052244 & -0.4464 & 0.328326 \tabularnewline
42 & -0.090274 & -0.7713 & 0.221508 \tabularnewline
43 & -0.021218 & -0.1813 & 0.428323 \tabularnewline
44 & -0.013147 & -0.1123 & 0.455436 \tabularnewline
45 & -0.097633 & -0.8342 & 0.203452 \tabularnewline
46 & 0.055668 & 0.4756 & 0.317879 \tabularnewline
47 & 0.014062 & 0.1201 & 0.452347 \tabularnewline
48 & -0.105804 & -0.904 & 0.184487 \tabularnewline
\hline
\end{tabular}
%Source: https://freestatistics.org/blog/index.php?pk=74988&T=2

[TABLE]
[ROW][C]Partial Autocorrelation Function[/C][/ROW]
[ROW][C]Time lag k[/C][C]PACF(k)[/C][C]T-STAT[/C][C]P-value[/C][/ROW]
[ROW][C]1[/C][C]0.943798[/C][C]8.0638[/C][C]0[/C][/ROW]
[ROW][C]2[/C][C]-0.057716[/C][C]-0.4931[/C][C]0.311703[/C][/ROW]
[ROW][C]3[/C][C]0.035585[/C][C]0.304[/C][C]0.380981[/C][/ROW]
[ROW][C]4[/C][C]0.049365[/C][C]0.4218[/C][C]0.337215[/C][/ROW]
[ROW][C]5[/C][C]-0.045565[/C][C]-0.3893[/C][C]0.34909[/C][/ROW]
[ROW][C]6[/C][C]0.061301[/C][C]0.5238[/C][C]0.301018[/C][/ROW]
[ROW][C]7[/C][C]0.022131[/C][C]0.1891[/C][C]0.425275[/C][/ROW]
[ROW][C]8[/C][C]-0.047552[/C][C]-0.4063[/C][C]0.34286[/C][/ROW]
[ROW][C]9[/C][C]-0.006696[/C][C]-0.0572[/C][C]0.477266[/C][/ROW]
[ROW][C]10[/C][C]-0.041428[/C][C]-0.354[/C][C]0.362193[/C][/ROW]
[ROW][C]11[/C][C]-0.095453[/C][C]-0.8156[/C][C]0.208705[/C][/ROW]
[ROW][C]12[/C][C]-0.123711[/C][C]-1.057[/C][C]0.147001[/C][/ROW]
[ROW][C]13[/C][C]0.077913[/C][C]0.6657[/C][C]0.253853[/C][/ROW]
[ROW][C]14[/C][C]-0.031469[/C][C]-0.2689[/C][C]0.394393[/C][/ROW]
[ROW][C]15[/C][C]-0.003689[/C][C]-0.0315[/C][C]0.48747[/C][/ROW]
[ROW][C]16[/C][C]-0.039684[/C][C]-0.3391[/C][C]0.36777[/C][/ROW]
[ROW][C]17[/C][C]0.023167[/C][C]0.1979[/C][C]0.421823[/C][/ROW]
[ROW][C]18[/C][C]0.036398[/C][C]0.311[/C][C]0.378348[/C][/ROW]
[ROW][C]19[/C][C]-0.077147[/C][C]-0.6591[/C][C]0.255939[/C][/ROW]
[ROW][C]20[/C][C]0.086746[/C][C]0.7412[/C][C]0.230488[/C][/ROW]
[ROW][C]21[/C][C]-0.030851[/C][C]-0.2636[/C][C]0.39642[/C][/ROW]
[ROW][C]22[/C][C]-0.016229[/C][C]-0.1387[/C][C]0.445049[/C][/ROW]
[ROW][C]23[/C][C]-0.143374[/C][C]-1.225[/C][C]0.112259[/C][/ROW]
[ROW][C]24[/C][C]-0.057805[/C][C]-0.4939[/C][C]0.311434[/C][/ROW]
[ROW][C]25[/C][C]0.00693[/C][C]0.0592[/C][C]0.476473[/C][/ROW]
[ROW][C]26[/C][C]0.046776[/C][C]0.3997[/C][C]0.345289[/C][/ROW]
[ROW][C]27[/C][C]-0.058468[/C][C]-0.4995[/C][C]0.309448[/C][/ROW]
[ROW][C]28[/C][C]0.019908[/C][C]0.1701[/C][C]0.432703[/C][/ROW]
[ROW][C]29[/C][C]0.08435[/C][C]0.7207[/C][C]0.236702[/C][/ROW]
[ROW][C]30[/C][C]-0.031927[/C][C]-0.2728[/C][C]0.392894[/C][/ROW]
[ROW][C]31[/C][C]0.038127[/C][C]0.3258[/C][C]0.372771[/C][/ROW]
[ROW][C]32[/C][C]-0.015317[/C][C]-0.1309[/C][C]0.44812[/C][/ROW]
[ROW][C]33[/C][C]-0.016485[/C][C]-0.1409[/C][C]0.444187[/C][/ROW]
[ROW][C]34[/C][C]-0.024686[/C][C]-0.2109[/C][C]0.416769[/C][/ROW]
[ROW][C]35[/C][C]-0.075213[/C][C]-0.6426[/C][C]0.261241[/C][/ROW]
[ROW][C]36[/C][C]-0.081416[/C][C]-0.6956[/C][C]0.244439[/C][/ROW]
[ROW][C]37[/C][C]0.015477[/C][C]0.1322[/C][C]0.44758[/C][/ROW]
[ROW][C]38[/C][C]-0.016828[/C][C]-0.1438[/C][C]0.443037[/C][/ROW]
[ROW][C]39[/C][C]-0.108389[/C][C]-0.9261[/C][C]0.178729[/C][/ROW]
[ROW][C]40[/C][C]0.018477[/C][C]0.1579[/C][C]0.4375[/C][/ROW]
[ROW][C]41[/C][C]-0.052244[/C][C]-0.4464[/C][C]0.328326[/C][/ROW]
[ROW][C]42[/C][C]-0.090274[/C][C]-0.7713[/C][C]0.221508[/C][/ROW]
[ROW][C]43[/C][C]-0.021218[/C][C]-0.1813[/C][C]0.428323[/C][/ROW]
[ROW][C]44[/C][C]-0.013147[/C][C]-0.1123[/C][C]0.455436[/C][/ROW]
[ROW][C]45[/C][C]-0.097633[/C][C]-0.8342[/C][C]0.203452[/C][/ROW]
[ROW][C]46[/C][C]0.055668[/C][C]0.4756[/C][C]0.317879[/C][/ROW]
[ROW][C]47[/C][C]0.014062[/C][C]0.1201[/C][C]0.452347[/C][/ROW]
[ROW][C]48[/C][C]-0.105804[/C][C]-0.904[/C][C]0.184487[/C][/ROW]
[/TABLE]
Source: https://freestatistics.org/blog/index.php?pk=74988&T=2

Globally Unique Identifier (entire table): ba.freestatistics.org/blog/index.php?pk=74988&T=2

As an alternative you can also use a QR Code:  

The GUIDs for individual cells are displayed in the table below:

Partial Autocorrelation Function
Time lag kPACF(k)T-STATP-value
10.9437988.06380
2-0.057716-0.49310.311703
30.0355850.3040.380981
40.0493650.42180.337215
5-0.045565-0.38930.34909
60.0613010.52380.301018
70.0221310.18910.425275
8-0.047552-0.40630.34286
9-0.006696-0.05720.477266
10-0.041428-0.3540.362193
11-0.095453-0.81560.208705
12-0.123711-1.0570.147001
130.0779130.66570.253853
14-0.031469-0.26890.394393
15-0.003689-0.03150.48747
16-0.039684-0.33910.36777
170.0231670.19790.421823
180.0363980.3110.378348
19-0.077147-0.65910.255939
200.0867460.74120.230488
21-0.030851-0.26360.39642
22-0.016229-0.13870.445049
23-0.143374-1.2250.112259
24-0.057805-0.49390.311434
250.006930.05920.476473
260.0467760.39970.345289
27-0.058468-0.49950.309448
280.0199080.17010.432703
290.084350.72070.236702
30-0.031927-0.27280.392894
310.0381270.32580.372771
32-0.015317-0.13090.44812
33-0.016485-0.14090.444187
34-0.024686-0.21090.416769
35-0.075213-0.64260.261241
36-0.081416-0.69560.244439
370.0154770.13220.44758
38-0.016828-0.14380.443037
39-0.108389-0.92610.178729
400.0184770.15790.4375
41-0.052244-0.44640.328326
42-0.090274-0.77130.221508
43-0.021218-0.18130.428323
44-0.013147-0.11230.455436
45-0.097633-0.83420.203452
460.0556680.47560.317879
470.0140620.12010.452347
48-0.105804-0.9040.184487


Parameters (Session):
par1 = 48 ; par2 = 1 ; par3 = 0 ; par4 = 0 ; par5 = 12 ; par6 = White Noise ; par7 = 0.95 ;
Parameters (R input):
par1 = 48 ; par2 = 1 ; par3 = 0 ; par4 = 0 ; par5 = 12 ; par6 = White Noise ; par7 = 0.95 ;
R code (references can be found in the software module):
if (par1 == 'Default') {
par1 = 10*log10(length(x))
} else {
par1 <- as.numeric(par1)
}
par2 <- as.numeric(par2)
par3 <- as.numeric(par3)
par4 <- as.numeric(par4)
par5 <- as.numeric(par5)
if (par6 == 'White Noise') par6 <- 'white' else par6 <- 'ma'
par7 <- as.numeric(par7)
if (par2 == 0) {
x <- log(x)
} else {
x <- (x ^ par2 - 1) / par2
}
if (par3 > 0) x <- diff(x,lag=1,difference=par3)
if (par4 > 0) x <- diff(x,lag=par5,difference=par4)
bitmap(file='pic1.png')
racf <- acf(x, par1, main='Autocorrelation', xlab='time lag', ylab='ACF', ci.type=par6, ci=par7, sub=paste('(lambda=',par2,', d=',par3,', D=',par4,', CI=', par7, ', CI type=',par6,')',sep=''))
dev.off()
bitmap(file='pic2.png')
rpacf <- pacf(x,par1,main='Partial Autocorrelation',xlab='lags',ylab='PACF')
dev.off()
(myacf <- c(racf$acf))
(mypacf <- c(rpacf$acf))
lengthx <- length(x)
sqrtn <- sqrt(lengthx)
load(file='createtable')
a<-table.start()
a<-table.row.start(a)
a<-table.element(a,'Autocorrelation Function',4,TRUE)
a<-table.row.end(a)
a<-table.row.start(a)
a<-table.element(a,'Time lag k',header=TRUE)
a<-table.element(a,hyperlink('basics.htm','ACF(k)','click here for more information about the Autocorrelation Function'),header=TRUE)
a<-table.element(a,'T-STAT',header=TRUE)
a<-table.element(a,'P-value',header=TRUE)
a<-table.row.end(a)
for (i in 2:(par1+1)) {
a<-table.row.start(a)
a<-table.element(a,i-1,header=TRUE)
a<-table.element(a,round(myacf[i],6))
mytstat <- myacf[i]*sqrtn
a<-table.element(a,round(mytstat,4))
a<-table.element(a,round(1-pt(abs(mytstat),lengthx),6))
a<-table.row.end(a)
}
a<-table.end(a)
table.save(a,file='mytable.tab')
a<-table.start()
a<-table.row.start(a)
a<-table.element(a,'Partial Autocorrelation Function',4,TRUE)
a<-table.row.end(a)
a<-table.row.start(a)
a<-table.element(a,'Time lag k',header=TRUE)
a<-table.element(a,hyperlink('basics.htm','PACF(k)','click here for more information about the Partial Autocorrelation Function'),header=TRUE)
a<-table.element(a,'T-STAT',header=TRUE)
a<-table.element(a,'P-value',header=TRUE)
a<-table.row.end(a)
for (i in 1:par1) {
a<-table.row.start(a)
a<-table.element(a,i,header=TRUE)
a<-table.element(a,round(mypacf[i],6))
mytstat <- mypacf[i]*sqrtn
a<-table.element(a,round(mytstat,4))
a<-table.element(a,round(1-pt(abs(mytstat),lengthx),6))
a<-table.row.end(a)
}
a<-table.end(a)
table.save(a,file='mytable1.tab')