Free Statistics

of Irreproducible Research!

Author's title

Author*Unverified author*
R Software Modulerwasp_centraltendency.wasp
Title produced by softwareCentral Tendency
Date of computationWed, 28 Apr 2010 14:11:39 +0000
Cite this page as followsStatistical Computations at FreeStatistics.org, Office for Research Development and Education, URL https://freestatistics.org/blog/index.php?v=date/2010/Apr/28/t1272464040o29p1729si6fobw.htm/, Retrieved Wed, 24 Apr 2024 11:55:31 +0000
Statistical Computations at FreeStatistics.org, Office for Research Development and Education, URL https://freestatistics.org/blog/index.php?pk=74964, Retrieved Wed, 24 Apr 2024 11:55:31 +0000
QR Codes:

Original text written by user:
IsPrivate?No (this computation is public)
User-defined keywordsKDGP1W52
Estimated Impact181
Family? (F = Feedback message, R = changed R code, M = changed R Module, P = changed Parameters, D = changed Data)
-       [Central Tendency] [] [2010-04-28 14:11:39] [518b58fa2b091d980a743b3df0de830f] [Current]
Feedback Forum

Post a new message
Dataseries X:
1,4272
1,4614
1,4914
1,4816
1,4562
1,4268
1,4088
1,4016
1,365
1,319
1,305
1,2785
1,3239
1,3449
1,2732
1,3322
1,4369
1,4975
1,577
1,5553
1,5557
1,575
1,5527
1,4748
1,4718
1,457
1,4684
1,4227
1,3896
1,3622
1,3716
1,3419
1,3511
1,3516
1,3242
1,3074
1,2999
1,3213
1,2881
1,2611
1,2727
1,2811
1,2684
1,265
1,277
1,2271
1,202
1,1938
1,2103
1,1856
1,1786
1,2015
1,2256
1,2292
1,2037
1,2165
1,2694
1,2938
1,3201
1,3014
1,3119
1,3408
1,2991
1,249
1,2218
1,2176
1,2266
1,2138
1,2007
1,1985
1,2262
1,2646


Summary of computational transaction
Raw Inputview raw input (R code)
Raw Outputview raw output of R engine
Computing time2 seconds
R Server'Sir Ronald Aylmer Fisher' @ 193.190.124.24

\begin{tabular}{lllllllll}
\hline
Summary of computational transaction \tabularnewline
Raw Input & view raw input (R code)  \tabularnewline
Raw Output & view raw output of R engine  \tabularnewline
Computing time & 2 seconds \tabularnewline
R Server & 'Sir Ronald Aylmer Fisher' @ 193.190.124.24 \tabularnewline
\hline
\end{tabular}
%Source: https://freestatistics.org/blog/index.php?pk=74964&T=0

[TABLE]
[ROW][C]Summary of computational transaction[/C][/ROW]
[ROW][C]Raw Input[/C][C]view raw input (R code) [/C][/ROW]
[ROW][C]Raw Output[/C][C]view raw output of R engine [/C][/ROW]
[ROW][C]Computing time[/C][C]2 seconds[/C][/ROW]
[ROW][C]R Server[/C][C]'Sir Ronald Aylmer Fisher' @ 193.190.124.24[/C][/ROW]
[/TABLE]
Source: https://freestatistics.org/blog/index.php?pk=74964&T=0

Globally Unique Identifier (entire table): ba.freestatistics.org/blog/index.php?pk=74964&T=0

As an alternative you can also use a QR Code:  

The GUIDs for individual cells are displayed in the table below:

Summary of computational transaction
Raw Inputview raw input (R code)
Raw Outputview raw output of R engine
Computing time2 seconds
R Server'Sir Ronald Aylmer Fisher' @ 193.190.124.24


Central Tendency - Ungrouped Data
MeasureValueS.E.Value/S.E.
Arithmetic Mean1.33201250.0127449193500408104.513215299062
Geometric Mean1.32780358367739
Harmonic Mean1.32371728852161
Quadratic Mean1.33633455428355
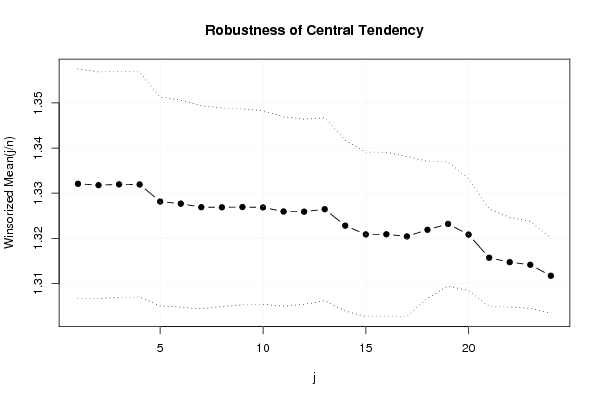
Winsorized Mean ( 1 / 24 )1.332081944444440.0127212982548744104.712735898164
Winsorized Mean ( 2 / 24 )1.331773611111110.0125456677508833106.154063502705
Winsorized Mean ( 3 / 24 )1.331952777777780.0125115999341278106.457430287922
Winsorized Mean ( 4 / 24 )1.331930555555560.0124571655189134106.920836327760
Winsorized Mean ( 5 / 24 )1.328152777777780.0115722318153024114.770668180144
Winsorized Mean ( 6 / 24 )1.327686111111110.0114622803369364115.830888102845
Winsorized Mean ( 7 / 24 )1.326898611111110.0112486247625882117.96096315029
Winsorized Mean ( 8 / 24 )1.326876388888890.0109924786658209120.707661049602
Winsorized Mean ( 9 / 24 )1.326938888888890.0108569189905314122.220575657435
Winsorized Mean ( 10 / 24 )1.326841666666670.0107138860486975123.843175168730
Winsorized Mean ( 11 / 24 )1.325940277777780.0104927178078045126.367667754444
Winsorized Mean ( 12 / 24 )1.325906944444440.0102591154410972129.241838836608
Winsorized Mean ( 13 / 24 )1.326448611111110.0101359846406932130.865294111219
Winsorized Mean ( 14 / 24 )1.32281250.00946178437744396139.805817510856
Winsorized Mean ( 15 / 24 )1.3208750.00911196133647944144.960558020798
Winsorized Mean ( 16 / 24 )1.320897222222220.00908117926222865145.454371517170
Winsorized Mean ( 17 / 24 )1.3204250.0088508352058967149.186485713833
Winsorized Mean ( 18 / 24 )1.32190.00759182777615414174.121442026395
Winsorized Mean ( 19 / 24 )1.323193055555560.00686594141481658192.718372559971
Winsorized Mean ( 20 / 24 )1.320831944444440.00621379681344403212.564392447903
Winsorized Mean ( 21 / 24 )1.315698611111110.0054052796500178243.409905925363
Winsorized Mean ( 22 / 24 )1.314720833333330.00497810304509873264.100767184352
Winsorized Mean ( 23 / 24 )1.314145833333330.00480967739308853273.229517476942
Winsorized Mean ( 24 / 24 )1.31171250.00417838396473197313.928186368612
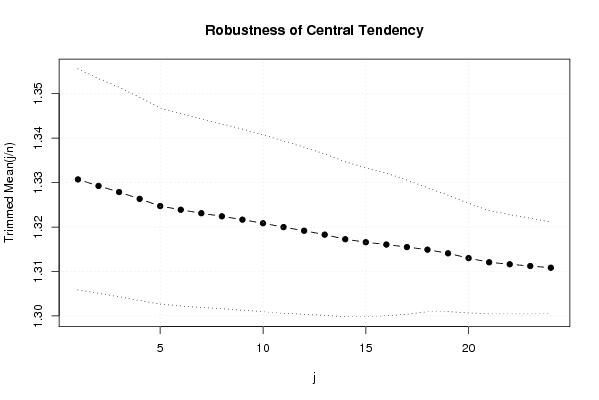
Trimmed Mean ( 1 / 24 )1.330704285714290.0124335356700182107.025412644538
Trimmed Mean ( 2 / 24 )1.329245588235290.0120887387706523109.957342403848
Trimmed Mean ( 3 / 24 )1.327866666666670.0117872588028545112.652711616470
Trimmed Mean ( 4 / 24 )1.3263343750.0114373553028296115.965128290791
Trimmed Mean ( 5 / 24 )1.324709677419350.011031532064088120.083925761482
Trimmed Mean ( 6 / 24 )1.323883333333330.0108295899225581122.246857249477
Trimmed Mean ( 7 / 24 )1.323096551724140.0106107785049471124.693635920047
Trimmed Mean ( 8 / 24 )1.322398214285710.0103949880190430127.214982053193
Trimmed Mean ( 9 / 24 )1.321651851851850.0101867501878775129.742246298005
Trimmed Mean ( 10 / 24 )1.320838461538460.00995424114112534132.691025143192
Trimmed Mean ( 11 / 24 )1.3199740.00969073229052018136.209933411456
Trimmed Mean ( 12 / 24 )1.319160416666670.00940533967265448140.256541770847
Trimmed Mean ( 13 / 24 )1.318280434782610.00909032166730765145.020218538983
Trimmed Mean ( 14 / 24 )1.317252272727270.00870573338374193151.308593390565
Trimmed Mean ( 15 / 24 )1.316571428571430.0083745343523119157.211299540251
Trimmed Mean ( 16 / 24 )1.3160550.00802338405329489164.027421753487
Trimmed Mean ( 17 / 24 )1.315481578947370.00755419382289354174.139241034656
Trimmed Mean ( 18 / 24 )1.31490.00697399364077623188.543332232469
Trimmed Mean ( 19 / 24 )1.314076470588240.0065474424648926200.700728205603
Trimmed Mean ( 20 / 24 )1.3129968750.00615613790936927213.28256356988
Trimmed Mean ( 21 / 24 )1.312056666666670.00580903316254305225.864895233664
Trimmed Mean ( 22 / 24 )1.311610714285710.00558635037955141234.788479986291
Trimmed Mean ( 23 / 24 )1.311219230769230.00538818656301634243.350748054871
Trimmed Mean ( 24 / 24 )1.31083750.00512873692851213255.586807877135
Median1.30965
Midrange1.3778
Midmean - Weighted Average at Xnp1.31258378378378
Midmean - Weighted Average at X(n+1)p1.3149
Midmean - Empirical Distribution Function1.31258378378378
Midmean - Empirical Distribution Function - Averaging1.3149
Midmean - Empirical Distribution Function - Interpolation1.3149
Midmean - Closest Observation1.31258378378378
Midmean - True Basic - Statistics Graphics Toolkit1.3149
Midmean - MS Excel (old versions)1.31548157894737
Number of observations72

\begin{tabular}{lllllllll}
\hline
Central Tendency - Ungrouped Data \tabularnewline
Measure & Value & S.E. & Value/S.E. \tabularnewline
Arithmetic Mean & 1.3320125 & 0.0127449193500408 & 104.513215299062 \tabularnewline
Geometric Mean & 1.32780358367739 &  &  \tabularnewline
Harmonic Mean & 1.32371728852161 &  &  \tabularnewline
Quadratic Mean & 1.33633455428355 &  &  \tabularnewline
Winsorized Mean ( 1 / 24 ) & 1.33208194444444 & 0.0127212982548744 & 104.712735898164 \tabularnewline
Winsorized Mean ( 2 / 24 ) & 1.33177361111111 & 0.0125456677508833 & 106.154063502705 \tabularnewline
Winsorized Mean ( 3 / 24 ) & 1.33195277777778 & 0.0125115999341278 & 106.457430287922 \tabularnewline
Winsorized Mean ( 4 / 24 ) & 1.33193055555556 & 0.0124571655189134 & 106.920836327760 \tabularnewline
Winsorized Mean ( 5 / 24 ) & 1.32815277777778 & 0.0115722318153024 & 114.770668180144 \tabularnewline
Winsorized Mean ( 6 / 24 ) & 1.32768611111111 & 0.0114622803369364 & 115.830888102845 \tabularnewline
Winsorized Mean ( 7 / 24 ) & 1.32689861111111 & 0.0112486247625882 & 117.96096315029 \tabularnewline
Winsorized Mean ( 8 / 24 ) & 1.32687638888889 & 0.0109924786658209 & 120.707661049602 \tabularnewline
Winsorized Mean ( 9 / 24 ) & 1.32693888888889 & 0.0108569189905314 & 122.220575657435 \tabularnewline
Winsorized Mean ( 10 / 24 ) & 1.32684166666667 & 0.0107138860486975 & 123.843175168730 \tabularnewline
Winsorized Mean ( 11 / 24 ) & 1.32594027777778 & 0.0104927178078045 & 126.367667754444 \tabularnewline
Winsorized Mean ( 12 / 24 ) & 1.32590694444444 & 0.0102591154410972 & 129.241838836608 \tabularnewline
Winsorized Mean ( 13 / 24 ) & 1.32644861111111 & 0.0101359846406932 & 130.865294111219 \tabularnewline
Winsorized Mean ( 14 / 24 ) & 1.3228125 & 0.00946178437744396 & 139.805817510856 \tabularnewline
Winsorized Mean ( 15 / 24 ) & 1.320875 & 0.00911196133647944 & 144.960558020798 \tabularnewline
Winsorized Mean ( 16 / 24 ) & 1.32089722222222 & 0.00908117926222865 & 145.454371517170 \tabularnewline
Winsorized Mean ( 17 / 24 ) & 1.320425 & 0.0088508352058967 & 149.186485713833 \tabularnewline
Winsorized Mean ( 18 / 24 ) & 1.3219 & 0.00759182777615414 & 174.121442026395 \tabularnewline
Winsorized Mean ( 19 / 24 ) & 1.32319305555556 & 0.00686594141481658 & 192.718372559971 \tabularnewline
Winsorized Mean ( 20 / 24 ) & 1.32083194444444 & 0.00621379681344403 & 212.564392447903 \tabularnewline
Winsorized Mean ( 21 / 24 ) & 1.31569861111111 & 0.0054052796500178 & 243.409905925363 \tabularnewline
Winsorized Mean ( 22 / 24 ) & 1.31472083333333 & 0.00497810304509873 & 264.100767184352 \tabularnewline
Winsorized Mean ( 23 / 24 ) & 1.31414583333333 & 0.00480967739308853 & 273.229517476942 \tabularnewline
Winsorized Mean ( 24 / 24 ) & 1.3117125 & 0.00417838396473197 & 313.928186368612 \tabularnewline
Trimmed Mean ( 1 / 24 ) & 1.33070428571429 & 0.0124335356700182 & 107.025412644538 \tabularnewline
Trimmed Mean ( 2 / 24 ) & 1.32924558823529 & 0.0120887387706523 & 109.957342403848 \tabularnewline
Trimmed Mean ( 3 / 24 ) & 1.32786666666667 & 0.0117872588028545 & 112.652711616470 \tabularnewline
Trimmed Mean ( 4 / 24 ) & 1.326334375 & 0.0114373553028296 & 115.965128290791 \tabularnewline
Trimmed Mean ( 5 / 24 ) & 1.32470967741935 & 0.011031532064088 & 120.083925761482 \tabularnewline
Trimmed Mean ( 6 / 24 ) & 1.32388333333333 & 0.0108295899225581 & 122.246857249477 \tabularnewline
Trimmed Mean ( 7 / 24 ) & 1.32309655172414 & 0.0106107785049471 & 124.693635920047 \tabularnewline
Trimmed Mean ( 8 / 24 ) & 1.32239821428571 & 0.0103949880190430 & 127.214982053193 \tabularnewline
Trimmed Mean ( 9 / 24 ) & 1.32165185185185 & 0.0101867501878775 & 129.742246298005 \tabularnewline
Trimmed Mean ( 10 / 24 ) & 1.32083846153846 & 0.00995424114112534 & 132.691025143192 \tabularnewline
Trimmed Mean ( 11 / 24 ) & 1.319974 & 0.00969073229052018 & 136.209933411456 \tabularnewline
Trimmed Mean ( 12 / 24 ) & 1.31916041666667 & 0.00940533967265448 & 140.256541770847 \tabularnewline
Trimmed Mean ( 13 / 24 ) & 1.31828043478261 & 0.00909032166730765 & 145.020218538983 \tabularnewline
Trimmed Mean ( 14 / 24 ) & 1.31725227272727 & 0.00870573338374193 & 151.308593390565 \tabularnewline
Trimmed Mean ( 15 / 24 ) & 1.31657142857143 & 0.0083745343523119 & 157.211299540251 \tabularnewline
Trimmed Mean ( 16 / 24 ) & 1.316055 & 0.00802338405329489 & 164.027421753487 \tabularnewline
Trimmed Mean ( 17 / 24 ) & 1.31548157894737 & 0.00755419382289354 & 174.139241034656 \tabularnewline
Trimmed Mean ( 18 / 24 ) & 1.3149 & 0.00697399364077623 & 188.543332232469 \tabularnewline
Trimmed Mean ( 19 / 24 ) & 1.31407647058824 & 0.0065474424648926 & 200.700728205603 \tabularnewline
Trimmed Mean ( 20 / 24 ) & 1.312996875 & 0.00615613790936927 & 213.28256356988 \tabularnewline
Trimmed Mean ( 21 / 24 ) & 1.31205666666667 & 0.00580903316254305 & 225.864895233664 \tabularnewline
Trimmed Mean ( 22 / 24 ) & 1.31161071428571 & 0.00558635037955141 & 234.788479986291 \tabularnewline
Trimmed Mean ( 23 / 24 ) & 1.31121923076923 & 0.00538818656301634 & 243.350748054871 \tabularnewline
Trimmed Mean ( 24 / 24 ) & 1.3108375 & 0.00512873692851213 & 255.586807877135 \tabularnewline
Median & 1.30965 &  &  \tabularnewline
Midrange & 1.3778 &  &  \tabularnewline
Midmean - Weighted Average at Xnp & 1.31258378378378 &  &  \tabularnewline
Midmean - Weighted Average at X(n+1)p & 1.3149 &  &  \tabularnewline
Midmean - Empirical Distribution Function & 1.31258378378378 &  &  \tabularnewline
Midmean - Empirical Distribution Function - Averaging & 1.3149 &  &  \tabularnewline
Midmean - Empirical Distribution Function - Interpolation & 1.3149 &  &  \tabularnewline
Midmean - Closest Observation & 1.31258378378378 &  &  \tabularnewline
Midmean - True Basic - Statistics Graphics Toolkit & 1.3149 &  &  \tabularnewline
Midmean - MS Excel (old versions) & 1.31548157894737 &  &  \tabularnewline
Number of observations & 72 &  &  \tabularnewline
\hline
\end{tabular}
%Source: https://freestatistics.org/blog/index.php?pk=74964&T=1

[TABLE]
[ROW][C]Central Tendency - Ungrouped Data[/C][/ROW]
[ROW][C]Measure[/C][C]Value[/C][C]S.E.[/C][C]Value/S.E.[/C][/ROW]
[ROW][C]Arithmetic Mean[/C][C]1.3320125[/C][C]0.0127449193500408[/C][C]104.513215299062[/C][/ROW]
[ROW][C]Geometric Mean[/C][C]1.32780358367739[/C][C][/C][C][/C][/ROW]
[ROW][C]Harmonic Mean[/C][C]1.32371728852161[/C][C][/C][C][/C][/ROW]
[ROW][C]Quadratic Mean[/C][C]1.33633455428355[/C][C][/C][C][/C][/ROW]
[ROW][C]Winsorized Mean ( 1 / 24 )[/C][C]1.33208194444444[/C][C]0.0127212982548744[/C][C]104.712735898164[/C][/ROW]
[ROW][C]Winsorized Mean ( 2 / 24 )[/C][C]1.33177361111111[/C][C]0.0125456677508833[/C][C]106.154063502705[/C][/ROW]
[ROW][C]Winsorized Mean ( 3 / 24 )[/C][C]1.33195277777778[/C][C]0.0125115999341278[/C][C]106.457430287922[/C][/ROW]
[ROW][C]Winsorized Mean ( 4 / 24 )[/C][C]1.33193055555556[/C][C]0.0124571655189134[/C][C]106.920836327760[/C][/ROW]
[ROW][C]Winsorized Mean ( 5 / 24 )[/C][C]1.32815277777778[/C][C]0.0115722318153024[/C][C]114.770668180144[/C][/ROW]
[ROW][C]Winsorized Mean ( 6 / 24 )[/C][C]1.32768611111111[/C][C]0.0114622803369364[/C][C]115.830888102845[/C][/ROW]
[ROW][C]Winsorized Mean ( 7 / 24 )[/C][C]1.32689861111111[/C][C]0.0112486247625882[/C][C]117.96096315029[/C][/ROW]
[ROW][C]Winsorized Mean ( 8 / 24 )[/C][C]1.32687638888889[/C][C]0.0109924786658209[/C][C]120.707661049602[/C][/ROW]
[ROW][C]Winsorized Mean ( 9 / 24 )[/C][C]1.32693888888889[/C][C]0.0108569189905314[/C][C]122.220575657435[/C][/ROW]
[ROW][C]Winsorized Mean ( 10 / 24 )[/C][C]1.32684166666667[/C][C]0.0107138860486975[/C][C]123.843175168730[/C][/ROW]
[ROW][C]Winsorized Mean ( 11 / 24 )[/C][C]1.32594027777778[/C][C]0.0104927178078045[/C][C]126.367667754444[/C][/ROW]
[ROW][C]Winsorized Mean ( 12 / 24 )[/C][C]1.32590694444444[/C][C]0.0102591154410972[/C][C]129.241838836608[/C][/ROW]
[ROW][C]Winsorized Mean ( 13 / 24 )[/C][C]1.32644861111111[/C][C]0.0101359846406932[/C][C]130.865294111219[/C][/ROW]
[ROW][C]Winsorized Mean ( 14 / 24 )[/C][C]1.3228125[/C][C]0.00946178437744396[/C][C]139.805817510856[/C][/ROW]
[ROW][C]Winsorized Mean ( 15 / 24 )[/C][C]1.320875[/C][C]0.00911196133647944[/C][C]144.960558020798[/C][/ROW]
[ROW][C]Winsorized Mean ( 16 / 24 )[/C][C]1.32089722222222[/C][C]0.00908117926222865[/C][C]145.454371517170[/C][/ROW]
[ROW][C]Winsorized Mean ( 17 / 24 )[/C][C]1.320425[/C][C]0.0088508352058967[/C][C]149.186485713833[/C][/ROW]
[ROW][C]Winsorized Mean ( 18 / 24 )[/C][C]1.3219[/C][C]0.00759182777615414[/C][C]174.121442026395[/C][/ROW]
[ROW][C]Winsorized Mean ( 19 / 24 )[/C][C]1.32319305555556[/C][C]0.00686594141481658[/C][C]192.718372559971[/C][/ROW]
[ROW][C]Winsorized Mean ( 20 / 24 )[/C][C]1.32083194444444[/C][C]0.00621379681344403[/C][C]212.564392447903[/C][/ROW]
[ROW][C]Winsorized Mean ( 21 / 24 )[/C][C]1.31569861111111[/C][C]0.0054052796500178[/C][C]243.409905925363[/C][/ROW]
[ROW][C]Winsorized Mean ( 22 / 24 )[/C][C]1.31472083333333[/C][C]0.00497810304509873[/C][C]264.100767184352[/C][/ROW]
[ROW][C]Winsorized Mean ( 23 / 24 )[/C][C]1.31414583333333[/C][C]0.00480967739308853[/C][C]273.229517476942[/C][/ROW]
[ROW][C]Winsorized Mean ( 24 / 24 )[/C][C]1.3117125[/C][C]0.00417838396473197[/C][C]313.928186368612[/C][/ROW]
[ROW][C]Trimmed Mean ( 1 / 24 )[/C][C]1.33070428571429[/C][C]0.0124335356700182[/C][C]107.025412644538[/C][/ROW]
[ROW][C]Trimmed Mean ( 2 / 24 )[/C][C]1.32924558823529[/C][C]0.0120887387706523[/C][C]109.957342403848[/C][/ROW]
[ROW][C]Trimmed Mean ( 3 / 24 )[/C][C]1.32786666666667[/C][C]0.0117872588028545[/C][C]112.652711616470[/C][/ROW]
[ROW][C]Trimmed Mean ( 4 / 24 )[/C][C]1.326334375[/C][C]0.0114373553028296[/C][C]115.965128290791[/C][/ROW]
[ROW][C]Trimmed Mean ( 5 / 24 )[/C][C]1.32470967741935[/C][C]0.011031532064088[/C][C]120.083925761482[/C][/ROW]
[ROW][C]Trimmed Mean ( 6 / 24 )[/C][C]1.32388333333333[/C][C]0.0108295899225581[/C][C]122.246857249477[/C][/ROW]
[ROW][C]Trimmed Mean ( 7 / 24 )[/C][C]1.32309655172414[/C][C]0.0106107785049471[/C][C]124.693635920047[/C][/ROW]
[ROW][C]Trimmed Mean ( 8 / 24 )[/C][C]1.32239821428571[/C][C]0.0103949880190430[/C][C]127.214982053193[/C][/ROW]
[ROW][C]Trimmed Mean ( 9 / 24 )[/C][C]1.32165185185185[/C][C]0.0101867501878775[/C][C]129.742246298005[/C][/ROW]
[ROW][C]Trimmed Mean ( 10 / 24 )[/C][C]1.32083846153846[/C][C]0.00995424114112534[/C][C]132.691025143192[/C][/ROW]
[ROW][C]Trimmed Mean ( 11 / 24 )[/C][C]1.319974[/C][C]0.00969073229052018[/C][C]136.209933411456[/C][/ROW]
[ROW][C]Trimmed Mean ( 12 / 24 )[/C][C]1.31916041666667[/C][C]0.00940533967265448[/C][C]140.256541770847[/C][/ROW]
[ROW][C]Trimmed Mean ( 13 / 24 )[/C][C]1.31828043478261[/C][C]0.00909032166730765[/C][C]145.020218538983[/C][/ROW]
[ROW][C]Trimmed Mean ( 14 / 24 )[/C][C]1.31725227272727[/C][C]0.00870573338374193[/C][C]151.308593390565[/C][/ROW]
[ROW][C]Trimmed Mean ( 15 / 24 )[/C][C]1.31657142857143[/C][C]0.0083745343523119[/C][C]157.211299540251[/C][/ROW]
[ROW][C]Trimmed Mean ( 16 / 24 )[/C][C]1.316055[/C][C]0.00802338405329489[/C][C]164.027421753487[/C][/ROW]
[ROW][C]Trimmed Mean ( 17 / 24 )[/C][C]1.31548157894737[/C][C]0.00755419382289354[/C][C]174.139241034656[/C][/ROW]
[ROW][C]Trimmed Mean ( 18 / 24 )[/C][C]1.3149[/C][C]0.00697399364077623[/C][C]188.543332232469[/C][/ROW]
[ROW][C]Trimmed Mean ( 19 / 24 )[/C][C]1.31407647058824[/C][C]0.0065474424648926[/C][C]200.700728205603[/C][/ROW]
[ROW][C]Trimmed Mean ( 20 / 24 )[/C][C]1.312996875[/C][C]0.00615613790936927[/C][C]213.28256356988[/C][/ROW]
[ROW][C]Trimmed Mean ( 21 / 24 )[/C][C]1.31205666666667[/C][C]0.00580903316254305[/C][C]225.864895233664[/C][/ROW]
[ROW][C]Trimmed Mean ( 22 / 24 )[/C][C]1.31161071428571[/C][C]0.00558635037955141[/C][C]234.788479986291[/C][/ROW]
[ROW][C]Trimmed Mean ( 23 / 24 )[/C][C]1.31121923076923[/C][C]0.00538818656301634[/C][C]243.350748054871[/C][/ROW]
[ROW][C]Trimmed Mean ( 24 / 24 )[/C][C]1.3108375[/C][C]0.00512873692851213[/C][C]255.586807877135[/C][/ROW]
[ROW][C]Median[/C][C]1.30965[/C][C][/C][C][/C][/ROW]
[ROW][C]Midrange[/C][C]1.3778[/C][C][/C][C][/C][/ROW]
[ROW][C]Midmean - Weighted Average at Xnp[/C][C]1.31258378378378[/C][C][/C][C][/C][/ROW]
[ROW][C]Midmean - Weighted Average at X(n+1)p[/C][C]1.3149[/C][C][/C][C][/C][/ROW]
[ROW][C]Midmean - Empirical Distribution Function[/C][C]1.31258378378378[/C][C][/C][C][/C][/ROW]
[ROW][C]Midmean - Empirical Distribution Function - Averaging[/C][C]1.3149[/C][C][/C][C][/C][/ROW]
[ROW][C]Midmean - Empirical Distribution Function - Interpolation[/C][C]1.3149[/C][C][/C][C][/C][/ROW]
[ROW][C]Midmean - Closest Observation[/C][C]1.31258378378378[/C][C][/C][C][/C][/ROW]
[ROW][C]Midmean - True Basic - Statistics Graphics Toolkit[/C][C]1.3149[/C][C][/C][C][/C][/ROW]
[ROW][C]Midmean - MS Excel (old versions)[/C][C]1.31548157894737[/C][C][/C][C][/C][/ROW]
[ROW][C]Number of observations[/C][C]72[/C][C][/C][C][/C][/ROW]
[/TABLE]
Source: https://freestatistics.org/blog/index.php?pk=74964&T=1

Globally Unique Identifier (entire table): ba.freestatistics.org/blog/index.php?pk=74964&T=1

As an alternative you can also use a QR Code:  

The GUIDs for individual cells are displayed in the table below:

Central Tendency - Ungrouped Data
MeasureValueS.E.Value/S.E.
Arithmetic Mean1.33201250.0127449193500408104.513215299062
Geometric Mean1.32780358367739
Harmonic Mean1.32371728852161
Quadratic Mean1.33633455428355
Winsorized Mean ( 1 / 24 )1.332081944444440.0127212982548744104.712735898164
Winsorized Mean ( 2 / 24 )1.331773611111110.0125456677508833106.154063502705
Winsorized Mean ( 3 / 24 )1.331952777777780.0125115999341278106.457430287922
Winsorized Mean ( 4 / 24 )1.331930555555560.0124571655189134106.920836327760
Winsorized Mean ( 5 / 24 )1.328152777777780.0115722318153024114.770668180144
Winsorized Mean ( 6 / 24 )1.327686111111110.0114622803369364115.830888102845
Winsorized Mean ( 7 / 24 )1.326898611111110.0112486247625882117.96096315029
Winsorized Mean ( 8 / 24 )1.326876388888890.0109924786658209120.707661049602
Winsorized Mean ( 9 / 24 )1.326938888888890.0108569189905314122.220575657435
Winsorized Mean ( 10 / 24 )1.326841666666670.0107138860486975123.843175168730
Winsorized Mean ( 11 / 24 )1.325940277777780.0104927178078045126.367667754444
Winsorized Mean ( 12 / 24 )1.325906944444440.0102591154410972129.241838836608
Winsorized Mean ( 13 / 24 )1.326448611111110.0101359846406932130.865294111219
Winsorized Mean ( 14 / 24 )1.32281250.00946178437744396139.805817510856
Winsorized Mean ( 15 / 24 )1.3208750.00911196133647944144.960558020798
Winsorized Mean ( 16 / 24 )1.320897222222220.00908117926222865145.454371517170
Winsorized Mean ( 17 / 24 )1.3204250.0088508352058967149.186485713833
Winsorized Mean ( 18 / 24 )1.32190.00759182777615414174.121442026395
Winsorized Mean ( 19 / 24 )1.323193055555560.00686594141481658192.718372559971
Winsorized Mean ( 20 / 24 )1.320831944444440.00621379681344403212.564392447903
Winsorized Mean ( 21 / 24 )1.315698611111110.0054052796500178243.409905925363
Winsorized Mean ( 22 / 24 )1.314720833333330.00497810304509873264.100767184352
Winsorized Mean ( 23 / 24 )1.314145833333330.00480967739308853273.229517476942
Winsorized Mean ( 24 / 24 )1.31171250.00417838396473197313.928186368612
Trimmed Mean ( 1 / 24 )1.330704285714290.0124335356700182107.025412644538
Trimmed Mean ( 2 / 24 )1.329245588235290.0120887387706523109.957342403848
Trimmed Mean ( 3 / 24 )1.327866666666670.0117872588028545112.652711616470
Trimmed Mean ( 4 / 24 )1.3263343750.0114373553028296115.965128290791
Trimmed Mean ( 5 / 24 )1.324709677419350.011031532064088120.083925761482
Trimmed Mean ( 6 / 24 )1.323883333333330.0108295899225581122.246857249477
Trimmed Mean ( 7 / 24 )1.323096551724140.0106107785049471124.693635920047
Trimmed Mean ( 8 / 24 )1.322398214285710.0103949880190430127.214982053193
Trimmed Mean ( 9 / 24 )1.321651851851850.0101867501878775129.742246298005
Trimmed Mean ( 10 / 24 )1.320838461538460.00995424114112534132.691025143192
Trimmed Mean ( 11 / 24 )1.3199740.00969073229052018136.209933411456
Trimmed Mean ( 12 / 24 )1.319160416666670.00940533967265448140.256541770847
Trimmed Mean ( 13 / 24 )1.318280434782610.00909032166730765145.020218538983
Trimmed Mean ( 14 / 24 )1.317252272727270.00870573338374193151.308593390565
Trimmed Mean ( 15 / 24 )1.316571428571430.0083745343523119157.211299540251
Trimmed Mean ( 16 / 24 )1.3160550.00802338405329489164.027421753487
Trimmed Mean ( 17 / 24 )1.315481578947370.00755419382289354174.139241034656
Trimmed Mean ( 18 / 24 )1.31490.00697399364077623188.543332232469
Trimmed Mean ( 19 / 24 )1.314076470588240.0065474424648926200.700728205603
Trimmed Mean ( 20 / 24 )1.3129968750.00615613790936927213.28256356988
Trimmed Mean ( 21 / 24 )1.312056666666670.00580903316254305225.864895233664
Trimmed Mean ( 22 / 24 )1.311610714285710.00558635037955141234.788479986291
Trimmed Mean ( 23 / 24 )1.311219230769230.00538818656301634243.350748054871
Trimmed Mean ( 24 / 24 )1.31083750.00512873692851213255.586807877135
Median1.30965
Midrange1.3778
Midmean - Weighted Average at Xnp1.31258378378378
Midmean - Weighted Average at X(n+1)p1.3149
Midmean - Empirical Distribution Function1.31258378378378
Midmean - Empirical Distribution Function - Averaging1.3149
Midmean - Empirical Distribution Function - Interpolation1.3149
Midmean - Closest Observation1.31258378378378
Midmean - True Basic - Statistics Graphics Toolkit1.3149
Midmean - MS Excel (old versions)1.31548157894737
Number of observations72


Parameters (Session):
Parameters (R input):
R code (references can be found in the software module):
geomean <- function(x) {
return(exp(mean(log(x))))
}
harmean <- function(x) {
return(1/mean(1/x))
}
quamean <- function(x) {
return(sqrt(mean(x*x)))
}
winmean <- function(x) {
x <-sort(x[!is.na(x)])
n<-length(x)
denom <- 3
nodenom <- n/denom
if (nodenom>40) denom <- n/40
sqrtn = sqrt(n)
roundnodenom = floor(nodenom)
win <- array(NA,dim=c(roundnodenom,2))
for (j in 1:roundnodenom) {
win[j,1] <- (j*x[j+1]+sum(x[(j+1):(n-j)])+j*x[n-j])/n
win[j,2] <- sd(c(rep(x[j+1],j),x[(j+1):(n-j)],rep(x[n-j],j)))/sqrtn
}
return(win)
}
trimean <- function(x) {
x <-sort(x[!is.na(x)])
n<-length(x)
denom <- 3
nodenom <- n/denom
if (nodenom>40) denom <- n/40
sqrtn = sqrt(n)
roundnodenom = floor(nodenom)
tri <- array(NA,dim=c(roundnodenom,2))
for (j in 1:roundnodenom) {
tri[j,1] <- mean(x,trim=j/n)
tri[j,2] <- sd(x[(j+1):(n-j)]) / sqrt(n-j*2)
}
return(tri)
}
midrange <- function(x) {
return((max(x)+min(x))/2)
}
q1 <- function(data,n,p,i,f) {
np <- n*p;
i <<- floor(np)
f <<- np - i
qvalue <- (1-f)*data[i] + f*data[i+1]
}
q2 <- function(data,n,p,i,f) {
np <- (n+1)*p
i <<- floor(np)
f <<- np - i
qvalue <- (1-f)*data[i] + f*data[i+1]
}
q3 <- function(data,n,p,i,f) {
np <- n*p
i <<- floor(np)
f <<- np - i
if (f==0) {
qvalue <- data[i]
} else {
qvalue <- data[i+1]
}
}
q4 <- function(data,n,p,i,f) {
np <- n*p
i <<- floor(np)
f <<- np - i
if (f==0) {
qvalue <- (data[i]+data[i+1])/2
} else {
qvalue <- data[i+1]
}
}
q5 <- function(data,n,p,i,f) {
np <- (n-1)*p
i <<- floor(np)
f <<- np - i
if (f==0) {
qvalue <- data[i+1]
} else {
qvalue <- data[i+1] + f*(data[i+2]-data[i+1])
}
}
q6 <- function(data,n,p,i,f) {
np <- n*p+0.5
i <<- floor(np)
f <<- np - i
qvalue <- data[i]
}
q7 <- function(data,n,p,i,f) {
np <- (n+1)*p
i <<- floor(np)
f <<- np - i
if (f==0) {
qvalue <- data[i]
} else {
qvalue <- f*data[i] + (1-f)*data[i+1]
}
}
q8 <- function(data,n,p,i,f) {
np <- (n+1)*p
i <<- floor(np)
f <<- np - i
if (f==0) {
qvalue <- data[i]
} else {
if (f == 0.5) {
qvalue <- (data[i]+data[i+1])/2
} else {
if (f < 0.5) {
qvalue <- data[i]
} else {
qvalue <- data[i+1]
}
}
}
}
midmean <- function(x,def) {
x <-sort(x[!is.na(x)])
n<-length(x)
if (def==1) {
qvalue1 <- q1(x,n,0.25,i,f)
qvalue3 <- q1(x,n,0.75,i,f)
}
if (def==2) {
qvalue1 <- q2(x,n,0.25,i,f)
qvalue3 <- q2(x,n,0.75,i,f)
}
if (def==3) {
qvalue1 <- q3(x,n,0.25,i,f)
qvalue3 <- q3(x,n,0.75,i,f)
}
if (def==4) {
qvalue1 <- q4(x,n,0.25,i,f)
qvalue3 <- q4(x,n,0.75,i,f)
}
if (def==5) {
qvalue1 <- q5(x,n,0.25,i,f)
qvalue3 <- q5(x,n,0.75,i,f)
}
if (def==6) {
qvalue1 <- q6(x,n,0.25,i,f)
qvalue3 <- q6(x,n,0.75,i,f)
}
if (def==7) {
qvalue1 <- q7(x,n,0.25,i,f)
qvalue3 <- q7(x,n,0.75,i,f)
}
if (def==8) {
qvalue1 <- q8(x,n,0.25,i,f)
qvalue3 <- q8(x,n,0.75,i,f)
}
midm <- 0
myn <- 0
roundno4 <- round(n/4)
round3no4 <- round(3*n/4)
for (i in 1:n) {
if ((x[i]>=qvalue1) & (x[i]<=qvalue3)){
midm = midm + x[i]
myn = myn + 1
}
}
midm = midm / myn
return(midm)
}
(arm <- mean(x))
sqrtn <- sqrt(length(x))
(armse <- sd(x) / sqrtn)
(armose <- arm / armse)
(geo <- geomean(x))
(har <- harmean(x))
(qua <- quamean(x))
(win <- winmean(x))
(tri <- trimean(x))
(midr <- midrange(x))
midm <- array(NA,dim=8)
for (j in 1:8) midm[j] <- midmean(x,j)
midm
bitmap(file='test1.png')
lb <- win[,1] - 2*win[,2]
ub <- win[,1] + 2*win[,2]
if ((ylimmin == '') | (ylimmax == '')) plot(win[,1],type='b',main=main, xlab='j', pch=19, ylab='Winsorized Mean(j/n)', ylim=c(min(lb),max(ub))) else plot(win[,1],type='l',main=main, xlab='j', pch=19, ylab='Winsorized Mean(j/n)', ylim=c(ylimmin,ylimmax))
lines(ub,lty=3)
lines(lb,lty=3)
grid()
dev.off()
bitmap(file='test2.png')
lb <- tri[,1] - 2*tri[,2]
ub <- tri[,1] + 2*tri[,2]
if ((ylimmin == '') | (ylimmax == '')) plot(tri[,1],type='b',main=main, xlab='j', pch=19, ylab='Trimmed Mean(j/n)', ylim=c(min(lb),max(ub))) else plot(tri[,1],type='l',main=main, xlab='j', pch=19, ylab='Trimmed Mean(j/n)', ylim=c(ylimmin,ylimmax))
lines(ub,lty=3)
lines(lb,lty=3)
grid()
dev.off()
load(file='createtable')
a<-table.start()
a<-table.row.start(a)
a<-table.element(a,'Central Tendency - Ungrouped Data',4,TRUE)
a<-table.row.end(a)
a<-table.row.start(a)
a<-table.element(a,'Measure',header=TRUE)
a<-table.element(a,'Value',header=TRUE)
a<-table.element(a,'S.E.',header=TRUE)
a<-table.element(a,'Value/S.E.',header=TRUE)
a<-table.row.end(a)
a<-table.row.start(a)
a<-table.element(a,hyperlink('arithmetic_mean.htm', 'Arithmetic Mean', 'click to view the definition of the Arithmetic Mean'),header=TRUE)
a<-table.element(a,arm)
a<-table.element(a,hyperlink('arithmetic_mean_standard_error.htm', armse, 'click to view the definition of the Standard Error of the Arithmetic Mean'))
a<-table.element(a,armose)
a<-table.row.end(a)
a<-table.row.start(a)
a<-table.element(a,hyperlink('geometric_mean.htm', 'Geometric Mean', 'click to view the definition of the Geometric Mean'),header=TRUE)
a<-table.element(a,geo)
a<-table.element(a,'')
a<-table.row.end(a)
a<-table.row.start(a)
a<-table.element(a,hyperlink('harmonic_mean.htm', 'Harmonic Mean', 'click to view the definition of the Harmonic Mean'),header=TRUE)
a<-table.element(a,har)
a<-table.element(a,'')
a<-table.row.end(a)
a<-table.row.start(a)
a<-table.element(a,hyperlink('quadratic_mean.htm', 'Quadratic Mean', 'click to view the definition of the Quadratic Mean'),header=TRUE)
a<-table.element(a,qua)
a<-table.element(a,'')
a<-table.row.end(a)
for (j in 1:length(win[,1])) {
a<-table.row.start(a)
mylabel <- paste('Winsorized Mean (',j)
mylabel <- paste(mylabel,'/')
mylabel <- paste(mylabel,length(win[,1]))
mylabel <- paste(mylabel,')')
a<-table.element(a,hyperlink('winsorized_mean.htm', mylabel, 'click to view the definition of the Winsorized Mean'),header=TRUE)
a<-table.element(a,win[j,1])
a<-table.element(a,win[j,2])
a<-table.element(a,win[j,1]/win[j,2])
a<-table.row.end(a)
}
for (j in 1:length(tri[,1])) {
a<-table.row.start(a)
mylabel <- paste('Trimmed Mean (',j)
mylabel <- paste(mylabel,'/')
mylabel <- paste(mylabel,length(tri[,1]))
mylabel <- paste(mylabel,')')
a<-table.element(a,hyperlink('arithmetic_mean.htm', mylabel, 'click to view the definition of the Trimmed Mean'),header=TRUE)
a<-table.element(a,tri[j,1])
a<-table.element(a,tri[j,2])
a<-table.element(a,tri[j,1]/tri[j,2])
a<-table.row.end(a)
}
a<-table.row.start(a)
a<-table.element(a,hyperlink('median_1.htm', 'Median', 'click to view the definition of the Median'),header=TRUE)
a<-table.element(a,median(x))
a<-table.element(a,'')
a<-table.row.end(a)
a<-table.row.start(a)
a<-table.element(a,hyperlink('midrange.htm', 'Midrange', 'click to view the definition of the Midrange'),header=TRUE)
a<-table.element(a,midr)
a<-table.element(a,'')
a<-table.row.end(a)
a<-table.row.start(a)
mymid <- hyperlink('midmean.htm', 'Midmean', 'click to view the definition of the Midmean')
mylabel <- paste(mymid,hyperlink('method_1.htm','Weighted Average at Xnp',''),sep=' - ')
a<-table.element(a,mylabel,header=TRUE)
a<-table.element(a,midm[1])
a<-table.element(a,'')
a<-table.row.end(a)
a<-table.row.start(a)
mymid <- hyperlink('midmean.htm', 'Midmean', 'click to view the definition of the Midmean')
mylabel <- paste(mymid,hyperlink('method_2.htm','Weighted Average at X(n+1)p',''),sep=' - ')
a<-table.element(a,mylabel,header=TRUE)
a<-table.element(a,midm[2])
a<-table.element(a,'')
a<-table.row.end(a)
a<-table.row.start(a)
mymid <- hyperlink('midmean.htm', 'Midmean', 'click to view the definition of the Midmean')
mylabel <- paste(mymid,hyperlink('method_3.htm','Empirical Distribution Function',''),sep=' - ')
a<-table.element(a,mylabel,header=TRUE)
a<-table.element(a,midm[3])
a<-table.element(a,'')
a<-table.row.end(a)
a<-table.row.start(a)
mymid <- hyperlink('midmean.htm', 'Midmean', 'click to view the definition of the Midmean')
mylabel <- paste(mymid,hyperlink('method_4.htm','Empirical Distribution Function - Averaging',''),sep=' - ')
a<-table.element(a,mylabel,header=TRUE)
a<-table.element(a,midm[4])
a<-table.element(a,'')
a<-table.row.end(a)
a<-table.row.start(a)
mymid <- hyperlink('midmean.htm', 'Midmean', 'click to view the definition of the Midmean')
mylabel <- paste(mymid,hyperlink('method_5.htm','Empirical Distribution Function - Interpolation',''),sep=' - ')
a<-table.element(a,mylabel,header=TRUE)
a<-table.element(a,midm[5])
a<-table.element(a,'')
a<-table.row.end(a)
a<-table.row.start(a)
mymid <- hyperlink('midmean.htm', 'Midmean', 'click to view the definition of the Midmean')
mylabel <- paste(mymid,hyperlink('method_6.htm','Closest Observation',''),sep=' - ')
a<-table.element(a,mylabel,header=TRUE)
a<-table.element(a,midm[6])
a<-table.element(a,'')
a<-table.row.end(a)
a<-table.row.start(a)
mymid <- hyperlink('midmean.htm', 'Midmean', 'click to view the definition of the Midmean')
mylabel <- paste(mymid,hyperlink('method_7.htm','True Basic - Statistics Graphics Toolkit',''),sep=' - ')
a<-table.element(a,mylabel,header=TRUE)
a<-table.element(a,midm[7])
a<-table.element(a,'')
a<-table.row.end(a)
a<-table.row.start(a)
mymid <- hyperlink('midmean.htm', 'Midmean', 'click to view the definition of the Midmean')
mylabel <- paste(mymid,hyperlink('method_8.htm','MS Excel (old versions)',''),sep=' - ')
a<-table.element(a,mylabel,header=TRUE)
a<-table.element(a,midm[8])
a<-table.element(a,'')
a<-table.row.end(a)
a<-table.row.start(a)
a<-table.element(a,'Number of observations',header=TRUE)
a<-table.element(a,length(x))
a<-table.element(a,'')
a<-table.row.end(a)
a<-table.end(a)
table.save(a,file='mytable.tab')