Free Statistics

of Irreproducible Research!

Author's title

Author*Unverified author*
R Software Modulerwasp_autocorrelation.wasp
Title produced by software(Partial) Autocorrelation Function
Date of computationMon, 26 Apr 2010 16:19:03 +0000
Cite this page as followsStatistical Computations at FreeStatistics.org, Office for Research Development and Education, URL https://freestatistics.org/blog/index.php?v=date/2010/Apr/26/t12722987797zjb8n3jhe4a3sx.htm/, Retrieved Sat, 20 Apr 2024 08:42:52 +0000
Statistical Computations at FreeStatistics.org, Office for Research Development and Education, URL https://freestatistics.org/blog/index.php?pk=74853, Retrieved Sat, 20 Apr 2024 08:42:52 +0000
QR Codes:

Original text written by user:
IsPrivate?No (this computation is public)
User-defined keywordsKDGP2W21
Estimated Impact127
Family? (F = Feedback message, R = changed R code, M = changed R Module, P = changed Parameters, D = changed Data)
-       [(Partial) Autocorrelation Function] [] [2010-04-26 16:19:03] [3c5691dd66ab5929cdba3f011b504b86] [Current]
Feedback Forum

Post a new message
Dataseries X:
15136
16733
20016
17708
18019
19227
22893
23739
21133
22591
26786
29740
15028
17977
20008
21354
19498
22125
25817
28779
20960
22254
27392
29945
16933
17892
20533
23569
22417
22084
26580
27454
24081
23451
28991
31386
16896
20045
23471
21747
25621
23859
25500
30998
24475
23145
29701
34365
17556
22077
25702
22214
26886
23191
27831
35406
23195
25110
30009
36242
18450
21845
26488
22394
28057
25451
24872
33424
24052
28449
33533
37351
19969
21701
26249
24493
24603
26485
30723
34569
26689
26157
32064
38870
21337
19419
23166
28286
24570
24001
33151
24878
26804
28967
33311
40226
20504
23060
23562
27562
23940
24584
34303
25517
23494
29095
32903
34379
16991
21109
23740
25552
21752
20294
29009
25500
24166
26960
31222
38641
14672
17543
25453
32683
22449
22316
27595
25451
25421
25288
32568
35110
16052
22146
21198
19543
22084
23816
29961
26773
26635
26972
30207
38687
16974
21697
24179
23757
25013
24019
30345
24488
25156
25650
30923
37240
17466
19463
24352
26805
25236
24735
29356
31234
22724
28496
32857
37198
13652
22784
23565
26323
23779
27549
29660
23356


Summary of computational transaction
Raw Inputview raw input (R code)
Raw Outputview raw output of R engine
Computing time1 seconds
R Server'George Udny Yule' @ 72.249.76.132

\begin{tabular}{lllllllll}
\hline
Summary of computational transaction \tabularnewline
Raw Input & view raw input (R code)  \tabularnewline
Raw Output & view raw output of R engine  \tabularnewline
Computing time & 1 seconds \tabularnewline
R Server & 'George Udny Yule' @ 72.249.76.132 \tabularnewline
\hline
\end{tabular}
%Source: https://freestatistics.org/blog/index.php?pk=74853&T=0

[TABLE]
[ROW][C]Summary of computational transaction[/C][/ROW]
[ROW][C]Raw Input[/C][C]view raw input (R code) [/C][/ROW]
[ROW][C]Raw Output[/C][C]view raw output of R engine [/C][/ROW]
[ROW][C]Computing time[/C][C]1 seconds[/C][/ROW]
[ROW][C]R Server[/C][C]'George Udny Yule' @ 72.249.76.132[/C][/ROW]
[/TABLE]
Source: https://freestatistics.org/blog/index.php?pk=74853&T=0

Globally Unique Identifier (entire table): ba.freestatistics.org/blog/index.php?pk=74853&T=0

As an alternative you can also use a QR Code:  

The GUIDs for individual cells are displayed in the table below:

Summary of computational transaction
Raw Inputview raw input (R code)
Raw Outputview raw output of R engine
Computing time1 seconds
R Server'George Udny Yule' @ 72.249.76.132


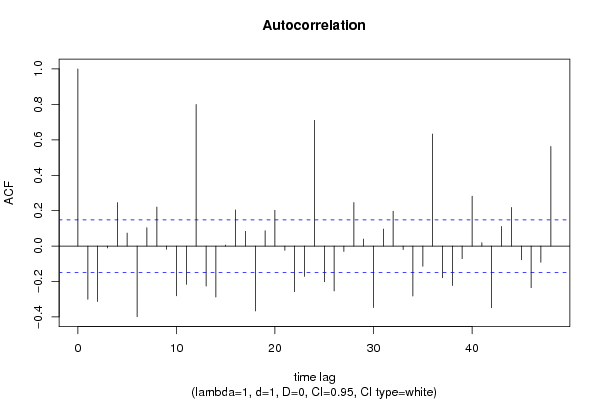
Autocorrelation Function
Time lag kACF(k)T-STATP-value
1-0.30023-3.97175.2e-05
2-0.312709-4.13682.7e-05
3-0.010389-0.13740.445422
40.246093.25550.00068
50.073340.97020.166645
6-0.398124-5.26670
70.1040061.37590.08531
80.2203732.91530.002009
9-0.018335-0.24250.404321
10-0.280445-3.70990.000139
11-0.215744-2.8540.002419
120.79937610.57470
13-0.22546-2.98250.001633
14-0.287632-3.8059.8e-05
150.0056220.07440.4704
160.204472.70490.003754
170.0836851.1070.134896
18-0.365819-4.83931e-06
190.0874171.15640.124542
200.2020072.67230.004123
21-0.023862-0.31570.376318
22-0.256923-3.39880.000419
23-0.171498-2.26870.012254
240.7098899.39090
25-0.201443-2.66480.004211
26-0.252724-3.34320.000506
27-0.030389-0.4020.344084
280.2456593.24980.000693
290.0401020.53050.298218
30-0.346818-4.5884e-06
310.0961331.27170.10258
320.1970032.60610.004974
33-0.019336-0.25580.399209
34-0.281637-3.72570.000131
35-0.113925-1.50710.066796
360.632658.36920
37-0.178708-2.36410.009585
38-0.222522-2.94370.001842
39-0.071305-0.94330.173419
400.2818423.72840.00013
410.0193020.25530.399378
42-0.348096-4.60494e-06
430.1112251.47140.071495
440.218182.88630.002195
45-0.077648-1.02720.152876
46-0.234654-3.10420.001113
47-0.091412-1.20930.114096
480.5625497.44180

\begin{tabular}{lllllllll}
\hline
Autocorrelation Function \tabularnewline
Time lag k & ACF(k) & T-STAT & P-value \tabularnewline
1 & -0.30023 & -3.9717 & 5.2e-05 \tabularnewline
2 & -0.312709 & -4.1368 & 2.7e-05 \tabularnewline
3 & -0.010389 & -0.1374 & 0.445422 \tabularnewline
4 & 0.24609 & 3.2555 & 0.00068 \tabularnewline
5 & 0.07334 & 0.9702 & 0.166645 \tabularnewline
6 & -0.398124 & -5.2667 & 0 \tabularnewline
7 & 0.104006 & 1.3759 & 0.08531 \tabularnewline
8 & 0.220373 & 2.9153 & 0.002009 \tabularnewline
9 & -0.018335 & -0.2425 & 0.404321 \tabularnewline
10 & -0.280445 & -3.7099 & 0.000139 \tabularnewline
11 & -0.215744 & -2.854 & 0.002419 \tabularnewline
12 & 0.799376 & 10.5747 & 0 \tabularnewline
13 & -0.22546 & -2.9825 & 0.001633 \tabularnewline
14 & -0.287632 & -3.805 & 9.8e-05 \tabularnewline
15 & 0.005622 & 0.0744 & 0.4704 \tabularnewline
16 & 0.20447 & 2.7049 & 0.003754 \tabularnewline
17 & 0.083685 & 1.107 & 0.134896 \tabularnewline
18 & -0.365819 & -4.8393 & 1e-06 \tabularnewline
19 & 0.087417 & 1.1564 & 0.124542 \tabularnewline
20 & 0.202007 & 2.6723 & 0.004123 \tabularnewline
21 & -0.023862 & -0.3157 & 0.376318 \tabularnewline
22 & -0.256923 & -3.3988 & 0.000419 \tabularnewline
23 & -0.171498 & -2.2687 & 0.012254 \tabularnewline
24 & 0.709889 & 9.3909 & 0 \tabularnewline
25 & -0.201443 & -2.6648 & 0.004211 \tabularnewline
26 & -0.252724 & -3.3432 & 0.000506 \tabularnewline
27 & -0.030389 & -0.402 & 0.344084 \tabularnewline
28 & 0.245659 & 3.2498 & 0.000693 \tabularnewline
29 & 0.040102 & 0.5305 & 0.298218 \tabularnewline
30 & -0.346818 & -4.588 & 4e-06 \tabularnewline
31 & 0.096133 & 1.2717 & 0.10258 \tabularnewline
32 & 0.197003 & 2.6061 & 0.004974 \tabularnewline
33 & -0.019336 & -0.2558 & 0.399209 \tabularnewline
34 & -0.281637 & -3.7257 & 0.000131 \tabularnewline
35 & -0.113925 & -1.5071 & 0.066796 \tabularnewline
36 & 0.63265 & 8.3692 & 0 \tabularnewline
37 & -0.178708 & -2.3641 & 0.009585 \tabularnewline
38 & -0.222522 & -2.9437 & 0.001842 \tabularnewline
39 & -0.071305 & -0.9433 & 0.173419 \tabularnewline
40 & 0.281842 & 3.7284 & 0.00013 \tabularnewline
41 & 0.019302 & 0.2553 & 0.399378 \tabularnewline
42 & -0.348096 & -4.6049 & 4e-06 \tabularnewline
43 & 0.111225 & 1.4714 & 0.071495 \tabularnewline
44 & 0.21818 & 2.8863 & 0.002195 \tabularnewline
45 & -0.077648 & -1.0272 & 0.152876 \tabularnewline
46 & -0.234654 & -3.1042 & 0.001113 \tabularnewline
47 & -0.091412 & -1.2093 & 0.114096 \tabularnewline
48 & 0.562549 & 7.4418 & 0 \tabularnewline
\hline
\end{tabular}
%Source: https://freestatistics.org/blog/index.php?pk=74853&T=1

[TABLE]
[ROW][C]Autocorrelation Function[/C][/ROW]
[ROW][C]Time lag k[/C][C]ACF(k)[/C][C]T-STAT[/C][C]P-value[/C][/ROW]
[ROW][C]1[/C][C]-0.30023[/C][C]-3.9717[/C][C]5.2e-05[/C][/ROW]
[ROW][C]2[/C][C]-0.312709[/C][C]-4.1368[/C][C]2.7e-05[/C][/ROW]
[ROW][C]3[/C][C]-0.010389[/C][C]-0.1374[/C][C]0.445422[/C][/ROW]
[ROW][C]4[/C][C]0.24609[/C][C]3.2555[/C][C]0.00068[/C][/ROW]
[ROW][C]5[/C][C]0.07334[/C][C]0.9702[/C][C]0.166645[/C][/ROW]
[ROW][C]6[/C][C]-0.398124[/C][C]-5.2667[/C][C]0[/C][/ROW]
[ROW][C]7[/C][C]0.104006[/C][C]1.3759[/C][C]0.08531[/C][/ROW]
[ROW][C]8[/C][C]0.220373[/C][C]2.9153[/C][C]0.002009[/C][/ROW]
[ROW][C]9[/C][C]-0.018335[/C][C]-0.2425[/C][C]0.404321[/C][/ROW]
[ROW][C]10[/C][C]-0.280445[/C][C]-3.7099[/C][C]0.000139[/C][/ROW]
[ROW][C]11[/C][C]-0.215744[/C][C]-2.854[/C][C]0.002419[/C][/ROW]
[ROW][C]12[/C][C]0.799376[/C][C]10.5747[/C][C]0[/C][/ROW]
[ROW][C]13[/C][C]-0.22546[/C][C]-2.9825[/C][C]0.001633[/C][/ROW]
[ROW][C]14[/C][C]-0.287632[/C][C]-3.805[/C][C]9.8e-05[/C][/ROW]
[ROW][C]15[/C][C]0.005622[/C][C]0.0744[/C][C]0.4704[/C][/ROW]
[ROW][C]16[/C][C]0.20447[/C][C]2.7049[/C][C]0.003754[/C][/ROW]
[ROW][C]17[/C][C]0.083685[/C][C]1.107[/C][C]0.134896[/C][/ROW]
[ROW][C]18[/C][C]-0.365819[/C][C]-4.8393[/C][C]1e-06[/C][/ROW]
[ROW][C]19[/C][C]0.087417[/C][C]1.1564[/C][C]0.124542[/C][/ROW]
[ROW][C]20[/C][C]0.202007[/C][C]2.6723[/C][C]0.004123[/C][/ROW]
[ROW][C]21[/C][C]-0.023862[/C][C]-0.3157[/C][C]0.376318[/C][/ROW]
[ROW][C]22[/C][C]-0.256923[/C][C]-3.3988[/C][C]0.000419[/C][/ROW]
[ROW][C]23[/C][C]-0.171498[/C][C]-2.2687[/C][C]0.012254[/C][/ROW]
[ROW][C]24[/C][C]0.709889[/C][C]9.3909[/C][C]0[/C][/ROW]
[ROW][C]25[/C][C]-0.201443[/C][C]-2.6648[/C][C]0.004211[/C][/ROW]
[ROW][C]26[/C][C]-0.252724[/C][C]-3.3432[/C][C]0.000506[/C][/ROW]
[ROW][C]27[/C][C]-0.030389[/C][C]-0.402[/C][C]0.344084[/C][/ROW]
[ROW][C]28[/C][C]0.245659[/C][C]3.2498[/C][C]0.000693[/C][/ROW]
[ROW][C]29[/C][C]0.040102[/C][C]0.5305[/C][C]0.298218[/C][/ROW]
[ROW][C]30[/C][C]-0.346818[/C][C]-4.588[/C][C]4e-06[/C][/ROW]
[ROW][C]31[/C][C]0.096133[/C][C]1.2717[/C][C]0.10258[/C][/ROW]
[ROW][C]32[/C][C]0.197003[/C][C]2.6061[/C][C]0.004974[/C][/ROW]
[ROW][C]33[/C][C]-0.019336[/C][C]-0.2558[/C][C]0.399209[/C][/ROW]
[ROW][C]34[/C][C]-0.281637[/C][C]-3.7257[/C][C]0.000131[/C][/ROW]
[ROW][C]35[/C][C]-0.113925[/C][C]-1.5071[/C][C]0.066796[/C][/ROW]
[ROW][C]36[/C][C]0.63265[/C][C]8.3692[/C][C]0[/C][/ROW]
[ROW][C]37[/C][C]-0.178708[/C][C]-2.3641[/C][C]0.009585[/C][/ROW]
[ROW][C]38[/C][C]-0.222522[/C][C]-2.9437[/C][C]0.001842[/C][/ROW]
[ROW][C]39[/C][C]-0.071305[/C][C]-0.9433[/C][C]0.173419[/C][/ROW]
[ROW][C]40[/C][C]0.281842[/C][C]3.7284[/C][C]0.00013[/C][/ROW]
[ROW][C]41[/C][C]0.019302[/C][C]0.2553[/C][C]0.399378[/C][/ROW]
[ROW][C]42[/C][C]-0.348096[/C][C]-4.6049[/C][C]4e-06[/C][/ROW]
[ROW][C]43[/C][C]0.111225[/C][C]1.4714[/C][C]0.071495[/C][/ROW]
[ROW][C]44[/C][C]0.21818[/C][C]2.8863[/C][C]0.002195[/C][/ROW]
[ROW][C]45[/C][C]-0.077648[/C][C]-1.0272[/C][C]0.152876[/C][/ROW]
[ROW][C]46[/C][C]-0.234654[/C][C]-3.1042[/C][C]0.001113[/C][/ROW]
[ROW][C]47[/C][C]-0.091412[/C][C]-1.2093[/C][C]0.114096[/C][/ROW]
[ROW][C]48[/C][C]0.562549[/C][C]7.4418[/C][C]0[/C][/ROW]
[/TABLE]
Source: https://freestatistics.org/blog/index.php?pk=74853&T=1

Globally Unique Identifier (entire table): ba.freestatistics.org/blog/index.php?pk=74853&T=1

As an alternative you can also use a QR Code:  

The GUIDs for individual cells are displayed in the table below:

Autocorrelation Function
Time lag kACF(k)T-STATP-value
1-0.30023-3.97175.2e-05
2-0.312709-4.13682.7e-05
3-0.010389-0.13740.445422
40.246093.25550.00068
50.073340.97020.166645
6-0.398124-5.26670
70.1040061.37590.08531
80.2203732.91530.002009
9-0.018335-0.24250.404321
10-0.280445-3.70990.000139
11-0.215744-2.8540.002419
120.79937610.57470
13-0.22546-2.98250.001633
14-0.287632-3.8059.8e-05
150.0056220.07440.4704
160.204472.70490.003754
170.0836851.1070.134896
18-0.365819-4.83931e-06
190.0874171.15640.124542
200.2020072.67230.004123
21-0.023862-0.31570.376318
22-0.256923-3.39880.000419
23-0.171498-2.26870.012254
240.7098899.39090
25-0.201443-2.66480.004211
26-0.252724-3.34320.000506
27-0.030389-0.4020.344084
280.2456593.24980.000693
290.0401020.53050.298218
30-0.346818-4.5884e-06
310.0961331.27170.10258
320.1970032.60610.004974
33-0.019336-0.25580.399209
34-0.281637-3.72570.000131
35-0.113925-1.50710.066796
360.632658.36920
37-0.178708-2.36410.009585
38-0.222522-2.94370.001842
39-0.071305-0.94330.173419
400.2818423.72840.00013
410.0193020.25530.399378
42-0.348096-4.60494e-06
430.1112251.47140.071495
440.218182.88630.002195
45-0.077648-1.02720.152876
46-0.234654-3.10420.001113
47-0.091412-1.20930.114096
480.5625497.44180


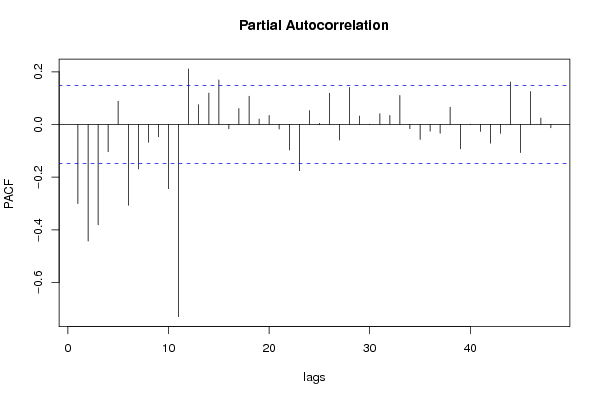
Partial Autocorrelation Function
Time lag kPACF(k)T-STATP-value
1-0.30023-3.97175.2e-05
2-0.442756-5.85710
3-0.381095-5.04141e-06
4-0.103403-1.36790.086549
50.0881211.16570.122654
6-0.307156-4.06333.6e-05
7-0.168772-2.23260.01342
8-0.067688-0.89540.185895
9-0.047058-0.62250.267207
10-0.243965-3.22730.000746
11-0.729851-9.6550
120.2108192.78890.002937
130.0749820.99190.161305
140.1191691.57650.058364
150.1690092.23580.013315
16-0.016307-0.21570.414726
170.0605210.80060.212217
180.1071781.41780.079009
190.0204390.27040.393593
200.0342020.45240.325753
21-0.017577-0.23250.408204
22-0.096915-1.28210.100757
23-0.17553-2.3220.010691
240.0527530.69790.243097
250.0043540.05760.477067
260.1187091.57040.059068
27-0.058653-0.77590.219427
280.1405421.85920.032339
290.03180.42070.337252
300.0009830.0130.494822
310.0407520.53910.295254
320.0342270.45280.325634
330.110121.45670.073489
34-0.016118-0.21320.415701
35-0.056965-0.75360.22606
36-0.025372-0.33560.368771
37-0.033822-0.44740.327559
380.0656810.86890.193051
39-0.092492-1.22360.111382
400.0012680.01680.493318
41-0.026523-0.35090.363056
42-0.071254-0.94260.173591
43-0.033818-0.44740.32758
440.1608212.12750.017391
45-0.10666-1.4110.080014
460.1252341.65670.049687
470.0244290.32320.373477
48-0.012566-0.16620.434081

\begin{tabular}{lllllllll}
\hline
Partial Autocorrelation Function \tabularnewline
Time lag k & PACF(k) & T-STAT & P-value \tabularnewline
1 & -0.30023 & -3.9717 & 5.2e-05 \tabularnewline
2 & -0.442756 & -5.8571 & 0 \tabularnewline
3 & -0.381095 & -5.0414 & 1e-06 \tabularnewline
4 & -0.103403 & -1.3679 & 0.086549 \tabularnewline
5 & 0.088121 & 1.1657 & 0.122654 \tabularnewline
6 & -0.307156 & -4.0633 & 3.6e-05 \tabularnewline
7 & -0.168772 & -2.2326 & 0.01342 \tabularnewline
8 & -0.067688 & -0.8954 & 0.185895 \tabularnewline
9 & -0.047058 & -0.6225 & 0.267207 \tabularnewline
10 & -0.243965 & -3.2273 & 0.000746 \tabularnewline
11 & -0.729851 & -9.655 & 0 \tabularnewline
12 & 0.210819 & 2.7889 & 0.002937 \tabularnewline
13 & 0.074982 & 0.9919 & 0.161305 \tabularnewline
14 & 0.119169 & 1.5765 & 0.058364 \tabularnewline
15 & 0.169009 & 2.2358 & 0.013315 \tabularnewline
16 & -0.016307 & -0.2157 & 0.414726 \tabularnewline
17 & 0.060521 & 0.8006 & 0.212217 \tabularnewline
18 & 0.107178 & 1.4178 & 0.079009 \tabularnewline
19 & 0.020439 & 0.2704 & 0.393593 \tabularnewline
20 & 0.034202 & 0.4524 & 0.325753 \tabularnewline
21 & -0.017577 & -0.2325 & 0.408204 \tabularnewline
22 & -0.096915 & -1.2821 & 0.100757 \tabularnewline
23 & -0.17553 & -2.322 & 0.010691 \tabularnewline
24 & 0.052753 & 0.6979 & 0.243097 \tabularnewline
25 & 0.004354 & 0.0576 & 0.477067 \tabularnewline
26 & 0.118709 & 1.5704 & 0.059068 \tabularnewline
27 & -0.058653 & -0.7759 & 0.219427 \tabularnewline
28 & 0.140542 & 1.8592 & 0.032339 \tabularnewline
29 & 0.0318 & 0.4207 & 0.337252 \tabularnewline
30 & 0.000983 & 0.013 & 0.494822 \tabularnewline
31 & 0.040752 & 0.5391 & 0.295254 \tabularnewline
32 & 0.034227 & 0.4528 & 0.325634 \tabularnewline
33 & 0.11012 & 1.4567 & 0.073489 \tabularnewline
34 & -0.016118 & -0.2132 & 0.415701 \tabularnewline
35 & -0.056965 & -0.7536 & 0.22606 \tabularnewline
36 & -0.025372 & -0.3356 & 0.368771 \tabularnewline
37 & -0.033822 & -0.4474 & 0.327559 \tabularnewline
38 & 0.065681 & 0.8689 & 0.193051 \tabularnewline
39 & -0.092492 & -1.2236 & 0.111382 \tabularnewline
40 & 0.001268 & 0.0168 & 0.493318 \tabularnewline
41 & -0.026523 & -0.3509 & 0.363056 \tabularnewline
42 & -0.071254 & -0.9426 & 0.173591 \tabularnewline
43 & -0.033818 & -0.4474 & 0.32758 \tabularnewline
44 & 0.160821 & 2.1275 & 0.017391 \tabularnewline
45 & -0.10666 & -1.411 & 0.080014 \tabularnewline
46 & 0.125234 & 1.6567 & 0.049687 \tabularnewline
47 & 0.024429 & 0.3232 & 0.373477 \tabularnewline
48 & -0.012566 & -0.1662 & 0.434081 \tabularnewline
\hline
\end{tabular}
%Source: https://freestatistics.org/blog/index.php?pk=74853&T=2

[TABLE]
[ROW][C]Partial Autocorrelation Function[/C][/ROW]
[ROW][C]Time lag k[/C][C]PACF(k)[/C][C]T-STAT[/C][C]P-value[/C][/ROW]
[ROW][C]1[/C][C]-0.30023[/C][C]-3.9717[/C][C]5.2e-05[/C][/ROW]
[ROW][C]2[/C][C]-0.442756[/C][C]-5.8571[/C][C]0[/C][/ROW]
[ROW][C]3[/C][C]-0.381095[/C][C]-5.0414[/C][C]1e-06[/C][/ROW]
[ROW][C]4[/C][C]-0.103403[/C][C]-1.3679[/C][C]0.086549[/C][/ROW]
[ROW][C]5[/C][C]0.088121[/C][C]1.1657[/C][C]0.122654[/C][/ROW]
[ROW][C]6[/C][C]-0.307156[/C][C]-4.0633[/C][C]3.6e-05[/C][/ROW]
[ROW][C]7[/C][C]-0.168772[/C][C]-2.2326[/C][C]0.01342[/C][/ROW]
[ROW][C]8[/C][C]-0.067688[/C][C]-0.8954[/C][C]0.185895[/C][/ROW]
[ROW][C]9[/C][C]-0.047058[/C][C]-0.6225[/C][C]0.267207[/C][/ROW]
[ROW][C]10[/C][C]-0.243965[/C][C]-3.2273[/C][C]0.000746[/C][/ROW]
[ROW][C]11[/C][C]-0.729851[/C][C]-9.655[/C][C]0[/C][/ROW]
[ROW][C]12[/C][C]0.210819[/C][C]2.7889[/C][C]0.002937[/C][/ROW]
[ROW][C]13[/C][C]0.074982[/C][C]0.9919[/C][C]0.161305[/C][/ROW]
[ROW][C]14[/C][C]0.119169[/C][C]1.5765[/C][C]0.058364[/C][/ROW]
[ROW][C]15[/C][C]0.169009[/C][C]2.2358[/C][C]0.013315[/C][/ROW]
[ROW][C]16[/C][C]-0.016307[/C][C]-0.2157[/C][C]0.414726[/C][/ROW]
[ROW][C]17[/C][C]0.060521[/C][C]0.8006[/C][C]0.212217[/C][/ROW]
[ROW][C]18[/C][C]0.107178[/C][C]1.4178[/C][C]0.079009[/C][/ROW]
[ROW][C]19[/C][C]0.020439[/C][C]0.2704[/C][C]0.393593[/C][/ROW]
[ROW][C]20[/C][C]0.034202[/C][C]0.4524[/C][C]0.325753[/C][/ROW]
[ROW][C]21[/C][C]-0.017577[/C][C]-0.2325[/C][C]0.408204[/C][/ROW]
[ROW][C]22[/C][C]-0.096915[/C][C]-1.2821[/C][C]0.100757[/C][/ROW]
[ROW][C]23[/C][C]-0.17553[/C][C]-2.322[/C][C]0.010691[/C][/ROW]
[ROW][C]24[/C][C]0.052753[/C][C]0.6979[/C][C]0.243097[/C][/ROW]
[ROW][C]25[/C][C]0.004354[/C][C]0.0576[/C][C]0.477067[/C][/ROW]
[ROW][C]26[/C][C]0.118709[/C][C]1.5704[/C][C]0.059068[/C][/ROW]
[ROW][C]27[/C][C]-0.058653[/C][C]-0.7759[/C][C]0.219427[/C][/ROW]
[ROW][C]28[/C][C]0.140542[/C][C]1.8592[/C][C]0.032339[/C][/ROW]
[ROW][C]29[/C][C]0.0318[/C][C]0.4207[/C][C]0.337252[/C][/ROW]
[ROW][C]30[/C][C]0.000983[/C][C]0.013[/C][C]0.494822[/C][/ROW]
[ROW][C]31[/C][C]0.040752[/C][C]0.5391[/C][C]0.295254[/C][/ROW]
[ROW][C]32[/C][C]0.034227[/C][C]0.4528[/C][C]0.325634[/C][/ROW]
[ROW][C]33[/C][C]0.11012[/C][C]1.4567[/C][C]0.073489[/C][/ROW]
[ROW][C]34[/C][C]-0.016118[/C][C]-0.2132[/C][C]0.415701[/C][/ROW]
[ROW][C]35[/C][C]-0.056965[/C][C]-0.7536[/C][C]0.22606[/C][/ROW]
[ROW][C]36[/C][C]-0.025372[/C][C]-0.3356[/C][C]0.368771[/C][/ROW]
[ROW][C]37[/C][C]-0.033822[/C][C]-0.4474[/C][C]0.327559[/C][/ROW]
[ROW][C]38[/C][C]0.065681[/C][C]0.8689[/C][C]0.193051[/C][/ROW]
[ROW][C]39[/C][C]-0.092492[/C][C]-1.2236[/C][C]0.111382[/C][/ROW]
[ROW][C]40[/C][C]0.001268[/C][C]0.0168[/C][C]0.493318[/C][/ROW]
[ROW][C]41[/C][C]-0.026523[/C][C]-0.3509[/C][C]0.363056[/C][/ROW]
[ROW][C]42[/C][C]-0.071254[/C][C]-0.9426[/C][C]0.173591[/C][/ROW]
[ROW][C]43[/C][C]-0.033818[/C][C]-0.4474[/C][C]0.32758[/C][/ROW]
[ROW][C]44[/C][C]0.160821[/C][C]2.1275[/C][C]0.017391[/C][/ROW]
[ROW][C]45[/C][C]-0.10666[/C][C]-1.411[/C][C]0.080014[/C][/ROW]
[ROW][C]46[/C][C]0.125234[/C][C]1.6567[/C][C]0.049687[/C][/ROW]
[ROW][C]47[/C][C]0.024429[/C][C]0.3232[/C][C]0.373477[/C][/ROW]
[ROW][C]48[/C][C]-0.012566[/C][C]-0.1662[/C][C]0.434081[/C][/ROW]
[/TABLE]
Source: https://freestatistics.org/blog/index.php?pk=74853&T=2

Globally Unique Identifier (entire table): ba.freestatistics.org/blog/index.php?pk=74853&T=2

As an alternative you can also use a QR Code:  

The GUIDs for individual cells are displayed in the table below:

Partial Autocorrelation Function
Time lag kPACF(k)T-STATP-value
1-0.30023-3.97175.2e-05
2-0.442756-5.85710
3-0.381095-5.04141e-06
4-0.103403-1.36790.086549
50.0881211.16570.122654
6-0.307156-4.06333.6e-05
7-0.168772-2.23260.01342
8-0.067688-0.89540.185895
9-0.047058-0.62250.267207
10-0.243965-3.22730.000746
11-0.729851-9.6550
120.2108192.78890.002937
130.0749820.99190.161305
140.1191691.57650.058364
150.1690092.23580.013315
16-0.016307-0.21570.414726
170.0605210.80060.212217
180.1071781.41780.079009
190.0204390.27040.393593
200.0342020.45240.325753
21-0.017577-0.23250.408204
22-0.096915-1.28210.100757
23-0.17553-2.3220.010691
240.0527530.69790.243097
250.0043540.05760.477067
260.1187091.57040.059068
27-0.058653-0.77590.219427
280.1405421.85920.032339
290.03180.42070.337252
300.0009830.0130.494822
310.0407520.53910.295254
320.0342270.45280.325634
330.110121.45670.073489
34-0.016118-0.21320.415701
35-0.056965-0.75360.22606
36-0.025372-0.33560.368771
37-0.033822-0.44740.327559
380.0656810.86890.193051
39-0.092492-1.22360.111382
400.0012680.01680.493318
41-0.026523-0.35090.363056
42-0.071254-0.94260.173591
43-0.033818-0.44740.32758
440.1608212.12750.017391
45-0.10666-1.4110.080014
460.1252341.65670.049687
470.0244290.32320.373477
48-0.012566-0.16620.434081


Parameters (Session):
par1 = 48 ; par2 = 1 ; par3 = 1 ; par4 = 0 ; par5 = 12 ; par6 = White Noise ; par7 = 0.95 ;
Parameters (R input):
par1 = 48 ; par2 = 1 ; par3 = 1 ; par4 = 0 ; par5 = 12 ; par6 = White Noise ; par7 = 0.95 ;
R code (references can be found in the software module):
if (par1 == 'Default') {
par1 = 10*log10(length(x))
} else {
par1 <- as.numeric(par1)
}
par2 <- as.numeric(par2)
par3 <- as.numeric(par3)
par4 <- as.numeric(par4)
par5 <- as.numeric(par5)
if (par6 == 'White Noise') par6 <- 'white' else par6 <- 'ma'
par7 <- as.numeric(par7)
if (par2 == 0) {
x <- log(x)
} else {
x <- (x ^ par2 - 1) / par2
}
if (par3 > 0) x <- diff(x,lag=1,difference=par3)
if (par4 > 0) x <- diff(x,lag=par5,difference=par4)
bitmap(file='pic1.png')
racf <- acf(x, par1, main='Autocorrelation', xlab='time lag', ylab='ACF', ci.type=par6, ci=par7, sub=paste('(lambda=',par2,', d=',par3,', D=',par4,', CI=', par7, ', CI type=',par6,')',sep=''))
dev.off()
bitmap(file='pic2.png')
rpacf <- pacf(x,par1,main='Partial Autocorrelation',xlab='lags',ylab='PACF')
dev.off()
(myacf <- c(racf$acf))
(mypacf <- c(rpacf$acf))
lengthx <- length(x)
sqrtn <- sqrt(lengthx)
load(file='createtable')
a<-table.start()
a<-table.row.start(a)
a<-table.element(a,'Autocorrelation Function',4,TRUE)
a<-table.row.end(a)
a<-table.row.start(a)
a<-table.element(a,'Time lag k',header=TRUE)
a<-table.element(a,hyperlink('basics.htm','ACF(k)','click here for more information about the Autocorrelation Function'),header=TRUE)
a<-table.element(a,'T-STAT',header=TRUE)
a<-table.element(a,'P-value',header=TRUE)
a<-table.row.end(a)
for (i in 2:(par1+1)) {
a<-table.row.start(a)
a<-table.element(a,i-1,header=TRUE)
a<-table.element(a,round(myacf[i],6))
mytstat <- myacf[i]*sqrtn
a<-table.element(a,round(mytstat,4))
a<-table.element(a,round(1-pt(abs(mytstat),lengthx),6))
a<-table.row.end(a)
}
a<-table.end(a)
table.save(a,file='mytable.tab')
a<-table.start()
a<-table.row.start(a)
a<-table.element(a,'Partial Autocorrelation Function',4,TRUE)
a<-table.row.end(a)
a<-table.row.start(a)
a<-table.element(a,'Time lag k',header=TRUE)
a<-table.element(a,hyperlink('basics.htm','PACF(k)','click here for more information about the Partial Autocorrelation Function'),header=TRUE)
a<-table.element(a,'T-STAT',header=TRUE)
a<-table.element(a,'P-value',header=TRUE)
a<-table.row.end(a)
for (i in 1:par1) {
a<-table.row.start(a)
a<-table.element(a,i,header=TRUE)
a<-table.element(a,round(mypacf[i],6))
mytstat <- mypacf[i]*sqrtn
a<-table.element(a,round(mytstat,4))
a<-table.element(a,round(1-pt(abs(mytstat),lengthx),6))
a<-table.row.end(a)
}
a<-table.end(a)
table.save(a,file='mytable1.tab')