Free Statistics
of Irreproducible Research!
Description of Statistical Computation | |||||||||||||||||||||
|---|---|---|---|---|---|---|---|---|---|---|---|---|---|---|---|---|---|---|---|---|---|
| Author's title | |||||||||||||||||||||
| Author | *Unverified author* | ||||||||||||||||||||
| R Software Module | rwasp_meanplot.wasp | ||||||||||||||||||||
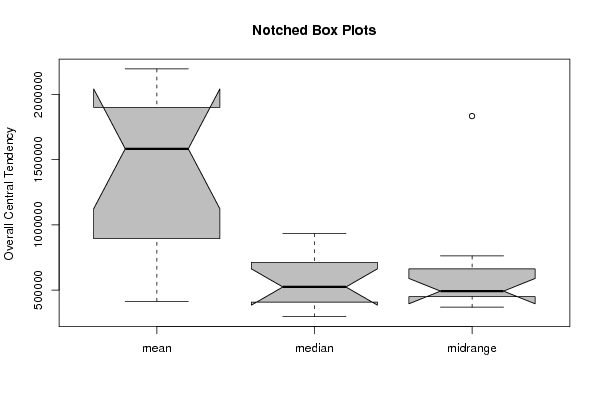
| Title produced by software | Mean Plot | ||||||||||||||||||||
| Date of computation | Mon, 26 Apr 2010 14:36:04 +0000 | ||||||||||||||||||||
| Cite this page as follows | Statistical Computations at FreeStatistics.org, Office for Research Development and Education, URL https://freestatistics.org/blog/index.php?v=date/2010/Apr/26/t12722932713ky4werht3cisqx.htm/, Retrieved Thu, 25 Apr 2024 11:23:29 +0000 | ||||||||||||||||||||
| Statistical Computations at FreeStatistics.org, Office for Research Development and Education, URL https://freestatistics.org/blog/index.php?pk=74826, Retrieved Thu, 25 Apr 2024 11:23:29 +0000 | |||||||||||||||||||||
| QR Codes: | |||||||||||||||||||||
|
| |||||||||||||||||||||
| Original text written by user: | |||||||||||||||||||||
| IsPrivate? | No (this computation is public) | ||||||||||||||||||||
| User-defined keywords | KDGP2W12 | ||||||||||||||||||||
| Estimated Impact | 173 | ||||||||||||||||||||
Tree of Dependent Computations | |||||||||||||||||||||
| Family? (F = Feedback message, R = changed R code, M = changed R Module, P = changed Parameters, D = changed Data) | |||||||||||||||||||||
| - [Mean Plot] [Katleen van den A...] [2010-04-23 13:13:26] [b39c10f74e49ba87352399c34734b08b] - D [Mean Plot] [Katleen van den A...] [2010-04-26 14:36:04] [8b7f9564fd63910ef0a86e3a376c4af8] [Current] - RMPD [(Partial) Autocorrelation Function] [Katleen van den A...] [2010-05-01 10:30:39] [b39c10f74e49ba87352399c34734b08b] - P [(Partial) Autocorrelation Function] [Katleen van den A...] [2010-05-01 10:36:45] [b39c10f74e49ba87352399c34734b08b] - PD [(Partial) Autocorrelation Function] [Katleen van den A...] [2010-05-01 10:43:00] [77c9091f06a8cdcc8e82a72554f91b5b] - PD [(Partial) Autocorrelation Function] [Katleen van den A...] [2010-05-01 10:43:00] [b39c10f74e49ba87352399c34734b08b] - D [(Partial) Autocorrelation Function] [Katleen van den A...] [2010-05-01 10:49:04] [b39c10f74e49ba87352399c34734b08b] - P [(Partial) Autocorrelation Function] [Katleen van den A...] [2010-05-07 10:03:46] [b39c10f74e49ba87352399c34734b08b] - PD [(Partial) Autocorrelation Function] [Katleen van den A...] [2010-05-01 10:51:43] [b39c10f74e49ba87352399c34734b08b] | |||||||||||||||||||||
| Feedback Forum | |||||||||||||||||||||
Post a new message | |||||||||||||||||||||
Dataset | |||||||||||||||||||||
| Dataseries X: | |||||||||||||||||||||
5714837 6015267 3415340 115612 615159 9714993 2414534 6614721 8414518 9513816 7713310 9212714 411919 3611400 710617 2410172 529569 269509 508895 308560 198397 977631 717793 57435 667628 57696 577284 677273 447200 327096 207113 616966 276765 866845 6725 576898 187085 966784 586883 476728 406853 217097 827154 526998 456977 427122 867075 157185 87059 657279 87566 67453 297553 227345 97406 187524 337651 397672 797737 717980 717784 897934 297932 108061 187927 887990 998136 288286 768212 988170 508491 438167 | |||||||||||||||||||||
Tables (Output of Computation) | |||||||||||||||||||||
| |||||||||||||||||||||
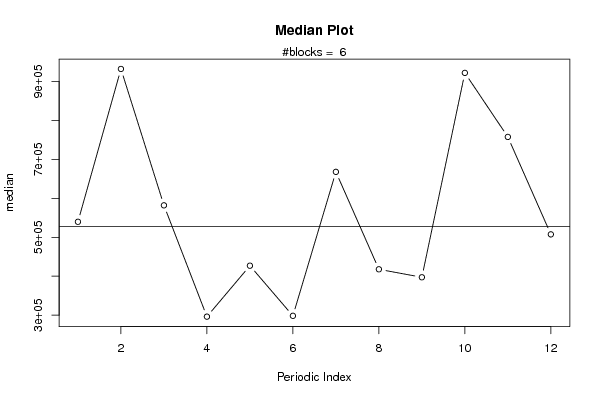
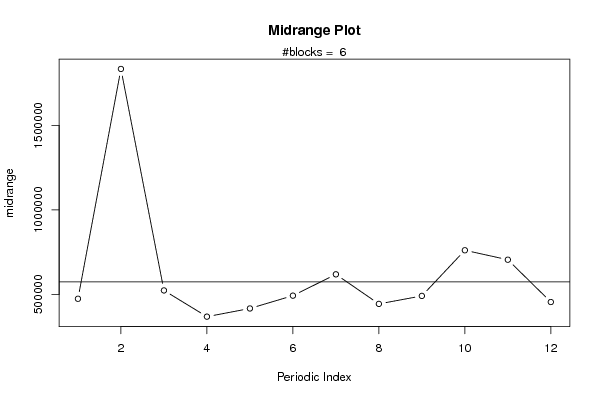
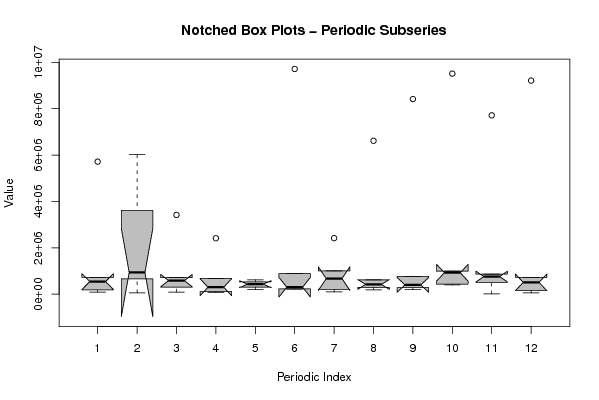
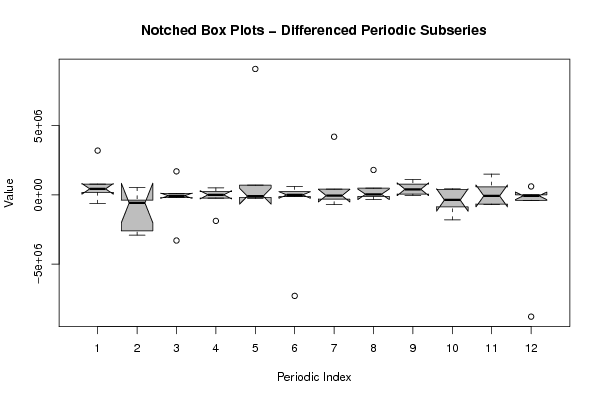
Figures (Output of Computation) | |||||||||||||||||||||
Input Parameters & R Code | |||||||||||||||||||||
| Parameters (Session): | |||||||||||||||||||||
| par1 = 12 ; | |||||||||||||||||||||
| Parameters (R input): | |||||||||||||||||||||
| par1 = 12 ; | |||||||||||||||||||||
| R code (references can be found in the software module): | |||||||||||||||||||||
par1 <- as.numeric(par1) | |||||||||||||||||||||