Free Statistics

of Irreproducible Research!

Author's title

Author*Unverified author*
R Software ModulePatrick.Wessarwasp_demand_forecasting_croston.wasp
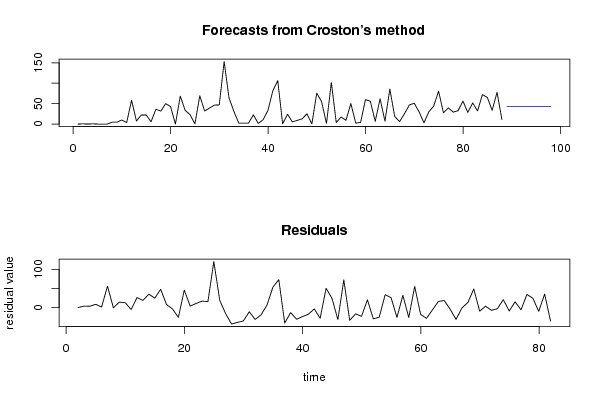
Title produced by softwareCroston Forecasting
Date of computationMon, 26 Apr 2010 13:56:50 +0000
Cite this page as followsStatistical Computations at FreeStatistics.org, Office for Research Development and Education, URL https://freestatistics.org/blog/index.php?v=date/2010/Apr/26/t12722904886xrg6j7d4xpzmnr.htm/, Retrieved Sat, 20 Apr 2024 09:52:24 +0000
Statistical Computations at FreeStatistics.org, Office for Research Development and Education, URL https://freestatistics.org/blog/index.php?pk=74820, Retrieved Sat, 20 Apr 2024 09:52:24 +0000
QR Codes:

Original text written by user:
IsPrivate?No (this computation is public)
User-defined keywordsB611,steven,coomans,thesis,forecast,croston,permaand
Estimated Impact164
Family? (F = Feedback message, R = changed R code, M = changed R Module, P = changed Parameters, D = changed Data)
-       [Croston Forecasting] [B611,steven,cooma...] [2010-04-26 13:56:50] [d41d8cd98f00b204e9800998ecf8427e] [Current]
Feedback Forum

Post a new message
Dataseries X:
0
0.5
0
0.5
0
0
0
4.5
4.5
10
3.75
58.45
7.45
22.275
22.21
5.8
36.43
31.65
50
43
0
68.5
33.5
23
0.5
69.25
32
39,213
46.426
46.855
153.135
64
31
2.25
2.25
2.3
22.6
1.5
10.65
34
81.75
106.5
0.525
24.025
5.25
9
12.8
25.05
0.3
75.75
54.75
1.526
102
3.752
17.25
9.2
50.25
2.25
3.95
60
55.8
6.75
61.95
7.025
85.75
18.525
6
25.35
46.775
51.025
30
3
30
44
80.75
27.5
39.725
29.25
32.725
56.25
28.65
51.75
32.26
72
65.4
33.75
77.85
10.875


Summary of computational transaction
Raw Inputview raw input (R code)
Raw Outputview raw output of R engine
Computing time5 seconds
R Serverwessa.org @ wessa.org

\begin{tabular}{lllllllll}
\hline
Summary of computational transaction \tabularnewline
Raw Input & view raw input (R code)  \tabularnewline
Raw Output & view raw output of R engine  \tabularnewline
Computing time & 5 seconds \tabularnewline
R Server & wessa.org @ wessa.org \tabularnewline
\hline
\end{tabular}
%Source: https://freestatistics.org/blog/index.php?pk=74820&T=0

[TABLE]
[ROW][C]Summary of computational transaction[/C][/ROW]
[ROW][C]Raw Input[/C][C]view raw input (R code) [/C][/ROW]
[ROW][C]Raw Output[/C][C]view raw output of R engine [/C][/ROW]
[ROW][C]Computing time[/C][C]5 seconds[/C][/ROW]
[ROW][C]R Server[/C][C]wessa.org @ wessa.org[/C][/ROW]
[/TABLE]
Source: https://freestatistics.org/blog/index.php?pk=74820&T=0

Globally Unique Identifier (entire table): ba.freestatistics.org/blog/index.php?pk=74820&T=0

As an alternative you can also use a QR Code:  

The GUIDs for individual cells are displayed in the table below:

Summary of computational transaction
Raw Inputview raw input (R code)
Raw Outputview raw output of R engine
Computing time5 seconds
R Serverwessa.org @ wessa.org


Demand Forecast
PointForecast95% LB80% LB80% UB95% UB
8942.4449816896765-17.4861832208233.2580992664333281.6318641129196102.376146600176
9042.4449816896765-17.78509362826403.0626522563682781.8273111229847102.675057007617
9142.4449816896765-18.08252790786172.8681704344206382.0217929449323102.972491287215
9242.4449816896765-18.37850771495542.6746396409251682.2153237384278103.268471094308
9342.4449816896765-18.67305418052032.4820460590798882.4079173202731103.563017559873
9442.4449816896765-18.96618792877292.2903762034344582.5995871759185103.856151308126
9542.4449816896765-19.25792909402362.0996169088708782.790346470482104.147892473377
9642.4449816896765-19.5482973368161.9097553200507682.9802080593022104.438260716169
9742.4449816896765-19.83731185938801.7207788813055183.1691844980475104.727275238741
9842.4449816896765-20.12499142049151.5326753269466783.3572880524063105.014954799844

\begin{tabular}{lllllllll}
\hline
Demand Forecast \tabularnewline
Point & Forecast & 95% LB & 80% LB & 80% UB & 95% UB \tabularnewline
89 & 42.4449816896765 & -17.486183220823 & 3.25809926643332 & 81.6318641129196 & 102.376146600176 \tabularnewline
90 & 42.4449816896765 & -17.7850936282640 & 3.06265225636827 & 81.8273111229847 & 102.675057007617 \tabularnewline
91 & 42.4449816896765 & -18.0825279078617 & 2.86817043442063 & 82.0217929449323 & 102.972491287215 \tabularnewline
92 & 42.4449816896765 & -18.3785077149554 & 2.67463964092516 & 82.2153237384278 & 103.268471094308 \tabularnewline
93 & 42.4449816896765 & -18.6730541805203 & 2.48204605907988 & 82.4079173202731 & 103.563017559873 \tabularnewline
94 & 42.4449816896765 & -18.9661879287729 & 2.29037620343445 & 82.5995871759185 & 103.856151308126 \tabularnewline
95 & 42.4449816896765 & -19.2579290940236 & 2.09961690887087 & 82.790346470482 & 104.147892473377 \tabularnewline
96 & 42.4449816896765 & -19.548297336816 & 1.90975532005076 & 82.9802080593022 & 104.438260716169 \tabularnewline
97 & 42.4449816896765 & -19.8373118593880 & 1.72077888130551 & 83.1691844980475 & 104.727275238741 \tabularnewline
98 & 42.4449816896765 & -20.1249914204915 & 1.53267532694667 & 83.3572880524063 & 105.014954799844 \tabularnewline
\hline
\end{tabular}
%Source: https://freestatistics.org/blog/index.php?pk=74820&T=1

[TABLE]
[ROW][C]Demand Forecast[/C][/ROW]
[ROW][C]Point[/C][C]Forecast[/C][C]95% LB[/C][C]80% LB[/C][C]80% UB[/C][C]95% UB[/C][/ROW]
[ROW][C]89[/C][C]42.4449816896765[/C][C]-17.486183220823[/C][C]3.25809926643332[/C][C]81.6318641129196[/C][C]102.376146600176[/C][/ROW]
[ROW][C]90[/C][C]42.4449816896765[/C][C]-17.7850936282640[/C][C]3.06265225636827[/C][C]81.8273111229847[/C][C]102.675057007617[/C][/ROW]
[ROW][C]91[/C][C]42.4449816896765[/C][C]-18.0825279078617[/C][C]2.86817043442063[/C][C]82.0217929449323[/C][C]102.972491287215[/C][/ROW]
[ROW][C]92[/C][C]42.4449816896765[/C][C]-18.3785077149554[/C][C]2.67463964092516[/C][C]82.2153237384278[/C][C]103.268471094308[/C][/ROW]
[ROW][C]93[/C][C]42.4449816896765[/C][C]-18.6730541805203[/C][C]2.48204605907988[/C][C]82.4079173202731[/C][C]103.563017559873[/C][/ROW]
[ROW][C]94[/C][C]42.4449816896765[/C][C]-18.9661879287729[/C][C]2.29037620343445[/C][C]82.5995871759185[/C][C]103.856151308126[/C][/ROW]
[ROW][C]95[/C][C]42.4449816896765[/C][C]-19.2579290940236[/C][C]2.09961690887087[/C][C]82.790346470482[/C][C]104.147892473377[/C][/ROW]
[ROW][C]96[/C][C]42.4449816896765[/C][C]-19.548297336816[/C][C]1.90975532005076[/C][C]82.9802080593022[/C][C]104.438260716169[/C][/ROW]
[ROW][C]97[/C][C]42.4449816896765[/C][C]-19.8373118593880[/C][C]1.72077888130551[/C][C]83.1691844980475[/C][C]104.727275238741[/C][/ROW]
[ROW][C]98[/C][C]42.4449816896765[/C][C]-20.1249914204915[/C][C]1.53267532694667[/C][C]83.3572880524063[/C][C]105.014954799844[/C][/ROW]
[/TABLE]
Source: https://freestatistics.org/blog/index.php?pk=74820&T=1

Globally Unique Identifier (entire table): ba.freestatistics.org/blog/index.php?pk=74820&T=1

As an alternative you can also use a QR Code:  

The GUIDs for individual cells are displayed in the table below:

Demand Forecast
PointForecast95% LB80% LB80% UB95% UB
8942.4449816896765-17.4861832208233.2580992664333281.6318641129196102.376146600176
9042.4449816896765-17.78509362826403.0626522563682781.8273111229847102.675057007617
9142.4449816896765-18.08252790786172.8681704344206382.0217929449323102.972491287215
9242.4449816896765-18.37850771495542.6746396409251682.2153237384278103.268471094308
9342.4449816896765-18.67305418052032.4820460590798882.4079173202731103.563017559873
9442.4449816896765-18.96618792877292.2903762034344582.5995871759185103.856151308126
9542.4449816896765-19.25792909402362.0996169088708782.790346470482104.147892473377
9642.4449816896765-19.5482973368161.9097553200507682.9802080593022104.438260716169
9742.4449816896765-19.83731185938801.7207788813055183.1691844980475104.727275238741
9842.4449816896765-20.12499142049151.5326753269466783.3572880524063105.014954799844


Actuals and Interpolation
TimeActualForecast
10NA
20.5NA
300.25
40.50.25
500.25
600.25
700.25
84.50.25
94.50.409090909090909
10100.60576923076923
113.751.08215010141988
1258.451.22445060806486
137.454.42620235883893
1422.2754.60317876515579
1522.215.68222292183592
165.86.73230145884357
1736.436.67082673591613
1831.658.70230192769576
195010.3201438271359
204313.2026545533481
21015.4281382898409
2268.515.4281382898409
2333.518.1073612864325
242319.2354225596963
250.519.5188849719695
2669.2518.0505427550403
273222.0955766284452
2839.21322.8948602472724
2946.42624.2376448062988
3046.85526.0963992922845
31153.13527.8640673133504
326438.6920867129805
333140.9096998383156
342.2540.0304794602628
352.2536.6402430694141
362.333.5222239475904
3722.630.6647637477155
381.529.9203635247716
3910.6527.2767360320706
403425.7192643044733
4181.7526.4998825937528
42106.531.7382869668445
430.52538.8635976359932
4424.02535.1924339553087
455.2534.118524073019
46931.3317099801819
4712.829.16842879075
4825.0527.5778349475401
490.327.3314978305258
5075.7524.6905477905730
5154.7529.6905096700156
521.52632.1495472812321
5310229.1388839334106
543.75236.3141202793457
5517.2533.102572024096
569.231.5369114376114
5750.2529.3281022302393
582.2531.3992934872701
593.9528.510721034102
606026.0746541221805
6155.829.4422988599490
626.7532.0606522375897
6361.9529.5446493440406
647.02532.767818138103
6585.7530.2059591749421
6618.52535.7362278415582
67634.021838860801
6825.3531.2295258955398
6946.77530.6434379625934
7051.02532.251988279695
713034.1244640074976
72333.7129719948635
733030.6480724731703
744430.5833867484609
7580.7531.9227834274344
7627.536.7980862576207
7739.72535.8695493045712
7829.2536.2546197401134
7932.72535.5549339492932
8056.2535.2722228125884
8128.6537.3681172482578
8251.7536.4970099899227
8332.2638.0211996367501
847237.4454568127827
8565.440.8988751893646
8633.7543.3476883555938
8777.8542.3883776203165
8810.87545.9330164519578

\begin{tabular}{lllllllll}
\hline
Actuals and Interpolation \tabularnewline
Time & Actual & Forecast \tabularnewline
1 & 0 & NA \tabularnewline
2 & 0.5 & NA \tabularnewline
3 & 0 & 0.25 \tabularnewline
4 & 0.5 & 0.25 \tabularnewline
5 & 0 & 0.25 \tabularnewline
6 & 0 & 0.25 \tabularnewline
7 & 0 & 0.25 \tabularnewline
8 & 4.5 & 0.25 \tabularnewline
9 & 4.5 & 0.409090909090909 \tabularnewline
10 & 10 & 0.60576923076923 \tabularnewline
11 & 3.75 & 1.08215010141988 \tabularnewline
12 & 58.45 & 1.22445060806486 \tabularnewline
13 & 7.45 & 4.42620235883893 \tabularnewline
14 & 22.275 & 4.60317876515579 \tabularnewline
15 & 22.21 & 5.68222292183592 \tabularnewline
16 & 5.8 & 6.73230145884357 \tabularnewline
17 & 36.43 & 6.67082673591613 \tabularnewline
18 & 31.65 & 8.70230192769576 \tabularnewline
19 & 50 & 10.3201438271359 \tabularnewline
20 & 43 & 13.2026545533481 \tabularnewline
21 & 0 & 15.4281382898409 \tabularnewline
22 & 68.5 & 15.4281382898409 \tabularnewline
23 & 33.5 & 18.1073612864325 \tabularnewline
24 & 23 & 19.2354225596963 \tabularnewline
25 & 0.5 & 19.5188849719695 \tabularnewline
26 & 69.25 & 18.0505427550403 \tabularnewline
27 & 32 & 22.0955766284452 \tabularnewline
28 & 39.213 & 22.8948602472724 \tabularnewline
29 & 46.426 & 24.2376448062988 \tabularnewline
30 & 46.855 & 26.0963992922845 \tabularnewline
31 & 153.135 & 27.8640673133504 \tabularnewline
32 & 64 & 38.6920867129805 \tabularnewline
33 & 31 & 40.9096998383156 \tabularnewline
34 & 2.25 & 40.0304794602628 \tabularnewline
35 & 2.25 & 36.6402430694141 \tabularnewline
36 & 2.3 & 33.5222239475904 \tabularnewline
37 & 22.6 & 30.6647637477155 \tabularnewline
38 & 1.5 & 29.9203635247716 \tabularnewline
39 & 10.65 & 27.2767360320706 \tabularnewline
40 & 34 & 25.7192643044733 \tabularnewline
41 & 81.75 & 26.4998825937528 \tabularnewline
42 & 106.5 & 31.7382869668445 \tabularnewline
43 & 0.525 & 38.8635976359932 \tabularnewline
44 & 24.025 & 35.1924339553087 \tabularnewline
45 & 5.25 & 34.118524073019 \tabularnewline
46 & 9 & 31.3317099801819 \tabularnewline
47 & 12.8 & 29.16842879075 \tabularnewline
48 & 25.05 & 27.5778349475401 \tabularnewline
49 & 0.3 & 27.3314978305258 \tabularnewline
50 & 75.75 & 24.6905477905730 \tabularnewline
51 & 54.75 & 29.6905096700156 \tabularnewline
52 & 1.526 & 32.1495472812321 \tabularnewline
53 & 102 & 29.1388839334106 \tabularnewline
54 & 3.752 & 36.3141202793457 \tabularnewline
55 & 17.25 & 33.102572024096 \tabularnewline
56 & 9.2 & 31.5369114376114 \tabularnewline
57 & 50.25 & 29.3281022302393 \tabularnewline
58 & 2.25 & 31.3992934872701 \tabularnewline
59 & 3.95 & 28.510721034102 \tabularnewline
60 & 60 & 26.0746541221805 \tabularnewline
61 & 55.8 & 29.4422988599490 \tabularnewline
62 & 6.75 & 32.0606522375897 \tabularnewline
63 & 61.95 & 29.5446493440406 \tabularnewline
64 & 7.025 & 32.767818138103 \tabularnewline
65 & 85.75 & 30.2059591749421 \tabularnewline
66 & 18.525 & 35.7362278415582 \tabularnewline
67 & 6 & 34.021838860801 \tabularnewline
68 & 25.35 & 31.2295258955398 \tabularnewline
69 & 46.775 & 30.6434379625934 \tabularnewline
70 & 51.025 & 32.251988279695 \tabularnewline
71 & 30 & 34.1244640074976 \tabularnewline
72 & 3 & 33.7129719948635 \tabularnewline
73 & 30 & 30.6480724731703 \tabularnewline
74 & 44 & 30.5833867484609 \tabularnewline
75 & 80.75 & 31.9227834274344 \tabularnewline
76 & 27.5 & 36.7980862576207 \tabularnewline
77 & 39.725 & 35.8695493045712 \tabularnewline
78 & 29.25 & 36.2546197401134 \tabularnewline
79 & 32.725 & 35.5549339492932 \tabularnewline
80 & 56.25 & 35.2722228125884 \tabularnewline
81 & 28.65 & 37.3681172482578 \tabularnewline
82 & 51.75 & 36.4970099899227 \tabularnewline
83 & 32.26 & 38.0211996367501 \tabularnewline
84 & 72 & 37.4454568127827 \tabularnewline
85 & 65.4 & 40.8988751893646 \tabularnewline
86 & 33.75 & 43.3476883555938 \tabularnewline
87 & 77.85 & 42.3883776203165 \tabularnewline
88 & 10.875 & 45.9330164519578 \tabularnewline
\hline
\end{tabular}
%Source: https://freestatistics.org/blog/index.php?pk=74820&T=2

[TABLE]
[ROW][C]Actuals and Interpolation[/C][/ROW]
[ROW][C]Time[/C][C]Actual[/C][C]Forecast[/C][/ROW]
[ROW][C]1[/C][C]0[/C][C]NA[/C][/ROW]
[ROW][C]2[/C][C]0.5[/C][C]NA[/C][/ROW]
[ROW][C]3[/C][C]0[/C][C]0.25[/C][/ROW]
[ROW][C]4[/C][C]0.5[/C][C]0.25[/C][/ROW]
[ROW][C]5[/C][C]0[/C][C]0.25[/C][/ROW]
[ROW][C]6[/C][C]0[/C][C]0.25[/C][/ROW]
[ROW][C]7[/C][C]0[/C][C]0.25[/C][/ROW]
[ROW][C]8[/C][C]4.5[/C][C]0.25[/C][/ROW]
[ROW][C]9[/C][C]4.5[/C][C]0.409090909090909[/C][/ROW]
[ROW][C]10[/C][C]10[/C][C]0.60576923076923[/C][/ROW]
[ROW][C]11[/C][C]3.75[/C][C]1.08215010141988[/C][/ROW]
[ROW][C]12[/C][C]58.45[/C][C]1.22445060806486[/C][/ROW]
[ROW][C]13[/C][C]7.45[/C][C]4.42620235883893[/C][/ROW]
[ROW][C]14[/C][C]22.275[/C][C]4.60317876515579[/C][/ROW]
[ROW][C]15[/C][C]22.21[/C][C]5.68222292183592[/C][/ROW]
[ROW][C]16[/C][C]5.8[/C][C]6.73230145884357[/C][/ROW]
[ROW][C]17[/C][C]36.43[/C][C]6.67082673591613[/C][/ROW]
[ROW][C]18[/C][C]31.65[/C][C]8.70230192769576[/C][/ROW]
[ROW][C]19[/C][C]50[/C][C]10.3201438271359[/C][/ROW]
[ROW][C]20[/C][C]43[/C][C]13.2026545533481[/C][/ROW]
[ROW][C]21[/C][C]0[/C][C]15.4281382898409[/C][/ROW]
[ROW][C]22[/C][C]68.5[/C][C]15.4281382898409[/C][/ROW]
[ROW][C]23[/C][C]33.5[/C][C]18.1073612864325[/C][/ROW]
[ROW][C]24[/C][C]23[/C][C]19.2354225596963[/C][/ROW]
[ROW][C]25[/C][C]0.5[/C][C]19.5188849719695[/C][/ROW]
[ROW][C]26[/C][C]69.25[/C][C]18.0505427550403[/C][/ROW]
[ROW][C]27[/C][C]32[/C][C]22.0955766284452[/C][/ROW]
[ROW][C]28[/C][C]39.213[/C][C]22.8948602472724[/C][/ROW]
[ROW][C]29[/C][C]46.426[/C][C]24.2376448062988[/C][/ROW]
[ROW][C]30[/C][C]46.855[/C][C]26.0963992922845[/C][/ROW]
[ROW][C]31[/C][C]153.135[/C][C]27.8640673133504[/C][/ROW]
[ROW][C]32[/C][C]64[/C][C]38.6920867129805[/C][/ROW]
[ROW][C]33[/C][C]31[/C][C]40.9096998383156[/C][/ROW]
[ROW][C]34[/C][C]2.25[/C][C]40.0304794602628[/C][/ROW]
[ROW][C]35[/C][C]2.25[/C][C]36.6402430694141[/C][/ROW]
[ROW][C]36[/C][C]2.3[/C][C]33.5222239475904[/C][/ROW]
[ROW][C]37[/C][C]22.6[/C][C]30.6647637477155[/C][/ROW]
[ROW][C]38[/C][C]1.5[/C][C]29.9203635247716[/C][/ROW]
[ROW][C]39[/C][C]10.65[/C][C]27.2767360320706[/C][/ROW]
[ROW][C]40[/C][C]34[/C][C]25.7192643044733[/C][/ROW]
[ROW][C]41[/C][C]81.75[/C][C]26.4998825937528[/C][/ROW]
[ROW][C]42[/C][C]106.5[/C][C]31.7382869668445[/C][/ROW]
[ROW][C]43[/C][C]0.525[/C][C]38.8635976359932[/C][/ROW]
[ROW][C]44[/C][C]24.025[/C][C]35.1924339553087[/C][/ROW]
[ROW][C]45[/C][C]5.25[/C][C]34.118524073019[/C][/ROW]
[ROW][C]46[/C][C]9[/C][C]31.3317099801819[/C][/ROW]
[ROW][C]47[/C][C]12.8[/C][C]29.16842879075[/C][/ROW]
[ROW][C]48[/C][C]25.05[/C][C]27.5778349475401[/C][/ROW]
[ROW][C]49[/C][C]0.3[/C][C]27.3314978305258[/C][/ROW]
[ROW][C]50[/C][C]75.75[/C][C]24.6905477905730[/C][/ROW]
[ROW][C]51[/C][C]54.75[/C][C]29.6905096700156[/C][/ROW]
[ROW][C]52[/C][C]1.526[/C][C]32.1495472812321[/C][/ROW]
[ROW][C]53[/C][C]102[/C][C]29.1388839334106[/C][/ROW]
[ROW][C]54[/C][C]3.752[/C][C]36.3141202793457[/C][/ROW]
[ROW][C]55[/C][C]17.25[/C][C]33.102572024096[/C][/ROW]
[ROW][C]56[/C][C]9.2[/C][C]31.5369114376114[/C][/ROW]
[ROW][C]57[/C][C]50.25[/C][C]29.3281022302393[/C][/ROW]
[ROW][C]58[/C][C]2.25[/C][C]31.3992934872701[/C][/ROW]
[ROW][C]59[/C][C]3.95[/C][C]28.510721034102[/C][/ROW]
[ROW][C]60[/C][C]60[/C][C]26.0746541221805[/C][/ROW]
[ROW][C]61[/C][C]55.8[/C][C]29.4422988599490[/C][/ROW]
[ROW][C]62[/C][C]6.75[/C][C]32.0606522375897[/C][/ROW]
[ROW][C]63[/C][C]61.95[/C][C]29.5446493440406[/C][/ROW]
[ROW][C]64[/C][C]7.025[/C][C]32.767818138103[/C][/ROW]
[ROW][C]65[/C][C]85.75[/C][C]30.2059591749421[/C][/ROW]
[ROW][C]66[/C][C]18.525[/C][C]35.7362278415582[/C][/ROW]
[ROW][C]67[/C][C]6[/C][C]34.021838860801[/C][/ROW]
[ROW][C]68[/C][C]25.35[/C][C]31.2295258955398[/C][/ROW]
[ROW][C]69[/C][C]46.775[/C][C]30.6434379625934[/C][/ROW]
[ROW][C]70[/C][C]51.025[/C][C]32.251988279695[/C][/ROW]
[ROW][C]71[/C][C]30[/C][C]34.1244640074976[/C][/ROW]
[ROW][C]72[/C][C]3[/C][C]33.7129719948635[/C][/ROW]
[ROW][C]73[/C][C]30[/C][C]30.6480724731703[/C][/ROW]
[ROW][C]74[/C][C]44[/C][C]30.5833867484609[/C][/ROW]
[ROW][C]75[/C][C]80.75[/C][C]31.9227834274344[/C][/ROW]
[ROW][C]76[/C][C]27.5[/C][C]36.7980862576207[/C][/ROW]
[ROW][C]77[/C][C]39.725[/C][C]35.8695493045712[/C][/ROW]
[ROW][C]78[/C][C]29.25[/C][C]36.2546197401134[/C][/ROW]
[ROW][C]79[/C][C]32.725[/C][C]35.5549339492932[/C][/ROW]
[ROW][C]80[/C][C]56.25[/C][C]35.2722228125884[/C][/ROW]
[ROW][C]81[/C][C]28.65[/C][C]37.3681172482578[/C][/ROW]
[ROW][C]82[/C][C]51.75[/C][C]36.4970099899227[/C][/ROW]
[ROW][C]83[/C][C]32.26[/C][C]38.0211996367501[/C][/ROW]
[ROW][C]84[/C][C]72[/C][C]37.4454568127827[/C][/ROW]
[ROW][C]85[/C][C]65.4[/C][C]40.8988751893646[/C][/ROW]
[ROW][C]86[/C][C]33.75[/C][C]43.3476883555938[/C][/ROW]
[ROW][C]87[/C][C]77.85[/C][C]42.3883776203165[/C][/ROW]
[ROW][C]88[/C][C]10.875[/C][C]45.9330164519578[/C][/ROW]
[/TABLE]
Source: https://freestatistics.org/blog/index.php?pk=74820&T=2

Globally Unique Identifier (entire table): ba.freestatistics.org/blog/index.php?pk=74820&T=2

As an alternative you can also use a QR Code:  

The GUIDs for individual cells are displayed in the table below:

Actuals and Interpolation
TimeActualForecast
10NA
20.5NA
300.25
40.50.25
500.25
600.25
700.25
84.50.25
94.50.409090909090909
10100.60576923076923
113.751.08215010141988
1258.451.22445060806486
137.454.42620235883893
1422.2754.60317876515579
1522.215.68222292183592
165.86.73230145884357
1736.436.67082673591613
1831.658.70230192769576
195010.3201438271359
204313.2026545533481
21015.4281382898409
2268.515.4281382898409
2333.518.1073612864325
242319.2354225596963
250.519.5188849719695
2669.2518.0505427550403
273222.0955766284452
2839.21322.8948602472724
2946.42624.2376448062988
3046.85526.0963992922845
31153.13527.8640673133504
326438.6920867129805
333140.9096998383156
342.2540.0304794602628
352.2536.6402430694141
362.333.5222239475904
3722.630.6647637477155
381.529.9203635247716
3910.6527.2767360320706
403425.7192643044733
4181.7526.4998825937528
42106.531.7382869668445
430.52538.8635976359932
4424.02535.1924339553087
455.2534.118524073019
46931.3317099801819
4712.829.16842879075
4825.0527.5778349475401
490.327.3314978305258
5075.7524.6905477905730
5154.7529.6905096700156
521.52632.1495472812321
5310229.1388839334106
543.75236.3141202793457
5517.2533.102572024096
569.231.5369114376114
5750.2529.3281022302393
582.2531.3992934872701
593.9528.510721034102
606026.0746541221805
6155.829.4422988599490
626.7532.0606522375897
6361.9529.5446493440406
647.02532.767818138103
6585.7530.2059591749421
6618.52535.7362278415582
67634.021838860801
6825.3531.2295258955398
6946.77530.6434379625934
7051.02532.251988279695
713034.1244640074976
72333.7129719948635
733030.6480724731703
744430.5833867484609
7580.7531.9227834274344
7627.536.7980862576207
7739.72535.8695493045712
7829.2536.2546197401134
7932.72535.5549339492932
8056.2535.2722228125884
8128.6537.3681172482578
8251.7536.4970099899227
8332.2638.0211996367501
847237.4454568127827
8565.440.8988751893646
8633.7543.3476883555938
8777.8542.3883776203165
8810.87545.9330164519578


\begin{tabular}{lllllllll}
\hline
What is next? \tabularnewline
Simulate Time Series \tabularnewline
Generate Forecasts \tabularnewline
Forecast Analysis \tabularnewline
\hline
\end{tabular}
%Source: https://freestatistics.org/blog/index.php?pk=74820&T=3

[TABLE]
[ROW][C]What is next?[/C][/ROW]
[ROW][C]Simulate Time Series[/C][/ROW]
[ROW][C]Generate Forecasts[/C][/ROW]
[ROW][C]Forecast Analysis[/C][/ROW]
[/TABLE]
Source: https://freestatistics.org/blog/index.php?pk=74820&T=3

Globally Unique Identifier (entire table): ba.freestatistics.org/blog/index.php?pk=74820&T=3

As an alternative you can also use a QR Code:  

The GUIDs for individual cells are displayed in the table below:

What is next?
Simulate Time Series
Generate Forecasts
Forecast Analysis


Parameters (Session):
par1 = Input box ; par2 = Croston ; par3 = NA ; par4 = NA ; par5 = ZZZ ; par6 = 12 ; par7 = dum ; par8 = B611crostonm ; par9 = 3 ; par10 = 0.1 ;
Parameters (R input):
par1 = Input box ; par2 = Croston ; par3 = NA ; par4 = NA ; par5 = ZZZ ; par6 = 12 ; par7 = dum ; par8 = B611crostonm ; par9 = 3 ; par10 = 0.1 ;
R code (references can be found in the software module):
if(par3!='NA') par3 <- as.numeric(par3) else par3 <- NA
if(par4!='NA') par4 <- as.numeric(par4) else par4 <- NA
par6 <- as.numeric(par6) #Seasonal Period
par9 <- as.numeric(par9) #Forecast Horizon
par10 <- as.numeric(par10) #Alpha
library(forecast)
if (par1 == 'CSV') {
xarr <- read.csv(file=paste('tmp/',par7,'.csv',sep=''),header=T)
numseries <- length(xarr[1,])-1
n <- length(xarr[,1])
nmh <- n - par9
nmhp1 <- nmh + 1
rarr <- array(NA,dim=c(n,numseries))
farr <- array(NA,dim=c(n,numseries))
parr <- array(NA,dim=c(numseries,8))
colnames(parr) = list('ME','RMSE','MAE','MPE','MAPE','MASE','ACF1','TheilU')
for(i in 1:numseries) {
sindex <- i+1
x <- xarr[,sindex]
if(par2=='Croston') {
if (i==1) m <- croston(x,alpha=par10)
if (i==1) mydemand <- m$model$demand[]
fit <- croston(x[1:nmh],h=par9,alpha=par10)
}
if(par2=='ARIMA') {
m <- auto.arima(ts(x,freq=par6),d=par3,D=par4)
mydemand <- forecast(m)
fit <- auto.arima(ts(x[1:nmh],freq=par6),d=par3,D=par4)
}
if(par2=='ETS') {
m <- ets(ts(x,freq=par6),model=par5)
mydemand <- forecast(m)
fit <- ets(ts(x[1:nmh],freq=par6),model=par5)
}
try(rarr[,i] <- mydemand$resid,silent=T)
try(farr[,i] <- mydemand$mean,silent=T)
if (par2!='Croston') parr[i,] <- accuracy(forecast(fit,par9),x[nmhp1:n])
if (par2=='Croston') parr[i,] <- accuracy(fit,x[nmhp1:n])
}
write.csv(farr,file=paste('tmp/',par8,'_f.csv',sep=''))
write.csv(rarr,file=paste('tmp/',par8,'_r.csv',sep=''))
write.csv(parr,file=paste('tmp/',par8,'_p.csv',sep=''))
}
if (par1 == 'Input box') {
numseries <- 1
n <- length(x)
if(par2=='Croston') {
m <- croston(x)
mydemand <- m$model$demand[]
}
if(par2=='ARIMA') {
m <- auto.arima(ts(x,freq=par6),d=par3,D=par4)
mydemand <- forecast(m)
}
if(par2=='ETS') {
m <- ets(ts(x,freq=par6),model=par5)
mydemand <- forecast(m)
}
summary(m)
}
bitmap(file='test1.png')
op <- par(mfrow=c(2,1))
if (par2=='Croston') plot(m)
if ((par2=='ARIMA') | par2=='ETS') plot(forecast(m))
plot(mydemand$resid,type='l',main='Residuals', ylab='residual value', xlab='time')
par(op)
dev.off()
bitmap(file='pic2.png')
op <- par(mfrow=c(2,2))
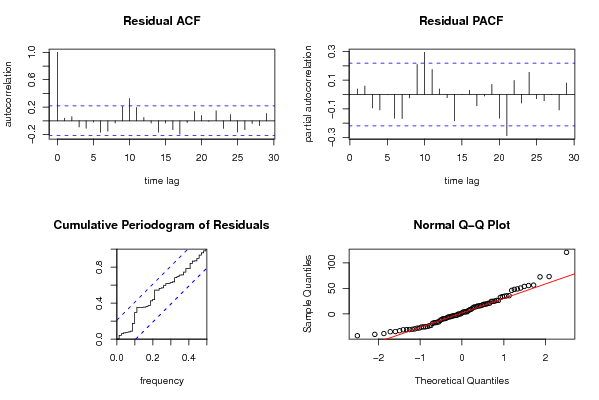
acf(mydemand$resid, lag.max=n/3, main='Residual ACF', ylab='autocorrelation', xlab='time lag')
pacf(mydemand$resid,lag.max=n/3, main='Residual PACF', ylab='partial autocorrelation', xlab='time lag')
cpgram(mydemand$resid, main='Cumulative Periodogram of Residuals')
qqnorm(mydemand$resid); qqline(mydemand$resid, col=2)
par(op)
dev.off()
load(file='createtable')
a<-table.start()
a<-table.row.start(a)
a<-table.element(a,'Demand Forecast',6,TRUE)
a<-table.row.end(a)
a<-table.row.start(a)
a<-table.element(a,'Point',header=TRUE)
a<-table.element(a,'Forecast',header=TRUE)
a<-table.element(a,'95% LB',header=TRUE)
a<-table.element(a,'80% LB',header=TRUE)
a<-table.element(a,'80% UB',header=TRUE)
a<-table.element(a,'95% UB',header=TRUE)
a<-table.row.end(a)
for (i in 1:length(mydemand$mean)) {
a<-table.row.start(a)
a<-table.element(a,i+n,header=TRUE)
a<-table.element(a,as.numeric(mydemand$mean[i]))
a<-table.element(a,as.numeric(mydemand$lower[i,2]))
a<-table.element(a,as.numeric(mydemand$lower[i,1]))
a<-table.element(a,as.numeric(mydemand$upper[i,1]))
a<-table.element(a,as.numeric(mydemand$upper[i,2]))
a<-table.row.end(a)
}
a<-table.end(a)
table.save(a,file='mytable.tab')
a<-table.start()
a<-table.row.start(a)
a<-table.element(a,'Actuals and Interpolation',3,TRUE)
a<-table.row.end(a)
a<-table.row.start(a)
a<-table.element(a,'Time',header=TRUE)
a<-table.element(a,'Actual',header=TRUE)
a<-table.element(a,'Forecast',header=TRUE)
a<-table.row.end(a)
for (i in 1:n) {
a<-table.row.start(a)
a<-table.element(a,i,header=TRUE)
a<-table.element(a,x[i])
a<-table.element(a,x[i] - as.numeric(m$resid[i]))
a<-table.row.end(a)
}
a<-table.end(a)
table.save(a,file='mytable1.tab')
a<-table.start()
a<-table.row.start(a)
a<-table.element(a,'What is next?',1,TRUE)
a<-table.row.end(a)
a<-table.row.start(a)
a<-table.element(a,hyperlink(paste('https://automated.biganalytics.eu/Patrick.Wessa/rwasp_demand_forecasting_simulate.wasp',sep=''),'Simulate Time Series','',target=''))
a<-table.row.end(a)
a<-table.row.start(a)
a<-table.element(a,hyperlink(paste('https://automated.biganalytics.eu/Patrick.Wessa/rwasp_demand_forecasting_croston.wasp',sep=''),'Generate Forecasts','',target=''))
a<-table.row.end(a)
a<-table.row.start(a)
a<-table.element(a,hyperlink(paste('https://automated.biganalytics.eu/Patrick.Wessa/rwasp_demand_forecasting_analysis.wasp',sep=''),'Forecast Analysis','',target=''))
a<-table.row.end(a)
a<-table.end(a)
table.save(a,file='mytable0.tab')
-SERVER-wessa.org