Free Statistics

of Irreproducible Research!

Author's title

Author*Unverified author*
R Software ModulePatrick.Wessarwasp_demand_forecasting_croston.wasp
Title produced by softwareCroston Forecasting
Date of computationMon, 26 Apr 2010 13:43:29 +0000
Cite this page as followsStatistical Computations at FreeStatistics.org, Office for Research Development and Education, URL https://freestatistics.org/blog/index.php?v=date/2010/Apr/26/t1272289835xuk25ug5rwm7lvk.htm/, Retrieved Sat, 20 Apr 2024 02:23:52 +0000
Statistical Computations at FreeStatistics.org, Office for Research Development and Education, URL https://freestatistics.org/blog/index.php?pk=74818, Retrieved Sat, 20 Apr 2024 02:23:52 +0000
QR Codes:

Original text written by user:
IsPrivate?No (this computation is public)
User-defined keywordsB58A,steven,coomans,thesis,forecasting,croston,permaand
Estimated Impact154
Family? (F = Feedback message, R = changed R code, M = changed R Module, P = changed Parameters, D = changed Data)
-       [Croston Forecasting] [B58A,steven,cooma...] [2010-04-26 13:43:29] [d41d8cd98f00b204e9800998ecf8427e] [Current]
Feedback Forum

Post a new message
Dataseries X:
567,5
531,25
781,25
572,5
591,5
548,75
744
634,25
634,25
313,25
674,25
769,55
758,25
488,775
690,45
559,5
687,1
796,5
756,65
794,5
0
387,5
683
762,25
742
731,5
643
573,44
574,751
440,025
350,75
562,75
642,251
411
646
558,525
647,15
591
797
642,25
726,275
652,75
678,75
602,25
689,775
393
580,525
462,25
725,65
501
675
691
769,025
688,25
518,8
386,275
491,35
269,5
379
375,25
337,5
296
375
399,525
336
483,5
370,25
625,5
736,75
496,05
740,5
690,525
568,75
341,1
519,75
408,75
278,35
217
266
319,025
454,75
378,3
509,575
453,75
252
187,525
401,5
403,75


Summary of computational transaction
Raw Inputview raw input (R code)
Raw Outputview raw output of R engine
Computing time4 seconds
R Serverwessa.org @ wessa.org

\begin{tabular}{lllllllll}
\hline
Summary of computational transaction \tabularnewline
Raw Input & view raw input (R code)  \tabularnewline
Raw Output & view raw output of R engine  \tabularnewline
Computing time & 4 seconds \tabularnewline
R Server & wessa.org @ wessa.org \tabularnewline
\hline
\end{tabular}
%Source: https://freestatistics.org/blog/index.php?pk=74818&T=0

[TABLE]
[ROW][C]Summary of computational transaction[/C][/ROW]
[ROW][C]Raw Input[/C][C]view raw input (R code) [/C][/ROW]
[ROW][C]Raw Output[/C][C]view raw output of R engine [/C][/ROW]
[ROW][C]Computing time[/C][C]4 seconds[/C][/ROW]
[ROW][C]R Server[/C][C]wessa.org @ wessa.org[/C][/ROW]
[/TABLE]
Source: https://freestatistics.org/blog/index.php?pk=74818&T=0

Globally Unique Identifier (entire table): ba.freestatistics.org/blog/index.php?pk=74818&T=0

As an alternative you can also use a QR Code:  

The GUIDs for individual cells are displayed in the table below:

Summary of computational transaction
Raw Inputview raw input (R code)
Raw Outputview raw output of R engine
Computing time4 seconds
R Serverwessa.org @ wessa.org


Demand Forecast
PointForecast95% LB80% LB80% UB95% UB
89395.436387955306119.354510449894214.916151294640575.956624615972671.518265460718
90395.436387955306117.977534937814214.015795401806576.856980508806672.895240972798
91395.436387955306116.607359429488213.119885792437577.752890118175674.265416481124
92395.436387955306115.243884166356212.228357237917578.644418672695675.628891744256
93395.436387955306113.887011805421211.341146089081579.531629821531676.985764105191
94395.436387955306112.536647338142210.458190223184580.414585687428678.33612857247
95395.436387955306111.192698012806209.57942899314581.293346917472679.680077897806
96395.436387955306109.855073260179208.704803178909582.167972731703681.017702650433
97395.436387955306108.523684622278207.834254940927583.038520969685682.349091288334
98395.436387955306107.198445684107206.967727775463583.905048135149683.674330226506

\begin{tabular}{lllllllll}
\hline
Demand Forecast \tabularnewline
Point & Forecast & 95% LB & 80% LB & 80% UB & 95% UB \tabularnewline
89 & 395.436387955306 & 119.354510449894 & 214.916151294640 & 575.956624615972 & 671.518265460718 \tabularnewline
90 & 395.436387955306 & 117.977534937814 & 214.015795401806 & 576.856980508806 & 672.895240972798 \tabularnewline
91 & 395.436387955306 & 116.607359429488 & 213.119885792437 & 577.752890118175 & 674.265416481124 \tabularnewline
92 & 395.436387955306 & 115.243884166356 & 212.228357237917 & 578.644418672695 & 675.628891744256 \tabularnewline
93 & 395.436387955306 & 113.887011805421 & 211.341146089081 & 579.531629821531 & 676.985764105191 \tabularnewline
94 & 395.436387955306 & 112.536647338142 & 210.458190223184 & 580.414585687428 & 678.33612857247 \tabularnewline
95 & 395.436387955306 & 111.192698012806 & 209.57942899314 & 581.293346917472 & 679.680077897806 \tabularnewline
96 & 395.436387955306 & 109.855073260179 & 208.704803178909 & 582.167972731703 & 681.017702650433 \tabularnewline
97 & 395.436387955306 & 108.523684622278 & 207.834254940927 & 583.038520969685 & 682.349091288334 \tabularnewline
98 & 395.436387955306 & 107.198445684107 & 206.967727775463 & 583.905048135149 & 683.674330226506 \tabularnewline
\hline
\end{tabular}
%Source: https://freestatistics.org/blog/index.php?pk=74818&T=1

[TABLE]
[ROW][C]Demand Forecast[/C][/ROW]
[ROW][C]Point[/C][C]Forecast[/C][C]95% LB[/C][C]80% LB[/C][C]80% UB[/C][C]95% UB[/C][/ROW]
[ROW][C]89[/C][C]395.436387955306[/C][C]119.354510449894[/C][C]214.916151294640[/C][C]575.956624615972[/C][C]671.518265460718[/C][/ROW]
[ROW][C]90[/C][C]395.436387955306[/C][C]117.977534937814[/C][C]214.015795401806[/C][C]576.856980508806[/C][C]672.895240972798[/C][/ROW]
[ROW][C]91[/C][C]395.436387955306[/C][C]116.607359429488[/C][C]213.119885792437[/C][C]577.752890118175[/C][C]674.265416481124[/C][/ROW]
[ROW][C]92[/C][C]395.436387955306[/C][C]115.243884166356[/C][C]212.228357237917[/C][C]578.644418672695[/C][C]675.628891744256[/C][/ROW]
[ROW][C]93[/C][C]395.436387955306[/C][C]113.887011805421[/C][C]211.341146089081[/C][C]579.531629821531[/C][C]676.985764105191[/C][/ROW]
[ROW][C]94[/C][C]395.436387955306[/C][C]112.536647338142[/C][C]210.458190223184[/C][C]580.414585687428[/C][C]678.33612857247[/C][/ROW]
[ROW][C]95[/C][C]395.436387955306[/C][C]111.192698012806[/C][C]209.57942899314[/C][C]581.293346917472[/C][C]679.680077897806[/C][/ROW]
[ROW][C]96[/C][C]395.436387955306[/C][C]109.855073260179[/C][C]208.704803178909[/C][C]582.167972731703[/C][C]681.017702650433[/C][/ROW]
[ROW][C]97[/C][C]395.436387955306[/C][C]108.523684622278[/C][C]207.834254940927[/C][C]583.038520969685[/C][C]682.349091288334[/C][/ROW]
[ROW][C]98[/C][C]395.436387955306[/C][C]107.198445684107[/C][C]206.967727775463[/C][C]583.905048135149[/C][C]683.674330226506[/C][/ROW]
[/TABLE]
Source: https://freestatistics.org/blog/index.php?pk=74818&T=1

Globally Unique Identifier (entire table): ba.freestatistics.org/blog/index.php?pk=74818&T=1

As an alternative you can also use a QR Code:  

The GUIDs for individual cells are displayed in the table below:

Demand Forecast
PointForecast95% LB80% LB80% UB95% UB
89395.436387955306119.354510449894214.916151294640575.956624615972671.518265460718
90395.436387955306117.977534937814214.015795401806576.856980508806672.895240972798
91395.436387955306116.607359429488213.119885792437577.752890118175674.265416481124
92395.436387955306115.243884166356212.228357237917578.644418672695675.628891744256
93395.436387955306113.887011805421211.341146089081579.531629821531676.985764105191
94395.436387955306112.536647338142210.458190223184580.414585687428678.33612857247
95395.436387955306111.192698012806209.57942899314581.293346917472679.680077897806
96395.436387955306109.855073260179208.704803178909582.167972731703681.017702650433
97395.436387955306108.523684622278207.834254940927583.038520969685682.349091288334
98395.436387955306107.198445684107206.967727775463583.905048135149683.674330226506


Actuals and Interpolation
TimeActualForecast
1567.5NA
2531.25567.5
3781.25563.875
4572.5585.6125
5591.5584.30125
6548.75585.021125
7744581.3940125
8634.25597.65461125
9634.25601.314150125
10313.25604.6077351125
11674.25575.47196160125
12769.55585.349765441125
13758.25603.769788897013
14488.775619.217810007311
15690.45606.17352900658
16559.5614.601176105922
17687.1609.09105849533
18796.5616.891952645797
19756.65634.852757381217
20794.5647.032481643096
210661.779233478786
22387.5661.779233478786
23683576.683009209916
24762.25586.436861575979
25742602.700796675333
26731.5615.684225077297
27643626.552720579657
28573.44628.105744039416
29574.751622.915025690482
30440.025618.318474728991
31350.75601.224947551411
32562.75577.111651298828
33642.251575.723874938594
34411582.17417034024
35646565.526920803258
36558.525573.374747497914
37647.15571.922984430509
38591579.293924860485
39797580.443235417777
40642.25601.743680483357
41726.275605.734413670788
42652.75617.627810153039
43678.75621.097841655595
44602.25626.800657851697
45689.775624.369533075915
46393630.852620565083
47580.525607.255583678534
48462.25604.601578361445
49725.65590.457804605759
50501603.898864734033
51675593.662549772689
52691601.75816341329
53769.025610.644676115314
54688.25626.42251283416
55518.8632.584104592815
56386.275621.240748681428
57491.35597.809343203964
58269.5587.189990774062
59379555.4924012927
60375.25537.878873576511
61337.5521.645608686526
62296503.261240838885
63375482.565706581923
64399.525471.823426158782
65336464.602229132008
66483.5451.755848532616
67370.25454.927188197459
68625.5446.466853526991
69736.75464.356115859601
70496.05491.576260582693
71740.5492.023350055455
72690.525516.856794384388
73568.75534.21466908752
74341.1537.666601035452
75519.75518.01814329439
76408.75518.191263921763
77278.35507.250836916728
78217484.367717136711
79266457.638266425667
80319.025438.479162568693
81454.75426.536395851922
82378.3429.357193044329
83509.575424.252391078067
84453.75432.783272262939
85252434.879639893912
86187.525416.594071351501
87401.5393.689864664596
88403.75394.470795332286

\begin{tabular}{lllllllll}
\hline
Actuals and Interpolation \tabularnewline
Time & Actual & Forecast \tabularnewline
1 & 567.5 & NA \tabularnewline
2 & 531.25 & 567.5 \tabularnewline
3 & 781.25 & 563.875 \tabularnewline
4 & 572.5 & 585.6125 \tabularnewline
5 & 591.5 & 584.30125 \tabularnewline
6 & 548.75 & 585.021125 \tabularnewline
7 & 744 & 581.3940125 \tabularnewline
8 & 634.25 & 597.65461125 \tabularnewline
9 & 634.25 & 601.314150125 \tabularnewline
10 & 313.25 & 604.6077351125 \tabularnewline
11 & 674.25 & 575.47196160125 \tabularnewline
12 & 769.55 & 585.349765441125 \tabularnewline
13 & 758.25 & 603.769788897013 \tabularnewline
14 & 488.775 & 619.217810007311 \tabularnewline
15 & 690.45 & 606.17352900658 \tabularnewline
16 & 559.5 & 614.601176105922 \tabularnewline
17 & 687.1 & 609.09105849533 \tabularnewline
18 & 796.5 & 616.891952645797 \tabularnewline
19 & 756.65 & 634.852757381217 \tabularnewline
20 & 794.5 & 647.032481643096 \tabularnewline
21 & 0 & 661.779233478786 \tabularnewline
22 & 387.5 & 661.779233478786 \tabularnewline
23 & 683 & 576.683009209916 \tabularnewline
24 & 762.25 & 586.436861575979 \tabularnewline
25 & 742 & 602.700796675333 \tabularnewline
26 & 731.5 & 615.684225077297 \tabularnewline
27 & 643 & 626.552720579657 \tabularnewline
28 & 573.44 & 628.105744039416 \tabularnewline
29 & 574.751 & 622.915025690482 \tabularnewline
30 & 440.025 & 618.318474728991 \tabularnewline
31 & 350.75 & 601.224947551411 \tabularnewline
32 & 562.75 & 577.111651298828 \tabularnewline
33 & 642.251 & 575.723874938594 \tabularnewline
34 & 411 & 582.17417034024 \tabularnewline
35 & 646 & 565.526920803258 \tabularnewline
36 & 558.525 & 573.374747497914 \tabularnewline
37 & 647.15 & 571.922984430509 \tabularnewline
38 & 591 & 579.293924860485 \tabularnewline
39 & 797 & 580.443235417777 \tabularnewline
40 & 642.25 & 601.743680483357 \tabularnewline
41 & 726.275 & 605.734413670788 \tabularnewline
42 & 652.75 & 617.627810153039 \tabularnewline
43 & 678.75 & 621.097841655595 \tabularnewline
44 & 602.25 & 626.800657851697 \tabularnewline
45 & 689.775 & 624.369533075915 \tabularnewline
46 & 393 & 630.852620565083 \tabularnewline
47 & 580.525 & 607.255583678534 \tabularnewline
48 & 462.25 & 604.601578361445 \tabularnewline
49 & 725.65 & 590.457804605759 \tabularnewline
50 & 501 & 603.898864734033 \tabularnewline
51 & 675 & 593.662549772689 \tabularnewline
52 & 691 & 601.75816341329 \tabularnewline
53 & 769.025 & 610.644676115314 \tabularnewline
54 & 688.25 & 626.42251283416 \tabularnewline
55 & 518.8 & 632.584104592815 \tabularnewline
56 & 386.275 & 621.240748681428 \tabularnewline
57 & 491.35 & 597.809343203964 \tabularnewline
58 & 269.5 & 587.189990774062 \tabularnewline
59 & 379 & 555.4924012927 \tabularnewline
60 & 375.25 & 537.878873576511 \tabularnewline
61 & 337.5 & 521.645608686526 \tabularnewline
62 & 296 & 503.261240838885 \tabularnewline
63 & 375 & 482.565706581923 \tabularnewline
64 & 399.525 & 471.823426158782 \tabularnewline
65 & 336 & 464.602229132008 \tabularnewline
66 & 483.5 & 451.755848532616 \tabularnewline
67 & 370.25 & 454.927188197459 \tabularnewline
68 & 625.5 & 446.466853526991 \tabularnewline
69 & 736.75 & 464.356115859601 \tabularnewline
70 & 496.05 & 491.576260582693 \tabularnewline
71 & 740.5 & 492.023350055455 \tabularnewline
72 & 690.525 & 516.856794384388 \tabularnewline
73 & 568.75 & 534.21466908752 \tabularnewline
74 & 341.1 & 537.666601035452 \tabularnewline
75 & 519.75 & 518.01814329439 \tabularnewline
76 & 408.75 & 518.191263921763 \tabularnewline
77 & 278.35 & 507.250836916728 \tabularnewline
78 & 217 & 484.367717136711 \tabularnewline
79 & 266 & 457.638266425667 \tabularnewline
80 & 319.025 & 438.479162568693 \tabularnewline
81 & 454.75 & 426.536395851922 \tabularnewline
82 & 378.3 & 429.357193044329 \tabularnewline
83 & 509.575 & 424.252391078067 \tabularnewline
84 & 453.75 & 432.783272262939 \tabularnewline
85 & 252 & 434.879639893912 \tabularnewline
86 & 187.525 & 416.594071351501 \tabularnewline
87 & 401.5 & 393.689864664596 \tabularnewline
88 & 403.75 & 394.470795332286 \tabularnewline
\hline
\end{tabular}
%Source: https://freestatistics.org/blog/index.php?pk=74818&T=2

[TABLE]
[ROW][C]Actuals and Interpolation[/C][/ROW]
[ROW][C]Time[/C][C]Actual[/C][C]Forecast[/C][/ROW]
[ROW][C]1[/C][C]567.5[/C][C]NA[/C][/ROW]
[ROW][C]2[/C][C]531.25[/C][C]567.5[/C][/ROW]
[ROW][C]3[/C][C]781.25[/C][C]563.875[/C][/ROW]
[ROW][C]4[/C][C]572.5[/C][C]585.6125[/C][/ROW]
[ROW][C]5[/C][C]591.5[/C][C]584.30125[/C][/ROW]
[ROW][C]6[/C][C]548.75[/C][C]585.021125[/C][/ROW]
[ROW][C]7[/C][C]744[/C][C]581.3940125[/C][/ROW]
[ROW][C]8[/C][C]634.25[/C][C]597.65461125[/C][/ROW]
[ROW][C]9[/C][C]634.25[/C][C]601.314150125[/C][/ROW]
[ROW][C]10[/C][C]313.25[/C][C]604.6077351125[/C][/ROW]
[ROW][C]11[/C][C]674.25[/C][C]575.47196160125[/C][/ROW]
[ROW][C]12[/C][C]769.55[/C][C]585.349765441125[/C][/ROW]
[ROW][C]13[/C][C]758.25[/C][C]603.769788897013[/C][/ROW]
[ROW][C]14[/C][C]488.775[/C][C]619.217810007311[/C][/ROW]
[ROW][C]15[/C][C]690.45[/C][C]606.17352900658[/C][/ROW]
[ROW][C]16[/C][C]559.5[/C][C]614.601176105922[/C][/ROW]
[ROW][C]17[/C][C]687.1[/C][C]609.09105849533[/C][/ROW]
[ROW][C]18[/C][C]796.5[/C][C]616.891952645797[/C][/ROW]
[ROW][C]19[/C][C]756.65[/C][C]634.852757381217[/C][/ROW]
[ROW][C]20[/C][C]794.5[/C][C]647.032481643096[/C][/ROW]
[ROW][C]21[/C][C]0[/C][C]661.779233478786[/C][/ROW]
[ROW][C]22[/C][C]387.5[/C][C]661.779233478786[/C][/ROW]
[ROW][C]23[/C][C]683[/C][C]576.683009209916[/C][/ROW]
[ROW][C]24[/C][C]762.25[/C][C]586.436861575979[/C][/ROW]
[ROW][C]25[/C][C]742[/C][C]602.700796675333[/C][/ROW]
[ROW][C]26[/C][C]731.5[/C][C]615.684225077297[/C][/ROW]
[ROW][C]27[/C][C]643[/C][C]626.552720579657[/C][/ROW]
[ROW][C]28[/C][C]573.44[/C][C]628.105744039416[/C][/ROW]
[ROW][C]29[/C][C]574.751[/C][C]622.915025690482[/C][/ROW]
[ROW][C]30[/C][C]440.025[/C][C]618.318474728991[/C][/ROW]
[ROW][C]31[/C][C]350.75[/C][C]601.224947551411[/C][/ROW]
[ROW][C]32[/C][C]562.75[/C][C]577.111651298828[/C][/ROW]
[ROW][C]33[/C][C]642.251[/C][C]575.723874938594[/C][/ROW]
[ROW][C]34[/C][C]411[/C][C]582.17417034024[/C][/ROW]
[ROW][C]35[/C][C]646[/C][C]565.526920803258[/C][/ROW]
[ROW][C]36[/C][C]558.525[/C][C]573.374747497914[/C][/ROW]
[ROW][C]37[/C][C]647.15[/C][C]571.922984430509[/C][/ROW]
[ROW][C]38[/C][C]591[/C][C]579.293924860485[/C][/ROW]
[ROW][C]39[/C][C]797[/C][C]580.443235417777[/C][/ROW]
[ROW][C]40[/C][C]642.25[/C][C]601.743680483357[/C][/ROW]
[ROW][C]41[/C][C]726.275[/C][C]605.734413670788[/C][/ROW]
[ROW][C]42[/C][C]652.75[/C][C]617.627810153039[/C][/ROW]
[ROW][C]43[/C][C]678.75[/C][C]621.097841655595[/C][/ROW]
[ROW][C]44[/C][C]602.25[/C][C]626.800657851697[/C][/ROW]
[ROW][C]45[/C][C]689.775[/C][C]624.369533075915[/C][/ROW]
[ROW][C]46[/C][C]393[/C][C]630.852620565083[/C][/ROW]
[ROW][C]47[/C][C]580.525[/C][C]607.255583678534[/C][/ROW]
[ROW][C]48[/C][C]462.25[/C][C]604.601578361445[/C][/ROW]
[ROW][C]49[/C][C]725.65[/C][C]590.457804605759[/C][/ROW]
[ROW][C]50[/C][C]501[/C][C]603.898864734033[/C][/ROW]
[ROW][C]51[/C][C]675[/C][C]593.662549772689[/C][/ROW]
[ROW][C]52[/C][C]691[/C][C]601.75816341329[/C][/ROW]
[ROW][C]53[/C][C]769.025[/C][C]610.644676115314[/C][/ROW]
[ROW][C]54[/C][C]688.25[/C][C]626.42251283416[/C][/ROW]
[ROW][C]55[/C][C]518.8[/C][C]632.584104592815[/C][/ROW]
[ROW][C]56[/C][C]386.275[/C][C]621.240748681428[/C][/ROW]
[ROW][C]57[/C][C]491.35[/C][C]597.809343203964[/C][/ROW]
[ROW][C]58[/C][C]269.5[/C][C]587.189990774062[/C][/ROW]
[ROW][C]59[/C][C]379[/C][C]555.4924012927[/C][/ROW]
[ROW][C]60[/C][C]375.25[/C][C]537.878873576511[/C][/ROW]
[ROW][C]61[/C][C]337.5[/C][C]521.645608686526[/C][/ROW]
[ROW][C]62[/C][C]296[/C][C]503.261240838885[/C][/ROW]
[ROW][C]63[/C][C]375[/C][C]482.565706581923[/C][/ROW]
[ROW][C]64[/C][C]399.525[/C][C]471.823426158782[/C][/ROW]
[ROW][C]65[/C][C]336[/C][C]464.602229132008[/C][/ROW]
[ROW][C]66[/C][C]483.5[/C][C]451.755848532616[/C][/ROW]
[ROW][C]67[/C][C]370.25[/C][C]454.927188197459[/C][/ROW]
[ROW][C]68[/C][C]625.5[/C][C]446.466853526991[/C][/ROW]
[ROW][C]69[/C][C]736.75[/C][C]464.356115859601[/C][/ROW]
[ROW][C]70[/C][C]496.05[/C][C]491.576260582693[/C][/ROW]
[ROW][C]71[/C][C]740.5[/C][C]492.023350055455[/C][/ROW]
[ROW][C]72[/C][C]690.525[/C][C]516.856794384388[/C][/ROW]
[ROW][C]73[/C][C]568.75[/C][C]534.21466908752[/C][/ROW]
[ROW][C]74[/C][C]341.1[/C][C]537.666601035452[/C][/ROW]
[ROW][C]75[/C][C]519.75[/C][C]518.01814329439[/C][/ROW]
[ROW][C]76[/C][C]408.75[/C][C]518.191263921763[/C][/ROW]
[ROW][C]77[/C][C]278.35[/C][C]507.250836916728[/C][/ROW]
[ROW][C]78[/C][C]217[/C][C]484.367717136711[/C][/ROW]
[ROW][C]79[/C][C]266[/C][C]457.638266425667[/C][/ROW]
[ROW][C]80[/C][C]319.025[/C][C]438.479162568693[/C][/ROW]
[ROW][C]81[/C][C]454.75[/C][C]426.536395851922[/C][/ROW]
[ROW][C]82[/C][C]378.3[/C][C]429.357193044329[/C][/ROW]
[ROW][C]83[/C][C]509.575[/C][C]424.252391078067[/C][/ROW]
[ROW][C]84[/C][C]453.75[/C][C]432.783272262939[/C][/ROW]
[ROW][C]85[/C][C]252[/C][C]434.879639893912[/C][/ROW]
[ROW][C]86[/C][C]187.525[/C][C]416.594071351501[/C][/ROW]
[ROW][C]87[/C][C]401.5[/C][C]393.689864664596[/C][/ROW]
[ROW][C]88[/C][C]403.75[/C][C]394.470795332286[/C][/ROW]
[/TABLE]
Source: https://freestatistics.org/blog/index.php?pk=74818&T=2

Globally Unique Identifier (entire table): ba.freestatistics.org/blog/index.php?pk=74818&T=2

As an alternative you can also use a QR Code:  

The GUIDs for individual cells are displayed in the table below:

Actuals and Interpolation
TimeActualForecast
1567.5NA
2531.25567.5
3781.25563.875
4572.5585.6125
5591.5584.30125
6548.75585.021125
7744581.3940125
8634.25597.65461125
9634.25601.314150125
10313.25604.6077351125
11674.25575.47196160125
12769.55585.349765441125
13758.25603.769788897013
14488.775619.217810007311
15690.45606.17352900658
16559.5614.601176105922
17687.1609.09105849533
18796.5616.891952645797
19756.65634.852757381217
20794.5647.032481643096
210661.779233478786
22387.5661.779233478786
23683576.683009209916
24762.25586.436861575979
25742602.700796675333
26731.5615.684225077297
27643626.552720579657
28573.44628.105744039416
29574.751622.915025690482
30440.025618.318474728991
31350.75601.224947551411
32562.75577.111651298828
33642.251575.723874938594
34411582.17417034024
35646565.526920803258
36558.525573.374747497914
37647.15571.922984430509
38591579.293924860485
39797580.443235417777
40642.25601.743680483357
41726.275605.734413670788
42652.75617.627810153039
43678.75621.097841655595
44602.25626.800657851697
45689.775624.369533075915
46393630.852620565083
47580.525607.255583678534
48462.25604.601578361445
49725.65590.457804605759
50501603.898864734033
51675593.662549772689
52691601.75816341329
53769.025610.644676115314
54688.25626.42251283416
55518.8632.584104592815
56386.275621.240748681428
57491.35597.809343203964
58269.5587.189990774062
59379555.4924012927
60375.25537.878873576511
61337.5521.645608686526
62296503.261240838885
63375482.565706581923
64399.525471.823426158782
65336464.602229132008
66483.5451.755848532616
67370.25454.927188197459
68625.5446.466853526991
69736.75464.356115859601
70496.05491.576260582693
71740.5492.023350055455
72690.525516.856794384388
73568.75534.21466908752
74341.1537.666601035452
75519.75518.01814329439
76408.75518.191263921763
77278.35507.250836916728
78217484.367717136711
79266457.638266425667
80319.025438.479162568693
81454.75426.536395851922
82378.3429.357193044329
83509.575424.252391078067
84453.75432.783272262939
85252434.879639893912
86187.525416.594071351501
87401.5393.689864664596
88403.75394.470795332286


\begin{tabular}{lllllllll}
\hline
What is next? \tabularnewline
Simulate Time Series \tabularnewline
Generate Forecasts \tabularnewline
Forecast Analysis \tabularnewline
\hline
\end{tabular}
%Source: https://freestatistics.org/blog/index.php?pk=74818&T=3

[TABLE]
[ROW][C]What is next?[/C][/ROW]
[ROW][C]Simulate Time Series[/C][/ROW]
[ROW][C]Generate Forecasts[/C][/ROW]
[ROW][C]Forecast Analysis[/C][/ROW]
[/TABLE]
Source: https://freestatistics.org/blog/index.php?pk=74818&T=3

Globally Unique Identifier (entire table): ba.freestatistics.org/blog/index.php?pk=74818&T=3

As an alternative you can also use a QR Code:  

The GUIDs for individual cells are displayed in the table below:

What is next?
Simulate Time Series
Generate Forecasts
Forecast Analysis


Parameters (Session):
par1 = Input box ; par2 = Croston ; par3 = NA ; par4 = NA ; par5 = ZZZ ; par6 = 12 ; par7 = dum ; par8 = B58Acrostonm ; par9 = 3 ; par10 = 0.1 ;
Parameters (R input):
par1 = Input box ; par2 = Croston ; par3 = NA ; par4 = NA ; par5 = ZZZ ; par6 = 12 ; par7 = dum ; par8 = B58Acrostonm ; par9 = 3 ; par10 = 0.1 ;
R code (references can be found in the software module):
if(par3!='NA') par3 <- as.numeric(par3) else par3 <- NA
if(par4!='NA') par4 <- as.numeric(par4) else par4 <- NA
par6 <- as.numeric(par6) #Seasonal Period
par9 <- as.numeric(par9) #Forecast Horizon
par10 <- as.numeric(par10) #Alpha
library(forecast)
if (par1 == 'CSV') {
xarr <- read.csv(file=paste('tmp/',par7,'.csv',sep=''),header=T)
numseries <- length(xarr[1,])-1
n <- length(xarr[,1])
nmh <- n - par9
nmhp1 <- nmh + 1
rarr <- array(NA,dim=c(n,numseries))
farr <- array(NA,dim=c(n,numseries))
parr <- array(NA,dim=c(numseries,8))
colnames(parr) = list('ME','RMSE','MAE','MPE','MAPE','MASE','ACF1','TheilU')
for(i in 1:numseries) {
sindex <- i+1
x <- xarr[,sindex]
if(par2=='Croston') {
if (i==1) m <- croston(x,alpha=par10)
if (i==1) mydemand <- m$model$demand[]
fit <- croston(x[1:nmh],h=par9,alpha=par10)
}
if(par2=='ARIMA') {
m <- auto.arima(ts(x,freq=par6),d=par3,D=par4)
mydemand <- forecast(m)
fit <- auto.arima(ts(x[1:nmh],freq=par6),d=par3,D=par4)
}
if(par2=='ETS') {
m <- ets(ts(x,freq=par6),model=par5)
mydemand <- forecast(m)
fit <- ets(ts(x[1:nmh],freq=par6),model=par5)
}
try(rarr[,i] <- mydemand$resid,silent=T)
try(farr[,i] <- mydemand$mean,silent=T)
if (par2!='Croston') parr[i,] <- accuracy(forecast(fit,par9),x[nmhp1:n])
if (par2=='Croston') parr[i,] <- accuracy(fit,x[nmhp1:n])
}
write.csv(farr,file=paste('tmp/',par8,'_f.csv',sep=''))
write.csv(rarr,file=paste('tmp/',par8,'_r.csv',sep=''))
write.csv(parr,file=paste('tmp/',par8,'_p.csv',sep=''))
}
if (par1 == 'Input box') {
numseries <- 1
n <- length(x)
if(par2=='Croston') {
m <- croston(x)
mydemand <- m$model$demand[]
}
if(par2=='ARIMA') {
m <- auto.arima(ts(x,freq=par6),d=par3,D=par4)
mydemand <- forecast(m)
}
if(par2=='ETS') {
m <- ets(ts(x,freq=par6),model=par5)
mydemand <- forecast(m)
}
summary(m)
}
bitmap(file='test1.png')
op <- par(mfrow=c(2,1))
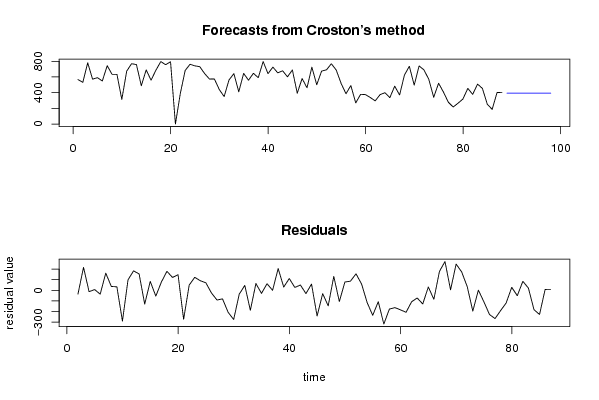
if (par2=='Croston') plot(m)
if ((par2=='ARIMA') | par2=='ETS') plot(forecast(m))
plot(mydemand$resid,type='l',main='Residuals', ylab='residual value', xlab='time')
par(op)
dev.off()
bitmap(file='pic2.png')
op <- par(mfrow=c(2,2))
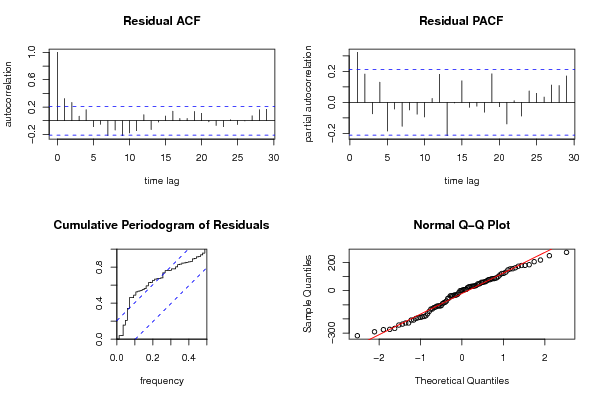
acf(mydemand$resid, lag.max=n/3, main='Residual ACF', ylab='autocorrelation', xlab='time lag')
pacf(mydemand$resid,lag.max=n/3, main='Residual PACF', ylab='partial autocorrelation', xlab='time lag')
cpgram(mydemand$resid, main='Cumulative Periodogram of Residuals')
qqnorm(mydemand$resid); qqline(mydemand$resid, col=2)
par(op)
dev.off()
load(file='createtable')
a<-table.start()
a<-table.row.start(a)
a<-table.element(a,'Demand Forecast',6,TRUE)
a<-table.row.end(a)
a<-table.row.start(a)
a<-table.element(a,'Point',header=TRUE)
a<-table.element(a,'Forecast',header=TRUE)
a<-table.element(a,'95% LB',header=TRUE)
a<-table.element(a,'80% LB',header=TRUE)
a<-table.element(a,'80% UB',header=TRUE)
a<-table.element(a,'95% UB',header=TRUE)
a<-table.row.end(a)
for (i in 1:length(mydemand$mean)) {
a<-table.row.start(a)
a<-table.element(a,i+n,header=TRUE)
a<-table.element(a,as.numeric(mydemand$mean[i]))
a<-table.element(a,as.numeric(mydemand$lower[i,2]))
a<-table.element(a,as.numeric(mydemand$lower[i,1]))
a<-table.element(a,as.numeric(mydemand$upper[i,1]))
a<-table.element(a,as.numeric(mydemand$upper[i,2]))
a<-table.row.end(a)
}
a<-table.end(a)
table.save(a,file='mytable.tab')
a<-table.start()
a<-table.row.start(a)
a<-table.element(a,'Actuals and Interpolation',3,TRUE)
a<-table.row.end(a)
a<-table.row.start(a)
a<-table.element(a,'Time',header=TRUE)
a<-table.element(a,'Actual',header=TRUE)
a<-table.element(a,'Forecast',header=TRUE)
a<-table.row.end(a)
for (i in 1:n) {
a<-table.row.start(a)
a<-table.element(a,i,header=TRUE)
a<-table.element(a,x[i])
a<-table.element(a,x[i] - as.numeric(m$resid[i]))
a<-table.row.end(a)
}
a<-table.end(a)
table.save(a,file='mytable1.tab')
a<-table.start()
a<-table.row.start(a)
a<-table.element(a,'What is next?',1,TRUE)
a<-table.row.end(a)
a<-table.row.start(a)
a<-table.element(a,hyperlink(paste('https://automated.biganalytics.eu/Patrick.Wessa/rwasp_demand_forecasting_simulate.wasp',sep=''),'Simulate Time Series','',target=''))
a<-table.row.end(a)
a<-table.row.start(a)
a<-table.element(a,hyperlink(paste('https://automated.biganalytics.eu/Patrick.Wessa/rwasp_demand_forecasting_croston.wasp',sep=''),'Generate Forecasts','',target=''))
a<-table.row.end(a)
a<-table.row.start(a)
a<-table.element(a,hyperlink(paste('https://automated.biganalytics.eu/Patrick.Wessa/rwasp_demand_forecasting_analysis.wasp',sep=''),'Forecast Analysis','',target=''))
a<-table.row.end(a)
a<-table.end(a)
table.save(a,file='mytable0.tab')
-SERVER-wessa.org