Free Statistics

of Irreproducible Research!

Author's title

Author*Unverified author*
R Software ModulePatrick.Wessarwasp_demand_forecasting_croston.wasp
Title produced by softwareCroston Forecasting
Date of computationMon, 26 Apr 2010 13:34:45 +0000
Cite this page as followsStatistical Computations at FreeStatistics.org, Office for Research Development and Education, URL https://freestatistics.org/blog/index.php?v=date/2010/Apr/26/t1272289155j2refhgteje134u.htm/, Retrieved Fri, 26 Apr 2024 14:15:47 +0000
Statistical Computations at FreeStatistics.org, Office for Research Development and Education, URL https://freestatistics.org/blog/index.php?pk=74816, Retrieved Fri, 26 Apr 2024 14:15:47 +0000
QR Codes:

Original text written by user:
IsPrivate?No (this computation is public)
User-defined keywordsb521,steven,coomans,thesis,forecast,croston,permaand
Estimated Impact182
Family? (F = Feedback message, R = changed R code, M = changed R Module, P = changed Parameters, D = changed Data)
-       [Croston Forecasting] [b521,steven,cooma...] [2010-04-26 13:34:45] [d41d8cd98f00b204e9800998ecf8427e] [Current]
Feedback Forum

Post a new message
Dataseries X:
268,5
247
250,25
196,5
200,85
192,75
161
270,55
270,55
308
286,2
301,95
364,825
279
261,246
306
268,075
402,05
225,525
359,25
0
250
400,3
432,5
347,2
422,5
330,5
339,175
205,8
377,535
320
356,55
314,9
282,125
440,5
378,1
391,85
292,775
387
295,5
343,35
264,025
322,5
392,5
315,75
274,4
361,875
411,276
518,775
392,55
467
382,852
449,25
564,252
417
450,8
538,675
394
532
461,4
523
405,9
386,25
384,5
382
381,75
151,5
287,775
247,6
290,35
266,55
318,025
213,3
148,75
273
282,25
191,25
142,25
259,25
272,75
173,75
204,75
185,525
267,175
190,25
127,25
183,5
254,125


Summary of computational transaction
Raw Inputview raw input (R code)
Raw Outputview raw output of R engine
Computing time4 seconds
R Serverwessa.org @ wessa.org

\begin{tabular}{lllllllll}
\hline
Summary of computational transaction \tabularnewline
Raw Input & view raw input (R code)  \tabularnewline
Raw Output & view raw output of R engine  \tabularnewline
Computing time & 4 seconds \tabularnewline
R Server & wessa.org @ wessa.org \tabularnewline
\hline
\end{tabular}
%Source: https://freestatistics.org/blog/index.php?pk=74816&T=0

[TABLE]
[ROW][C]Summary of computational transaction[/C][/ROW]
[ROW][C]Raw Input[/C][C]view raw input (R code) [/C][/ROW]
[ROW][C]Raw Output[/C][C]view raw output of R engine [/C][/ROW]
[ROW][C]Computing time[/C][C]4 seconds[/C][/ROW]
[ROW][C]R Server[/C][C]wessa.org @ wessa.org[/C][/ROW]
[/TABLE]
Source: https://freestatistics.org/blog/index.php?pk=74816&T=0

Globally Unique Identifier (entire table): ba.freestatistics.org/blog/index.php?pk=74816&T=0

As an alternative you can also use a QR Code:  

The GUIDs for individual cells are displayed in the table below:

Summary of computational transaction
Raw Inputview raw input (R code)
Raw Outputview raw output of R engine
Computing time4 seconds
R Serverwessa.org @ wessa.org


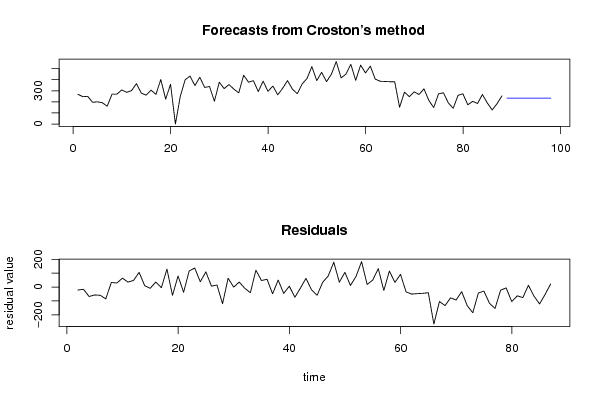
Demand Forecast
PointForecast95% LB80% LB80% UB95% UB
89233.64647856527672.38478195186128.203122775348339.089834355203394.908175178691
90233.64647856527671.5804792236997127.677217489039339.615739641513395.712477906851
91233.64647856527670.7801484336917127.153909313491340.13904781706396.512808696859
92233.64647856527669.9837313120402126.633160148134340.659796982417397.309225818511
93233.64647856527669.1911709998984126.114932814966341.178024315585398.101786130653
94233.64647856527668.4024120019972125.599191027581341.693766102970398.890545128554
95233.64647856527667.6174001412973125.085899361516342.207057769035399.675556989254
96233.64647856527666.8360825155632124.575023225860342.717933904691400.456874614988
97233.64647856527666.0584074557594124.066528836046343.226428294505401.234549674792
98233.64647856527665.2843244861754123.560383187780343.732573942771402.008632644376

\begin{tabular}{lllllllll}
\hline
Demand Forecast \tabularnewline
Point & Forecast & 95% LB & 80% LB & 80% UB & 95% UB \tabularnewline
89 & 233.646478565276 & 72.38478195186 & 128.203122775348 & 339.089834355203 & 394.908175178691 \tabularnewline
90 & 233.646478565276 & 71.5804792236997 & 127.677217489039 & 339.615739641513 & 395.712477906851 \tabularnewline
91 & 233.646478565276 & 70.7801484336917 & 127.153909313491 & 340.13904781706 & 396.512808696859 \tabularnewline
92 & 233.646478565276 & 69.9837313120402 & 126.633160148134 & 340.659796982417 & 397.309225818511 \tabularnewline
93 & 233.646478565276 & 69.1911709998984 & 126.114932814966 & 341.178024315585 & 398.101786130653 \tabularnewline
94 & 233.646478565276 & 68.4024120019972 & 125.599191027581 & 341.693766102970 & 398.890545128554 \tabularnewline
95 & 233.646478565276 & 67.6174001412973 & 125.085899361516 & 342.207057769035 & 399.675556989254 \tabularnewline
96 & 233.646478565276 & 66.8360825155632 & 124.575023225860 & 342.717933904691 & 400.456874614988 \tabularnewline
97 & 233.646478565276 & 66.0584074557594 & 124.066528836046 & 343.226428294505 & 401.234549674792 \tabularnewline
98 & 233.646478565276 & 65.2843244861754 & 123.560383187780 & 343.732573942771 & 402.008632644376 \tabularnewline
\hline
\end{tabular}
%Source: https://freestatistics.org/blog/index.php?pk=74816&T=1

[TABLE]
[ROW][C]Demand Forecast[/C][/ROW]
[ROW][C]Point[/C][C]Forecast[/C][C]95% LB[/C][C]80% LB[/C][C]80% UB[/C][C]95% UB[/C][/ROW]
[ROW][C]89[/C][C]233.646478565276[/C][C]72.38478195186[/C][C]128.203122775348[/C][C]339.089834355203[/C][C]394.908175178691[/C][/ROW]
[ROW][C]90[/C][C]233.646478565276[/C][C]71.5804792236997[/C][C]127.677217489039[/C][C]339.615739641513[/C][C]395.712477906851[/C][/ROW]
[ROW][C]91[/C][C]233.646478565276[/C][C]70.7801484336917[/C][C]127.153909313491[/C][C]340.13904781706[/C][C]396.512808696859[/C][/ROW]
[ROW][C]92[/C][C]233.646478565276[/C][C]69.9837313120402[/C][C]126.633160148134[/C][C]340.659796982417[/C][C]397.309225818511[/C][/ROW]
[ROW][C]93[/C][C]233.646478565276[/C][C]69.1911709998984[/C][C]126.114932814966[/C][C]341.178024315585[/C][C]398.101786130653[/C][/ROW]
[ROW][C]94[/C][C]233.646478565276[/C][C]68.4024120019972[/C][C]125.599191027581[/C][C]341.693766102970[/C][C]398.890545128554[/C][/ROW]
[ROW][C]95[/C][C]233.646478565276[/C][C]67.6174001412973[/C][C]125.085899361516[/C][C]342.207057769035[/C][C]399.675556989254[/C][/ROW]
[ROW][C]96[/C][C]233.646478565276[/C][C]66.8360825155632[/C][C]124.575023225860[/C][C]342.717933904691[/C][C]400.456874614988[/C][/ROW]
[ROW][C]97[/C][C]233.646478565276[/C][C]66.0584074557594[/C][C]124.066528836046[/C][C]343.226428294505[/C][C]401.234549674792[/C][/ROW]
[ROW][C]98[/C][C]233.646478565276[/C][C]65.2843244861754[/C][C]123.560383187780[/C][C]343.732573942771[/C][C]402.008632644376[/C][/ROW]
[/TABLE]
Source: https://freestatistics.org/blog/index.php?pk=74816&T=1

Globally Unique Identifier (entire table): ba.freestatistics.org/blog/index.php?pk=74816&T=1

As an alternative you can also use a QR Code:  

The GUIDs for individual cells are displayed in the table below:

Demand Forecast
PointForecast95% LB80% LB80% UB95% UB
89233.64647856527672.38478195186128.203122775348339.089834355203394.908175178691
90233.64647856527671.5804792236997127.677217489039339.615739641513395.712477906851
91233.64647856527670.7801484336917127.153909313491340.13904781706396.512808696859
92233.64647856527669.9837313120402126.633160148134340.659796982417397.309225818511
93233.64647856527669.1911709998984126.114932814966341.178024315585398.101786130653
94233.64647856527668.4024120019972125.599191027581341.693766102970398.890545128554
95233.64647856527667.6174001412973125.085899361516342.207057769035399.675556989254
96233.64647856527666.8360825155632124.575023225860342.717933904691400.456874614988
97233.64647856527666.0584074557594124.066528836046343.226428294505401.234549674792
98233.64647856527665.2843244861754123.560383187780343.732573942771402.008632644376


Actuals and Interpolation
TimeActualForecast
1268.5NA
2247268.5
3250.25266.35
4196.5264.74
5200.85257.916
6192.75252.2094
7161246.26346
8270.55237.737114
9270.55241.0184026
10308243.97156234
11286.2250.374406106
12301.95253.9569654954
13364.825258.75626894586
14279269.363142051274
15261.246270.326827846147
16306269.418745061532
17268.075273.076870555379
18402.05272.576683499841
19225.525285.524015149857
20359.25279.524113634871
210287.496702271384
22250287.496702271384
23400.3257.951847312951
24432.5271.011310862221
25347.2285.950135019278
26422.5291.658948979639
27330.5303.937460913683
28339.175306.445611064084
29205.8309.553389851043
30377.535299.651648104153
31320307.118557335331
32356.55308.358657577572
33314.9313.015420535409
34282.125313.198144412974
35440.5310.176179195247
36378.1322.885507209908
37391.85328.283468449948
38292.775334.511884051027
39387330.414127894790
40295.5335.979893815749
41343.35331.991764121373
42264.025333.112448919392
43322.5326.286689329056
44392.5325.912118907836
45315.75332.505972663929
46274.4330.845095647755
47361.875325.245254027762
48411.276328.882119639941
49518.775337.06861406508
50392.55355.134201741354
51467358.856302043389
52382.852369.619973560947
53449.25370.937590673297
54564.252378.739067378925
55417397.226879340228
56450.8399.198099713454
57538.675404.343977594834
58394417.74353865033
59532415.374521801108
60461.4427.013471000191
61523430.445860474613
62405.9439.686098995604
63386.25436.31247560928
64384.5431.312878909174
65382426.637188995105
66381.75422.17827469332
67151.5418.139364053424
68287.775391.498679540467
69247.6381.134452859780
70290.35367.790441323571
71266.55360.051321349813
72318.025350.706540425969
73213.3347.44006984888
74148.75334.032281929239
75273315.511785224931
76282.25311.262203313761
77191.25308.361963667074
78142.25296.6543302291
79259.25281.218125070793
80272.75279.021853952167
81173.75278.394807669126
82204.75267.932415905076
83185.525261.615309505095
84267.175254.007508971218
85190.25255.324066438843
86127.25248.817512166912
87183.5236.662194084659
88254.125231.346538729213

\begin{tabular}{lllllllll}
\hline
Actuals and Interpolation \tabularnewline
Time & Actual & Forecast \tabularnewline
1 & 268.5 & NA \tabularnewline
2 & 247 & 268.5 \tabularnewline
3 & 250.25 & 266.35 \tabularnewline
4 & 196.5 & 264.74 \tabularnewline
5 & 200.85 & 257.916 \tabularnewline
6 & 192.75 & 252.2094 \tabularnewline
7 & 161 & 246.26346 \tabularnewline
8 & 270.55 & 237.737114 \tabularnewline
9 & 270.55 & 241.0184026 \tabularnewline
10 & 308 & 243.97156234 \tabularnewline
11 & 286.2 & 250.374406106 \tabularnewline
12 & 301.95 & 253.9569654954 \tabularnewline
13 & 364.825 & 258.75626894586 \tabularnewline
14 & 279 & 269.363142051274 \tabularnewline
15 & 261.246 & 270.326827846147 \tabularnewline
16 & 306 & 269.418745061532 \tabularnewline
17 & 268.075 & 273.076870555379 \tabularnewline
18 & 402.05 & 272.576683499841 \tabularnewline
19 & 225.525 & 285.524015149857 \tabularnewline
20 & 359.25 & 279.524113634871 \tabularnewline
21 & 0 & 287.496702271384 \tabularnewline
22 & 250 & 287.496702271384 \tabularnewline
23 & 400.3 & 257.951847312951 \tabularnewline
24 & 432.5 & 271.011310862221 \tabularnewline
25 & 347.2 & 285.950135019278 \tabularnewline
26 & 422.5 & 291.658948979639 \tabularnewline
27 & 330.5 & 303.937460913683 \tabularnewline
28 & 339.175 & 306.445611064084 \tabularnewline
29 & 205.8 & 309.553389851043 \tabularnewline
30 & 377.535 & 299.651648104153 \tabularnewline
31 & 320 & 307.118557335331 \tabularnewline
32 & 356.55 & 308.358657577572 \tabularnewline
33 & 314.9 & 313.015420535409 \tabularnewline
34 & 282.125 & 313.198144412974 \tabularnewline
35 & 440.5 & 310.176179195247 \tabularnewline
36 & 378.1 & 322.885507209908 \tabularnewline
37 & 391.85 & 328.283468449948 \tabularnewline
38 & 292.775 & 334.511884051027 \tabularnewline
39 & 387 & 330.414127894790 \tabularnewline
40 & 295.5 & 335.979893815749 \tabularnewline
41 & 343.35 & 331.991764121373 \tabularnewline
42 & 264.025 & 333.112448919392 \tabularnewline
43 & 322.5 & 326.286689329056 \tabularnewline
44 & 392.5 & 325.912118907836 \tabularnewline
45 & 315.75 & 332.505972663929 \tabularnewline
46 & 274.4 & 330.845095647755 \tabularnewline
47 & 361.875 & 325.245254027762 \tabularnewline
48 & 411.276 & 328.882119639941 \tabularnewline
49 & 518.775 & 337.06861406508 \tabularnewline
50 & 392.55 & 355.134201741354 \tabularnewline
51 & 467 & 358.856302043389 \tabularnewline
52 & 382.852 & 369.619973560947 \tabularnewline
53 & 449.25 & 370.937590673297 \tabularnewline
54 & 564.252 & 378.739067378925 \tabularnewline
55 & 417 & 397.226879340228 \tabularnewline
56 & 450.8 & 399.198099713454 \tabularnewline
57 & 538.675 & 404.343977594834 \tabularnewline
58 & 394 & 417.74353865033 \tabularnewline
59 & 532 & 415.374521801108 \tabularnewline
60 & 461.4 & 427.013471000191 \tabularnewline
61 & 523 & 430.445860474613 \tabularnewline
62 & 405.9 & 439.686098995604 \tabularnewline
63 & 386.25 & 436.31247560928 \tabularnewline
64 & 384.5 & 431.312878909174 \tabularnewline
65 & 382 & 426.637188995105 \tabularnewline
66 & 381.75 & 422.17827469332 \tabularnewline
67 & 151.5 & 418.139364053424 \tabularnewline
68 & 287.775 & 391.498679540467 \tabularnewline
69 & 247.6 & 381.134452859780 \tabularnewline
70 & 290.35 & 367.790441323571 \tabularnewline
71 & 266.55 & 360.051321349813 \tabularnewline
72 & 318.025 & 350.706540425969 \tabularnewline
73 & 213.3 & 347.44006984888 \tabularnewline
74 & 148.75 & 334.032281929239 \tabularnewline
75 & 273 & 315.511785224931 \tabularnewline
76 & 282.25 & 311.262203313761 \tabularnewline
77 & 191.25 & 308.361963667074 \tabularnewline
78 & 142.25 & 296.6543302291 \tabularnewline
79 & 259.25 & 281.218125070793 \tabularnewline
80 & 272.75 & 279.021853952167 \tabularnewline
81 & 173.75 & 278.394807669126 \tabularnewline
82 & 204.75 & 267.932415905076 \tabularnewline
83 & 185.525 & 261.615309505095 \tabularnewline
84 & 267.175 & 254.007508971218 \tabularnewline
85 & 190.25 & 255.324066438843 \tabularnewline
86 & 127.25 & 248.817512166912 \tabularnewline
87 & 183.5 & 236.662194084659 \tabularnewline
88 & 254.125 & 231.346538729213 \tabularnewline
\hline
\end{tabular}
%Source: https://freestatistics.org/blog/index.php?pk=74816&T=2

[TABLE]
[ROW][C]Actuals and Interpolation[/C][/ROW]
[ROW][C]Time[/C][C]Actual[/C][C]Forecast[/C][/ROW]
[ROW][C]1[/C][C]268.5[/C][C]NA[/C][/ROW]
[ROW][C]2[/C][C]247[/C][C]268.5[/C][/ROW]
[ROW][C]3[/C][C]250.25[/C][C]266.35[/C][/ROW]
[ROW][C]4[/C][C]196.5[/C][C]264.74[/C][/ROW]
[ROW][C]5[/C][C]200.85[/C][C]257.916[/C][/ROW]
[ROW][C]6[/C][C]192.75[/C][C]252.2094[/C][/ROW]
[ROW][C]7[/C][C]161[/C][C]246.26346[/C][/ROW]
[ROW][C]8[/C][C]270.55[/C][C]237.737114[/C][/ROW]
[ROW][C]9[/C][C]270.55[/C][C]241.0184026[/C][/ROW]
[ROW][C]10[/C][C]308[/C][C]243.97156234[/C][/ROW]
[ROW][C]11[/C][C]286.2[/C][C]250.374406106[/C][/ROW]
[ROW][C]12[/C][C]301.95[/C][C]253.9569654954[/C][/ROW]
[ROW][C]13[/C][C]364.825[/C][C]258.75626894586[/C][/ROW]
[ROW][C]14[/C][C]279[/C][C]269.363142051274[/C][/ROW]
[ROW][C]15[/C][C]261.246[/C][C]270.326827846147[/C][/ROW]
[ROW][C]16[/C][C]306[/C][C]269.418745061532[/C][/ROW]
[ROW][C]17[/C][C]268.075[/C][C]273.076870555379[/C][/ROW]
[ROW][C]18[/C][C]402.05[/C][C]272.576683499841[/C][/ROW]
[ROW][C]19[/C][C]225.525[/C][C]285.524015149857[/C][/ROW]
[ROW][C]20[/C][C]359.25[/C][C]279.524113634871[/C][/ROW]
[ROW][C]21[/C][C]0[/C][C]287.496702271384[/C][/ROW]
[ROW][C]22[/C][C]250[/C][C]287.496702271384[/C][/ROW]
[ROW][C]23[/C][C]400.3[/C][C]257.951847312951[/C][/ROW]
[ROW][C]24[/C][C]432.5[/C][C]271.011310862221[/C][/ROW]
[ROW][C]25[/C][C]347.2[/C][C]285.950135019278[/C][/ROW]
[ROW][C]26[/C][C]422.5[/C][C]291.658948979639[/C][/ROW]
[ROW][C]27[/C][C]330.5[/C][C]303.937460913683[/C][/ROW]
[ROW][C]28[/C][C]339.175[/C][C]306.445611064084[/C][/ROW]
[ROW][C]29[/C][C]205.8[/C][C]309.553389851043[/C][/ROW]
[ROW][C]30[/C][C]377.535[/C][C]299.651648104153[/C][/ROW]
[ROW][C]31[/C][C]320[/C][C]307.118557335331[/C][/ROW]
[ROW][C]32[/C][C]356.55[/C][C]308.358657577572[/C][/ROW]
[ROW][C]33[/C][C]314.9[/C][C]313.015420535409[/C][/ROW]
[ROW][C]34[/C][C]282.125[/C][C]313.198144412974[/C][/ROW]
[ROW][C]35[/C][C]440.5[/C][C]310.176179195247[/C][/ROW]
[ROW][C]36[/C][C]378.1[/C][C]322.885507209908[/C][/ROW]
[ROW][C]37[/C][C]391.85[/C][C]328.283468449948[/C][/ROW]
[ROW][C]38[/C][C]292.775[/C][C]334.511884051027[/C][/ROW]
[ROW][C]39[/C][C]387[/C][C]330.414127894790[/C][/ROW]
[ROW][C]40[/C][C]295.5[/C][C]335.979893815749[/C][/ROW]
[ROW][C]41[/C][C]343.35[/C][C]331.991764121373[/C][/ROW]
[ROW][C]42[/C][C]264.025[/C][C]333.112448919392[/C][/ROW]
[ROW][C]43[/C][C]322.5[/C][C]326.286689329056[/C][/ROW]
[ROW][C]44[/C][C]392.5[/C][C]325.912118907836[/C][/ROW]
[ROW][C]45[/C][C]315.75[/C][C]332.505972663929[/C][/ROW]
[ROW][C]46[/C][C]274.4[/C][C]330.845095647755[/C][/ROW]
[ROW][C]47[/C][C]361.875[/C][C]325.245254027762[/C][/ROW]
[ROW][C]48[/C][C]411.276[/C][C]328.882119639941[/C][/ROW]
[ROW][C]49[/C][C]518.775[/C][C]337.06861406508[/C][/ROW]
[ROW][C]50[/C][C]392.55[/C][C]355.134201741354[/C][/ROW]
[ROW][C]51[/C][C]467[/C][C]358.856302043389[/C][/ROW]
[ROW][C]52[/C][C]382.852[/C][C]369.619973560947[/C][/ROW]
[ROW][C]53[/C][C]449.25[/C][C]370.937590673297[/C][/ROW]
[ROW][C]54[/C][C]564.252[/C][C]378.739067378925[/C][/ROW]
[ROW][C]55[/C][C]417[/C][C]397.226879340228[/C][/ROW]
[ROW][C]56[/C][C]450.8[/C][C]399.198099713454[/C][/ROW]
[ROW][C]57[/C][C]538.675[/C][C]404.343977594834[/C][/ROW]
[ROW][C]58[/C][C]394[/C][C]417.74353865033[/C][/ROW]
[ROW][C]59[/C][C]532[/C][C]415.374521801108[/C][/ROW]
[ROW][C]60[/C][C]461.4[/C][C]427.013471000191[/C][/ROW]
[ROW][C]61[/C][C]523[/C][C]430.445860474613[/C][/ROW]
[ROW][C]62[/C][C]405.9[/C][C]439.686098995604[/C][/ROW]
[ROW][C]63[/C][C]386.25[/C][C]436.31247560928[/C][/ROW]
[ROW][C]64[/C][C]384.5[/C][C]431.312878909174[/C][/ROW]
[ROW][C]65[/C][C]382[/C][C]426.637188995105[/C][/ROW]
[ROW][C]66[/C][C]381.75[/C][C]422.17827469332[/C][/ROW]
[ROW][C]67[/C][C]151.5[/C][C]418.139364053424[/C][/ROW]
[ROW][C]68[/C][C]287.775[/C][C]391.498679540467[/C][/ROW]
[ROW][C]69[/C][C]247.6[/C][C]381.134452859780[/C][/ROW]
[ROW][C]70[/C][C]290.35[/C][C]367.790441323571[/C][/ROW]
[ROW][C]71[/C][C]266.55[/C][C]360.051321349813[/C][/ROW]
[ROW][C]72[/C][C]318.025[/C][C]350.706540425969[/C][/ROW]
[ROW][C]73[/C][C]213.3[/C][C]347.44006984888[/C][/ROW]
[ROW][C]74[/C][C]148.75[/C][C]334.032281929239[/C][/ROW]
[ROW][C]75[/C][C]273[/C][C]315.511785224931[/C][/ROW]
[ROW][C]76[/C][C]282.25[/C][C]311.262203313761[/C][/ROW]
[ROW][C]77[/C][C]191.25[/C][C]308.361963667074[/C][/ROW]
[ROW][C]78[/C][C]142.25[/C][C]296.6543302291[/C][/ROW]
[ROW][C]79[/C][C]259.25[/C][C]281.218125070793[/C][/ROW]
[ROW][C]80[/C][C]272.75[/C][C]279.021853952167[/C][/ROW]
[ROW][C]81[/C][C]173.75[/C][C]278.394807669126[/C][/ROW]
[ROW][C]82[/C][C]204.75[/C][C]267.932415905076[/C][/ROW]
[ROW][C]83[/C][C]185.525[/C][C]261.615309505095[/C][/ROW]
[ROW][C]84[/C][C]267.175[/C][C]254.007508971218[/C][/ROW]
[ROW][C]85[/C][C]190.25[/C][C]255.324066438843[/C][/ROW]
[ROW][C]86[/C][C]127.25[/C][C]248.817512166912[/C][/ROW]
[ROW][C]87[/C][C]183.5[/C][C]236.662194084659[/C][/ROW]
[ROW][C]88[/C][C]254.125[/C][C]231.346538729213[/C][/ROW]
[/TABLE]
Source: https://freestatistics.org/blog/index.php?pk=74816&T=2

Globally Unique Identifier (entire table): ba.freestatistics.org/blog/index.php?pk=74816&T=2

As an alternative you can also use a QR Code:  

The GUIDs for individual cells are displayed in the table below:

Actuals and Interpolation
TimeActualForecast
1268.5NA
2247268.5
3250.25266.35
4196.5264.74
5200.85257.916
6192.75252.2094
7161246.26346
8270.55237.737114
9270.55241.0184026
10308243.97156234
11286.2250.374406106
12301.95253.9569654954
13364.825258.75626894586
14279269.363142051274
15261.246270.326827846147
16306269.418745061532
17268.075273.076870555379
18402.05272.576683499841
19225.525285.524015149857
20359.25279.524113634871
210287.496702271384
22250287.496702271384
23400.3257.951847312951
24432.5271.011310862221
25347.2285.950135019278
26422.5291.658948979639
27330.5303.937460913683
28339.175306.445611064084
29205.8309.553389851043
30377.535299.651648104153
31320307.118557335331
32356.55308.358657577572
33314.9313.015420535409
34282.125313.198144412974
35440.5310.176179195247
36378.1322.885507209908
37391.85328.283468449948
38292.775334.511884051027
39387330.414127894790
40295.5335.979893815749
41343.35331.991764121373
42264.025333.112448919392
43322.5326.286689329056
44392.5325.912118907836
45315.75332.505972663929
46274.4330.845095647755
47361.875325.245254027762
48411.276328.882119639941
49518.775337.06861406508
50392.55355.134201741354
51467358.856302043389
52382.852369.619973560947
53449.25370.937590673297
54564.252378.739067378925
55417397.226879340228
56450.8399.198099713454
57538.675404.343977594834
58394417.74353865033
59532415.374521801108
60461.4427.013471000191
61523430.445860474613
62405.9439.686098995604
63386.25436.31247560928
64384.5431.312878909174
65382426.637188995105
66381.75422.17827469332
67151.5418.139364053424
68287.775391.498679540467
69247.6381.134452859780
70290.35367.790441323571
71266.55360.051321349813
72318.025350.706540425969
73213.3347.44006984888
74148.75334.032281929239
75273315.511785224931
76282.25311.262203313761
77191.25308.361963667074
78142.25296.6543302291
79259.25281.218125070793
80272.75279.021853952167
81173.75278.394807669126
82204.75267.932415905076
83185.525261.615309505095
84267.175254.007508971218
85190.25255.324066438843
86127.25248.817512166912
87183.5236.662194084659
88254.125231.346538729213


\begin{tabular}{lllllllll}
\hline
What is next? \tabularnewline
Simulate Time Series \tabularnewline
Generate Forecasts \tabularnewline
Forecast Analysis \tabularnewline
\hline
\end{tabular}
%Source: https://freestatistics.org/blog/index.php?pk=74816&T=3

[TABLE]
[ROW][C]What is next?[/C][/ROW]
[ROW][C]Simulate Time Series[/C][/ROW]
[ROW][C]Generate Forecasts[/C][/ROW]
[ROW][C]Forecast Analysis[/C][/ROW]
[/TABLE]
Source: https://freestatistics.org/blog/index.php?pk=74816&T=3

Globally Unique Identifier (entire table): ba.freestatistics.org/blog/index.php?pk=74816&T=3

As an alternative you can also use a QR Code:  

The GUIDs for individual cells are displayed in the table below:

What is next?
Simulate Time Series
Generate Forecasts
Forecast Analysis


Parameters (Session):
par1 = Input box ; par2 = Croston ; par3 = NA ; par4 = NA ; par5 = ZZZ ; par6 = 12 ; par7 = dum ; par8 = B521crostonm ; par9 = 3 ; par10 = 0.1 ;
Parameters (R input):
par1 = Input box ; par2 = Croston ; par3 = NA ; par4 = NA ; par5 = ZZZ ; par6 = 12 ; par7 = dum ; par8 = B521crostonm ; par9 = 3 ; par10 = 0.1 ;
R code (references can be found in the software module):
if(par3!='NA') par3 <- as.numeric(par3) else par3 <- NA
if(par4!='NA') par4 <- as.numeric(par4) else par4 <- NA
par6 <- as.numeric(par6) #Seasonal Period
par9 <- as.numeric(par9) #Forecast Horizon
par10 <- as.numeric(par10) #Alpha
library(forecast)
if (par1 == 'CSV') {
xarr <- read.csv(file=paste('tmp/',par7,'.csv',sep=''),header=T)
numseries <- length(xarr[1,])-1
n <- length(xarr[,1])
nmh <- n - par9
nmhp1 <- nmh + 1
rarr <- array(NA,dim=c(n,numseries))
farr <- array(NA,dim=c(n,numseries))
parr <- array(NA,dim=c(numseries,8))
colnames(parr) = list('ME','RMSE','MAE','MPE','MAPE','MASE','ACF1','TheilU')
for(i in 1:numseries) {
sindex <- i+1
x <- xarr[,sindex]
if(par2=='Croston') {
if (i==1) m <- croston(x,alpha=par10)
if (i==1) mydemand <- m$model$demand[]
fit <- croston(x[1:nmh],h=par9,alpha=par10)
}
if(par2=='ARIMA') {
m <- auto.arima(ts(x,freq=par6),d=par3,D=par4)
mydemand <- forecast(m)
fit <- auto.arima(ts(x[1:nmh],freq=par6),d=par3,D=par4)
}
if(par2=='ETS') {
m <- ets(ts(x,freq=par6),model=par5)
mydemand <- forecast(m)
fit <- ets(ts(x[1:nmh],freq=par6),model=par5)
}
try(rarr[,i] <- mydemand$resid,silent=T)
try(farr[,i] <- mydemand$mean,silent=T)
if (par2!='Croston') parr[i,] <- accuracy(forecast(fit,par9),x[nmhp1:n])
if (par2=='Croston') parr[i,] <- accuracy(fit,x[nmhp1:n])
}
write.csv(farr,file=paste('tmp/',par8,'_f.csv',sep=''))
write.csv(rarr,file=paste('tmp/',par8,'_r.csv',sep=''))
write.csv(parr,file=paste('tmp/',par8,'_p.csv',sep=''))
}
if (par1 == 'Input box') {
numseries <- 1
n <- length(x)
if(par2=='Croston') {
m <- croston(x)
mydemand <- m$model$demand[]
}
if(par2=='ARIMA') {
m <- auto.arima(ts(x,freq=par6),d=par3,D=par4)
mydemand <- forecast(m)
}
if(par2=='ETS') {
m <- ets(ts(x,freq=par6),model=par5)
mydemand <- forecast(m)
}
summary(m)
}
bitmap(file='test1.png')
op <- par(mfrow=c(2,1))
if (par2=='Croston') plot(m)
if ((par2=='ARIMA') | par2=='ETS') plot(forecast(m))
plot(mydemand$resid,type='l',main='Residuals', ylab='residual value', xlab='time')
par(op)
dev.off()
bitmap(file='pic2.png')
op <- par(mfrow=c(2,2))
acf(mydemand$resid, lag.max=n/3, main='Residual ACF', ylab='autocorrelation', xlab='time lag')
pacf(mydemand$resid,lag.max=n/3, main='Residual PACF', ylab='partial autocorrelation', xlab='time lag')
cpgram(mydemand$resid, main='Cumulative Periodogram of Residuals')
qqnorm(mydemand$resid); qqline(mydemand$resid, col=2)
par(op)
dev.off()
load(file='createtable')
a<-table.start()
a<-table.row.start(a)
a<-table.element(a,'Demand Forecast',6,TRUE)
a<-table.row.end(a)
a<-table.row.start(a)
a<-table.element(a,'Point',header=TRUE)
a<-table.element(a,'Forecast',header=TRUE)
a<-table.element(a,'95% LB',header=TRUE)
a<-table.element(a,'80% LB',header=TRUE)
a<-table.element(a,'80% UB',header=TRUE)
a<-table.element(a,'95% UB',header=TRUE)
a<-table.row.end(a)
for (i in 1:length(mydemand$mean)) {
a<-table.row.start(a)
a<-table.element(a,i+n,header=TRUE)
a<-table.element(a,as.numeric(mydemand$mean[i]))
a<-table.element(a,as.numeric(mydemand$lower[i,2]))
a<-table.element(a,as.numeric(mydemand$lower[i,1]))
a<-table.element(a,as.numeric(mydemand$upper[i,1]))
a<-table.element(a,as.numeric(mydemand$upper[i,2]))
a<-table.row.end(a)
}
a<-table.end(a)
table.save(a,file='mytable.tab')
a<-table.start()
a<-table.row.start(a)
a<-table.element(a,'Actuals and Interpolation',3,TRUE)
a<-table.row.end(a)
a<-table.row.start(a)
a<-table.element(a,'Time',header=TRUE)
a<-table.element(a,'Actual',header=TRUE)
a<-table.element(a,'Forecast',header=TRUE)
a<-table.row.end(a)
for (i in 1:n) {
a<-table.row.start(a)
a<-table.element(a,i,header=TRUE)
a<-table.element(a,x[i])
a<-table.element(a,x[i] - as.numeric(m$resid[i]))
a<-table.row.end(a)
}
a<-table.end(a)
table.save(a,file='mytable1.tab')
a<-table.start()
a<-table.row.start(a)
a<-table.element(a,'What is next?',1,TRUE)
a<-table.row.end(a)
a<-table.row.start(a)
a<-table.element(a,hyperlink(paste('https://automated.biganalytics.eu/Patrick.Wessa/rwasp_demand_forecasting_simulate.wasp',sep=''),'Simulate Time Series','',target=''))
a<-table.row.end(a)
a<-table.row.start(a)
a<-table.element(a,hyperlink(paste('https://automated.biganalytics.eu/Patrick.Wessa/rwasp_demand_forecasting_croston.wasp',sep=''),'Generate Forecasts','',target=''))
a<-table.row.end(a)
a<-table.row.start(a)
a<-table.element(a,hyperlink(paste('https://automated.biganalytics.eu/Patrick.Wessa/rwasp_demand_forecasting_analysis.wasp',sep=''),'Forecast Analysis','',target=''))
a<-table.row.end(a)
a<-table.end(a)
table.save(a,file='mytable0.tab')
-SERVER-wessa.org