Free Statistics

of Irreproducible Research!

Author's title

Author*Unverified author*
R Software ModulePatrick.Wessarwasp_demand_forecasting_croston.wasp
Title produced by softwareCroston Forecasting
Date of computationMon, 26 Apr 2010 13:27:22 +0000
Cite this page as followsStatistical Computations at FreeStatistics.org, Office for Research Development and Education, URL https://freestatistics.org/blog/index.php?v=date/2010/Apr/26/t1272288748z2761o9zm7metw1.htm/, Retrieved Wed, 24 Apr 2024 09:24:29 +0000
Statistical Computations at FreeStatistics.org, Office for Research Development and Education, URL https://freestatistics.org/blog/index.php?pk=74815, Retrieved Wed, 24 Apr 2024 09:24:29 +0000
QR Codes:

Original text written by user:
IsPrivate?No (this computation is public)
User-defined keywordsb511,steven,coomans,forecast,thesis,croston,permaand
Estimated Impact170
Family? (F = Feedback message, R = changed R code, M = changed R Module, P = changed Parameters, D = changed Data)
-       [Croston Forecasting] [b511,steven,cooma...] [2010-04-26 13:27:22] [d41d8cd98f00b204e9800998ecf8427e] [Current]
Feedback Forum

Post a new message
Dataseries X:
22.6
44.6
45.2
69
66
47
67.8
22.6
22.6
44.5
44.6
47
45.2
40.5
66
24.4
2.3
0
0
48
0
0
0
0
8
6
0
0
0
0.02
2
0
22
46.5
66
44
66
44
66
66
66
76
34
66
66
66
66
66
44
44
66
87.5
66.000
66
66
65.5
65.5
88
42
88
88
64
88
88
88
63
110
85
88
108
88.023
88
66
44.5
88.5
88
108
66
85
66
66
110
83
66
83
44
83
105


Summary of computational transaction
Raw Inputview raw input (R code)
Raw Outputview raw output of R engine
Computing time6 seconds
R Serverwessa.org @ wessa.org

\begin{tabular}{lllllllll}
\hline
Summary of computational transaction \tabularnewline
Raw Input & view raw input (R code)  \tabularnewline
Raw Output & view raw output of R engine  \tabularnewline
Computing time & 6 seconds \tabularnewline
R Server & wessa.org @ wessa.org \tabularnewline
\hline
\end{tabular}
%Source: https://freestatistics.org/blog/index.php?pk=74815&T=0

[TABLE]
[ROW][C]Summary of computational transaction[/C][/ROW]
[ROW][C]Raw Input[/C][C]view raw input (R code) [/C][/ROW]
[ROW][C]Raw Output[/C][C]view raw output of R engine [/C][/ROW]
[ROW][C]Computing time[/C][C]6 seconds[/C][/ROW]
[ROW][C]R Server[/C][C]wessa.org @ wessa.org[/C][/ROW]
[/TABLE]
Source: https://freestatistics.org/blog/index.php?pk=74815&T=0

Globally Unique Identifier (entire table): ba.freestatistics.org/blog/index.php?pk=74815&T=0

As an alternative you can also use a QR Code:  

The GUIDs for individual cells are displayed in the table below:

Summary of computational transaction
Raw Inputview raw input (R code)
Raw Outputview raw output of R engine
Computing time6 seconds
R Serverwessa.org @ wessa.org


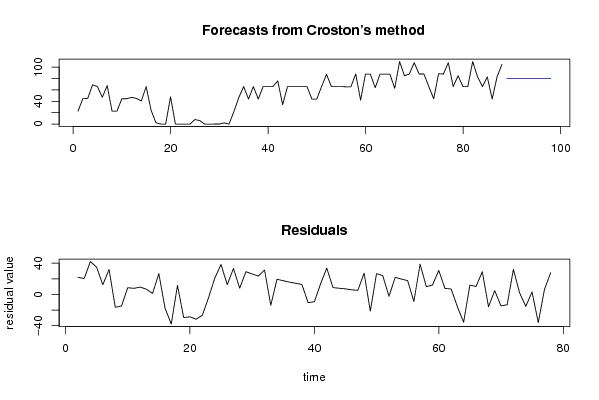
Demand Forecast
PointForecast95% LB80% LB80% UB95% UB
8979.907364245657240.697949492318554.2697059735738105.545022517741119.116778998996
9079.907364245657240.502390100857654.1418365605333105.672891930781119.312338390457
9179.907364245657240.307796452494154.0145986129627105.800129878352119.506932038820
9279.907364245657240.114154379421153.8879828670308105.926745624283119.700574111893
9379.907364245657239.921450056891853.7619802832219106.052748208092119.893278434422
9479.907364245657239.729669991702053.6365820388037106.178146452511120.085058499612
9579.907364245657239.538801011163853.5117795206186106.302948970696120.275927480151
9679.907364245657239.348830252546853.3875643181794106.427164173135120.465898238767
9779.907364245657239.159745152963253.263928217055106.550800274259120.654983338351
9879.907364245657238.971533439671753.1408631925316106.673865298783120.843195051643

\begin{tabular}{lllllllll}
\hline
Demand Forecast \tabularnewline
Point & Forecast & 95% LB & 80% LB & 80% UB & 95% UB \tabularnewline
89 & 79.9073642456572 & 40.6979494923185 & 54.2697059735738 & 105.545022517741 & 119.116778998996 \tabularnewline
90 & 79.9073642456572 & 40.5023901008576 & 54.1418365605333 & 105.672891930781 & 119.312338390457 \tabularnewline
91 & 79.9073642456572 & 40.3077964524941 & 54.0145986129627 & 105.800129878352 & 119.506932038820 \tabularnewline
92 & 79.9073642456572 & 40.1141543794211 & 53.8879828670308 & 105.926745624283 & 119.700574111893 \tabularnewline
93 & 79.9073642456572 & 39.9214500568918 & 53.7619802832219 & 106.052748208092 & 119.893278434422 \tabularnewline
94 & 79.9073642456572 & 39.7296699917020 & 53.6365820388037 & 106.178146452511 & 120.085058499612 \tabularnewline
95 & 79.9073642456572 & 39.5388010111638 & 53.5117795206186 & 106.302948970696 & 120.275927480151 \tabularnewline
96 & 79.9073642456572 & 39.3488302525468 & 53.3875643181794 & 106.427164173135 & 120.465898238767 \tabularnewline
97 & 79.9073642456572 & 39.1597451529632 & 53.263928217055 & 106.550800274259 & 120.654983338351 \tabularnewline
98 & 79.9073642456572 & 38.9715334396717 & 53.1408631925316 & 106.673865298783 & 120.843195051643 \tabularnewline
\hline
\end{tabular}
%Source: https://freestatistics.org/blog/index.php?pk=74815&T=1

[TABLE]
[ROW][C]Demand Forecast[/C][/ROW]
[ROW][C]Point[/C][C]Forecast[/C][C]95% LB[/C][C]80% LB[/C][C]80% UB[/C][C]95% UB[/C][/ROW]
[ROW][C]89[/C][C]79.9073642456572[/C][C]40.6979494923185[/C][C]54.2697059735738[/C][C]105.545022517741[/C][C]119.116778998996[/C][/ROW]
[ROW][C]90[/C][C]79.9073642456572[/C][C]40.5023901008576[/C][C]54.1418365605333[/C][C]105.672891930781[/C][C]119.312338390457[/C][/ROW]
[ROW][C]91[/C][C]79.9073642456572[/C][C]40.3077964524941[/C][C]54.0145986129627[/C][C]105.800129878352[/C][C]119.506932038820[/C][/ROW]
[ROW][C]92[/C][C]79.9073642456572[/C][C]40.1141543794211[/C][C]53.8879828670308[/C][C]105.926745624283[/C][C]119.700574111893[/C][/ROW]
[ROW][C]93[/C][C]79.9073642456572[/C][C]39.9214500568918[/C][C]53.7619802832219[/C][C]106.052748208092[/C][C]119.893278434422[/C][/ROW]
[ROW][C]94[/C][C]79.9073642456572[/C][C]39.7296699917020[/C][C]53.6365820388037[/C][C]106.178146452511[/C][C]120.085058499612[/C][/ROW]
[ROW][C]95[/C][C]79.9073642456572[/C][C]39.5388010111638[/C][C]53.5117795206186[/C][C]106.302948970696[/C][C]120.275927480151[/C][/ROW]
[ROW][C]96[/C][C]79.9073642456572[/C][C]39.3488302525468[/C][C]53.3875643181794[/C][C]106.427164173135[/C][C]120.465898238767[/C][/ROW]
[ROW][C]97[/C][C]79.9073642456572[/C][C]39.1597451529632[/C][C]53.263928217055[/C][C]106.550800274259[/C][C]120.654983338351[/C][/ROW]
[ROW][C]98[/C][C]79.9073642456572[/C][C]38.9715334396717[/C][C]53.1408631925316[/C][C]106.673865298783[/C][C]120.843195051643[/C][/ROW]
[/TABLE]
Source: https://freestatistics.org/blog/index.php?pk=74815&T=1

Globally Unique Identifier (entire table): ba.freestatistics.org/blog/index.php?pk=74815&T=1

As an alternative you can also use a QR Code:  

The GUIDs for individual cells are displayed in the table below:

Demand Forecast
PointForecast95% LB80% LB80% UB95% UB
8979.907364245657240.697949492318554.2697059735738105.545022517741119.116778998996
9079.907364245657240.502390100857654.1418365605333105.672891930781119.312338390457
9179.907364245657240.307796452494154.0145986129627105.800129878352119.506932038820
9279.907364245657240.114154379421153.8879828670308105.926745624283119.700574111893
9379.907364245657239.921450056891853.7619802832219106.052748208092119.893278434422
9479.907364245657239.729669991702053.6365820388037106.178146452511120.085058499612
9579.907364245657239.538801011163853.5117795206186106.302948970696120.275927480151
9679.907364245657239.348830252546853.3875643181794106.427164173135120.465898238767
9779.907364245657239.159745152963253.263928217055106.550800274259120.654983338351
9879.907364245657238.971533439671753.1408631925316106.673865298783120.843195051643


Actuals and Interpolation
TimeActualForecast
122.6NA
244.622.6
345.224.8
46926.84
56631.056
64734.5504
767.835.79536
822.638.995824
922.637.3562416
1044.535.88061744
1144.636.742555696
124737.5283001264
1345.238.47547011376
1440.539.147923102384
156639.2831307921456
1624.441.9548177129311
172.340.1993359416379
18036.4094023474741
19036.4094023474741
204836.4094023474741
21031.3070517606056
22031.3070517606056
23031.3070517606056
24031.3070517606056
25831.3070517606056
26621.9060860135785
27020.8610080889019
28020.8610080889019
29020.8610080889019
300.0220.8610080889019
31216.147253294258
32015.311532231519
332215.311532231519
3446.514.8112204041594
356616.7303751293463
364419.8367800144359
376621.4187024614594
384424.4417509474760
396625.8121036758916
406628.7147675156586
416631.4847084376460
427634.1165315789855
433437.3878764640517
446637.1173402597233
456639.4711618767186
466641.6739161525754
476643.7286338941152
486645.6394824777996
494447.4115493285947
504447.1107266150881
516646.8331481646340
5287.548.5620734890819
536652.1091750738346
546653.3859459919329
556654.5548135544771
5665.555.6232071101794
5765.556.5513665723761
588857.3974017937913
594260.3065526188112
608858.5576554701051
618861.383016951335
626463.9476041115951
638863.9526710222928
648866.2858418066584
658868.3989270643913
666370.3115179364795
6711069.5963568630292
688573.5570182299898
698874.6809603746687
7010875.9915023030596
7188.02379.1460740701206
728880.0221990759717
736680.8106106224677
7444.579.3452212119394
7588.575.8939181499635
768877.1437000124855
7710878.2209315770863
786681.1780889878318
798579.6698049229845
806680.199812128388
816678.7870573832083
8211077.5142113756624
838380.7493860030258
846680.9736112773917
858379.4812585703795
864479.8320730951588
878376.2585799913025
8810576.9310766849343

\begin{tabular}{lllllllll}
\hline
Actuals and Interpolation \tabularnewline
Time & Actual & Forecast \tabularnewline
1 & 22.6 & NA \tabularnewline
2 & 44.6 & 22.6 \tabularnewline
3 & 45.2 & 24.8 \tabularnewline
4 & 69 & 26.84 \tabularnewline
5 & 66 & 31.056 \tabularnewline
6 & 47 & 34.5504 \tabularnewline
7 & 67.8 & 35.79536 \tabularnewline
8 & 22.6 & 38.995824 \tabularnewline
9 & 22.6 & 37.3562416 \tabularnewline
10 & 44.5 & 35.88061744 \tabularnewline
11 & 44.6 & 36.742555696 \tabularnewline
12 & 47 & 37.5283001264 \tabularnewline
13 & 45.2 & 38.47547011376 \tabularnewline
14 & 40.5 & 39.147923102384 \tabularnewline
15 & 66 & 39.2831307921456 \tabularnewline
16 & 24.4 & 41.9548177129311 \tabularnewline
17 & 2.3 & 40.1993359416379 \tabularnewline
18 & 0 & 36.4094023474741 \tabularnewline
19 & 0 & 36.4094023474741 \tabularnewline
20 & 48 & 36.4094023474741 \tabularnewline
21 & 0 & 31.3070517606056 \tabularnewline
22 & 0 & 31.3070517606056 \tabularnewline
23 & 0 & 31.3070517606056 \tabularnewline
24 & 0 & 31.3070517606056 \tabularnewline
25 & 8 & 31.3070517606056 \tabularnewline
26 & 6 & 21.9060860135785 \tabularnewline
27 & 0 & 20.8610080889019 \tabularnewline
28 & 0 & 20.8610080889019 \tabularnewline
29 & 0 & 20.8610080889019 \tabularnewline
30 & 0.02 & 20.8610080889019 \tabularnewline
31 & 2 & 16.147253294258 \tabularnewline
32 & 0 & 15.311532231519 \tabularnewline
33 & 22 & 15.311532231519 \tabularnewline
34 & 46.5 & 14.8112204041594 \tabularnewline
35 & 66 & 16.7303751293463 \tabularnewline
36 & 44 & 19.8367800144359 \tabularnewline
37 & 66 & 21.4187024614594 \tabularnewline
38 & 44 & 24.4417509474760 \tabularnewline
39 & 66 & 25.8121036758916 \tabularnewline
40 & 66 & 28.7147675156586 \tabularnewline
41 & 66 & 31.4847084376460 \tabularnewline
42 & 76 & 34.1165315789855 \tabularnewline
43 & 34 & 37.3878764640517 \tabularnewline
44 & 66 & 37.1173402597233 \tabularnewline
45 & 66 & 39.4711618767186 \tabularnewline
46 & 66 & 41.6739161525754 \tabularnewline
47 & 66 & 43.7286338941152 \tabularnewline
48 & 66 & 45.6394824777996 \tabularnewline
49 & 44 & 47.4115493285947 \tabularnewline
50 & 44 & 47.1107266150881 \tabularnewline
51 & 66 & 46.8331481646340 \tabularnewline
52 & 87.5 & 48.5620734890819 \tabularnewline
53 & 66 & 52.1091750738346 \tabularnewline
54 & 66 & 53.3859459919329 \tabularnewline
55 & 66 & 54.5548135544771 \tabularnewline
56 & 65.5 & 55.6232071101794 \tabularnewline
57 & 65.5 & 56.5513665723761 \tabularnewline
58 & 88 & 57.3974017937913 \tabularnewline
59 & 42 & 60.3065526188112 \tabularnewline
60 & 88 & 58.5576554701051 \tabularnewline
61 & 88 & 61.383016951335 \tabularnewline
62 & 64 & 63.9476041115951 \tabularnewline
63 & 88 & 63.9526710222928 \tabularnewline
64 & 88 & 66.2858418066584 \tabularnewline
65 & 88 & 68.3989270643913 \tabularnewline
66 & 63 & 70.3115179364795 \tabularnewline
67 & 110 & 69.5963568630292 \tabularnewline
68 & 85 & 73.5570182299898 \tabularnewline
69 & 88 & 74.6809603746687 \tabularnewline
70 & 108 & 75.9915023030596 \tabularnewline
71 & 88.023 & 79.1460740701206 \tabularnewline
72 & 88 & 80.0221990759717 \tabularnewline
73 & 66 & 80.8106106224677 \tabularnewline
74 & 44.5 & 79.3452212119394 \tabularnewline
75 & 88.5 & 75.8939181499635 \tabularnewline
76 & 88 & 77.1437000124855 \tabularnewline
77 & 108 & 78.2209315770863 \tabularnewline
78 & 66 & 81.1780889878318 \tabularnewline
79 & 85 & 79.6698049229845 \tabularnewline
80 & 66 & 80.199812128388 \tabularnewline
81 & 66 & 78.7870573832083 \tabularnewline
82 & 110 & 77.5142113756624 \tabularnewline
83 & 83 & 80.7493860030258 \tabularnewline
84 & 66 & 80.9736112773917 \tabularnewline
85 & 83 & 79.4812585703795 \tabularnewline
86 & 44 & 79.8320730951588 \tabularnewline
87 & 83 & 76.2585799913025 \tabularnewline
88 & 105 & 76.9310766849343 \tabularnewline
\hline
\end{tabular}
%Source: https://freestatistics.org/blog/index.php?pk=74815&T=2

[TABLE]
[ROW][C]Actuals and Interpolation[/C][/ROW]
[ROW][C]Time[/C][C]Actual[/C][C]Forecast[/C][/ROW]
[ROW][C]1[/C][C]22.6[/C][C]NA[/C][/ROW]
[ROW][C]2[/C][C]44.6[/C][C]22.6[/C][/ROW]
[ROW][C]3[/C][C]45.2[/C][C]24.8[/C][/ROW]
[ROW][C]4[/C][C]69[/C][C]26.84[/C][/ROW]
[ROW][C]5[/C][C]66[/C][C]31.056[/C][/ROW]
[ROW][C]6[/C][C]47[/C][C]34.5504[/C][/ROW]
[ROW][C]7[/C][C]67.8[/C][C]35.79536[/C][/ROW]
[ROW][C]8[/C][C]22.6[/C][C]38.995824[/C][/ROW]
[ROW][C]9[/C][C]22.6[/C][C]37.3562416[/C][/ROW]
[ROW][C]10[/C][C]44.5[/C][C]35.88061744[/C][/ROW]
[ROW][C]11[/C][C]44.6[/C][C]36.742555696[/C][/ROW]
[ROW][C]12[/C][C]47[/C][C]37.5283001264[/C][/ROW]
[ROW][C]13[/C][C]45.2[/C][C]38.47547011376[/C][/ROW]
[ROW][C]14[/C][C]40.5[/C][C]39.147923102384[/C][/ROW]
[ROW][C]15[/C][C]66[/C][C]39.2831307921456[/C][/ROW]
[ROW][C]16[/C][C]24.4[/C][C]41.9548177129311[/C][/ROW]
[ROW][C]17[/C][C]2.3[/C][C]40.1993359416379[/C][/ROW]
[ROW][C]18[/C][C]0[/C][C]36.4094023474741[/C][/ROW]
[ROW][C]19[/C][C]0[/C][C]36.4094023474741[/C][/ROW]
[ROW][C]20[/C][C]48[/C][C]36.4094023474741[/C][/ROW]
[ROW][C]21[/C][C]0[/C][C]31.3070517606056[/C][/ROW]
[ROW][C]22[/C][C]0[/C][C]31.3070517606056[/C][/ROW]
[ROW][C]23[/C][C]0[/C][C]31.3070517606056[/C][/ROW]
[ROW][C]24[/C][C]0[/C][C]31.3070517606056[/C][/ROW]
[ROW][C]25[/C][C]8[/C][C]31.3070517606056[/C][/ROW]
[ROW][C]26[/C][C]6[/C][C]21.9060860135785[/C][/ROW]
[ROW][C]27[/C][C]0[/C][C]20.8610080889019[/C][/ROW]
[ROW][C]28[/C][C]0[/C][C]20.8610080889019[/C][/ROW]
[ROW][C]29[/C][C]0[/C][C]20.8610080889019[/C][/ROW]
[ROW][C]30[/C][C]0.02[/C][C]20.8610080889019[/C][/ROW]
[ROW][C]31[/C][C]2[/C][C]16.147253294258[/C][/ROW]
[ROW][C]32[/C][C]0[/C][C]15.311532231519[/C][/ROW]
[ROW][C]33[/C][C]22[/C][C]15.311532231519[/C][/ROW]
[ROW][C]34[/C][C]46.5[/C][C]14.8112204041594[/C][/ROW]
[ROW][C]35[/C][C]66[/C][C]16.7303751293463[/C][/ROW]
[ROW][C]36[/C][C]44[/C][C]19.8367800144359[/C][/ROW]
[ROW][C]37[/C][C]66[/C][C]21.4187024614594[/C][/ROW]
[ROW][C]38[/C][C]44[/C][C]24.4417509474760[/C][/ROW]
[ROW][C]39[/C][C]66[/C][C]25.8121036758916[/C][/ROW]
[ROW][C]40[/C][C]66[/C][C]28.7147675156586[/C][/ROW]
[ROW][C]41[/C][C]66[/C][C]31.4847084376460[/C][/ROW]
[ROW][C]42[/C][C]76[/C][C]34.1165315789855[/C][/ROW]
[ROW][C]43[/C][C]34[/C][C]37.3878764640517[/C][/ROW]
[ROW][C]44[/C][C]66[/C][C]37.1173402597233[/C][/ROW]
[ROW][C]45[/C][C]66[/C][C]39.4711618767186[/C][/ROW]
[ROW][C]46[/C][C]66[/C][C]41.6739161525754[/C][/ROW]
[ROW][C]47[/C][C]66[/C][C]43.7286338941152[/C][/ROW]
[ROW][C]48[/C][C]66[/C][C]45.6394824777996[/C][/ROW]
[ROW][C]49[/C][C]44[/C][C]47.4115493285947[/C][/ROW]
[ROW][C]50[/C][C]44[/C][C]47.1107266150881[/C][/ROW]
[ROW][C]51[/C][C]66[/C][C]46.8331481646340[/C][/ROW]
[ROW][C]52[/C][C]87.5[/C][C]48.5620734890819[/C][/ROW]
[ROW][C]53[/C][C]66[/C][C]52.1091750738346[/C][/ROW]
[ROW][C]54[/C][C]66[/C][C]53.3859459919329[/C][/ROW]
[ROW][C]55[/C][C]66[/C][C]54.5548135544771[/C][/ROW]
[ROW][C]56[/C][C]65.5[/C][C]55.6232071101794[/C][/ROW]
[ROW][C]57[/C][C]65.5[/C][C]56.5513665723761[/C][/ROW]
[ROW][C]58[/C][C]88[/C][C]57.3974017937913[/C][/ROW]
[ROW][C]59[/C][C]42[/C][C]60.3065526188112[/C][/ROW]
[ROW][C]60[/C][C]88[/C][C]58.5576554701051[/C][/ROW]
[ROW][C]61[/C][C]88[/C][C]61.383016951335[/C][/ROW]
[ROW][C]62[/C][C]64[/C][C]63.9476041115951[/C][/ROW]
[ROW][C]63[/C][C]88[/C][C]63.9526710222928[/C][/ROW]
[ROW][C]64[/C][C]88[/C][C]66.2858418066584[/C][/ROW]
[ROW][C]65[/C][C]88[/C][C]68.3989270643913[/C][/ROW]
[ROW][C]66[/C][C]63[/C][C]70.3115179364795[/C][/ROW]
[ROW][C]67[/C][C]110[/C][C]69.5963568630292[/C][/ROW]
[ROW][C]68[/C][C]85[/C][C]73.5570182299898[/C][/ROW]
[ROW][C]69[/C][C]88[/C][C]74.6809603746687[/C][/ROW]
[ROW][C]70[/C][C]108[/C][C]75.9915023030596[/C][/ROW]
[ROW][C]71[/C][C]88.023[/C][C]79.1460740701206[/C][/ROW]
[ROW][C]72[/C][C]88[/C][C]80.0221990759717[/C][/ROW]
[ROW][C]73[/C][C]66[/C][C]80.8106106224677[/C][/ROW]
[ROW][C]74[/C][C]44.5[/C][C]79.3452212119394[/C][/ROW]
[ROW][C]75[/C][C]88.5[/C][C]75.8939181499635[/C][/ROW]
[ROW][C]76[/C][C]88[/C][C]77.1437000124855[/C][/ROW]
[ROW][C]77[/C][C]108[/C][C]78.2209315770863[/C][/ROW]
[ROW][C]78[/C][C]66[/C][C]81.1780889878318[/C][/ROW]
[ROW][C]79[/C][C]85[/C][C]79.6698049229845[/C][/ROW]
[ROW][C]80[/C][C]66[/C][C]80.199812128388[/C][/ROW]
[ROW][C]81[/C][C]66[/C][C]78.7870573832083[/C][/ROW]
[ROW][C]82[/C][C]110[/C][C]77.5142113756624[/C][/ROW]
[ROW][C]83[/C][C]83[/C][C]80.7493860030258[/C][/ROW]
[ROW][C]84[/C][C]66[/C][C]80.9736112773917[/C][/ROW]
[ROW][C]85[/C][C]83[/C][C]79.4812585703795[/C][/ROW]
[ROW][C]86[/C][C]44[/C][C]79.8320730951588[/C][/ROW]
[ROW][C]87[/C][C]83[/C][C]76.2585799913025[/C][/ROW]
[ROW][C]88[/C][C]105[/C][C]76.9310766849343[/C][/ROW]
[/TABLE]
Source: https://freestatistics.org/blog/index.php?pk=74815&T=2

Globally Unique Identifier (entire table): ba.freestatistics.org/blog/index.php?pk=74815&T=2

As an alternative you can also use a QR Code:  

The GUIDs for individual cells are displayed in the table below:

Actuals and Interpolation
TimeActualForecast
122.6NA
244.622.6
345.224.8
46926.84
56631.056
64734.5504
767.835.79536
822.638.995824
922.637.3562416
1044.535.88061744
1144.636.742555696
124737.5283001264
1345.238.47547011376
1440.539.147923102384
156639.2831307921456
1624.441.9548177129311
172.340.1993359416379
18036.4094023474741
19036.4094023474741
204836.4094023474741
21031.3070517606056
22031.3070517606056
23031.3070517606056
24031.3070517606056
25831.3070517606056
26621.9060860135785
27020.8610080889019
28020.8610080889019
29020.8610080889019
300.0220.8610080889019
31216.147253294258
32015.311532231519
332215.311532231519
3446.514.8112204041594
356616.7303751293463
364419.8367800144359
376621.4187024614594
384424.4417509474760
396625.8121036758916
406628.7147675156586
416631.4847084376460
427634.1165315789855
433437.3878764640517
446637.1173402597233
456639.4711618767186
466641.6739161525754
476643.7286338941152
486645.6394824777996
494447.4115493285947
504447.1107266150881
516646.8331481646340
5287.548.5620734890819
536652.1091750738346
546653.3859459919329
556654.5548135544771
5665.555.6232071101794
5765.556.5513665723761
588857.3974017937913
594260.3065526188112
608858.5576554701051
618861.383016951335
626463.9476041115951
638863.9526710222928
648866.2858418066584
658868.3989270643913
666370.3115179364795
6711069.5963568630292
688573.5570182299898
698874.6809603746687
7010875.9915023030596
7188.02379.1460740701206
728880.0221990759717
736680.8106106224677
7444.579.3452212119394
7588.575.8939181499635
768877.1437000124855
7710878.2209315770863
786681.1780889878318
798579.6698049229845
806680.199812128388
816678.7870573832083
8211077.5142113756624
838380.7493860030258
846680.9736112773917
858379.4812585703795
864479.8320730951588
878376.2585799913025
8810576.9310766849343


\begin{tabular}{lllllllll}
\hline
What is next? \tabularnewline
Simulate Time Series \tabularnewline
Generate Forecasts \tabularnewline
Forecast Analysis \tabularnewline
\hline
\end{tabular}
%Source: https://freestatistics.org/blog/index.php?pk=74815&T=3

[TABLE]
[ROW][C]What is next?[/C][/ROW]
[ROW][C]Simulate Time Series[/C][/ROW]
[ROW][C]Generate Forecasts[/C][/ROW]
[ROW][C]Forecast Analysis[/C][/ROW]
[/TABLE]
Source: https://freestatistics.org/blog/index.php?pk=74815&T=3

Globally Unique Identifier (entire table): ba.freestatistics.org/blog/index.php?pk=74815&T=3

As an alternative you can also use a QR Code:  

The GUIDs for individual cells are displayed in the table below:

What is next?
Simulate Time Series
Generate Forecasts
Forecast Analysis


Parameters (Session):
par1 = Input box ; par2 = Croston ; par3 = NA ; par4 = NA ; par5 = ZZZ ; par6 = 12 ; par7 = dum ; par8 = B511crostonm ; par9 = 3 ; par10 = 0.1 ;
Parameters (R input):
par1 = Input box ; par2 = Croston ; par3 = NA ; par4 = NA ; par5 = ZZZ ; par6 = 12 ; par7 = dum ; par8 = B511crostonm ; par9 = 3 ; par10 = 0.1 ;
R code (references can be found in the software module):
if(par3!='NA') par3 <- as.numeric(par3) else par3 <- NA
if(par4!='NA') par4 <- as.numeric(par4) else par4 <- NA
par6 <- as.numeric(par6) #Seasonal Period
par9 <- as.numeric(par9) #Forecast Horizon
par10 <- as.numeric(par10) #Alpha
library(forecast)
if (par1 == 'CSV') {
xarr <- read.csv(file=paste('tmp/',par7,'.csv',sep=''),header=T)
numseries <- length(xarr[1,])-1
n <- length(xarr[,1])
nmh <- n - par9
nmhp1 <- nmh + 1
rarr <- array(NA,dim=c(n,numseries))
farr <- array(NA,dim=c(n,numseries))
parr <- array(NA,dim=c(numseries,8))
colnames(parr) = list('ME','RMSE','MAE','MPE','MAPE','MASE','ACF1','TheilU')
for(i in 1:numseries) {
sindex <- i+1
x <- xarr[,sindex]
if(par2=='Croston') {
if (i==1) m <- croston(x,alpha=par10)
if (i==1) mydemand <- m$model$demand[]
fit <- croston(x[1:nmh],h=par9,alpha=par10)
}
if(par2=='ARIMA') {
m <- auto.arima(ts(x,freq=par6),d=par3,D=par4)
mydemand <- forecast(m)
fit <- auto.arima(ts(x[1:nmh],freq=par6),d=par3,D=par4)
}
if(par2=='ETS') {
m <- ets(ts(x,freq=par6),model=par5)
mydemand <- forecast(m)
fit <- ets(ts(x[1:nmh],freq=par6),model=par5)
}
try(rarr[,i] <- mydemand$resid,silent=T)
try(farr[,i] <- mydemand$mean,silent=T)
if (par2!='Croston') parr[i,] <- accuracy(forecast(fit,par9),x[nmhp1:n])
if (par2=='Croston') parr[i,] <- accuracy(fit,x[nmhp1:n])
}
write.csv(farr,file=paste('tmp/',par8,'_f.csv',sep=''))
write.csv(rarr,file=paste('tmp/',par8,'_r.csv',sep=''))
write.csv(parr,file=paste('tmp/',par8,'_p.csv',sep=''))
}
if (par1 == 'Input box') {
numseries <- 1
n <- length(x)
if(par2=='Croston') {
m <- croston(x)
mydemand <- m$model$demand[]
}
if(par2=='ARIMA') {
m <- auto.arima(ts(x,freq=par6),d=par3,D=par4)
mydemand <- forecast(m)
}
if(par2=='ETS') {
m <- ets(ts(x,freq=par6),model=par5)
mydemand <- forecast(m)
}
summary(m)
}
bitmap(file='test1.png')
op <- par(mfrow=c(2,1))
if (par2=='Croston') plot(m)
if ((par2=='ARIMA') | par2=='ETS') plot(forecast(m))
plot(mydemand$resid,type='l',main='Residuals', ylab='residual value', xlab='time')
par(op)
dev.off()
bitmap(file='pic2.png')
op <- par(mfrow=c(2,2))
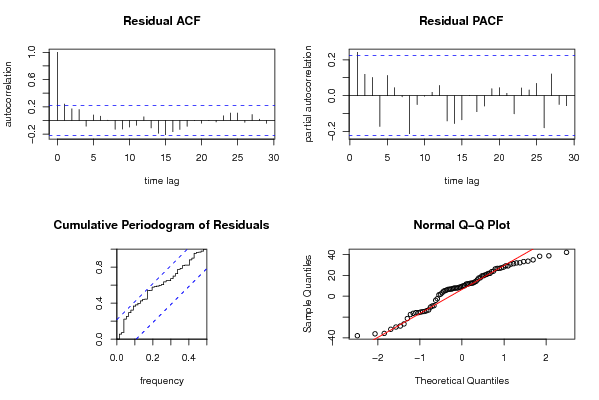
acf(mydemand$resid, lag.max=n/3, main='Residual ACF', ylab='autocorrelation', xlab='time lag')
pacf(mydemand$resid,lag.max=n/3, main='Residual PACF', ylab='partial autocorrelation', xlab='time lag')
cpgram(mydemand$resid, main='Cumulative Periodogram of Residuals')
qqnorm(mydemand$resid); qqline(mydemand$resid, col=2)
par(op)
dev.off()
load(file='createtable')
a<-table.start()
a<-table.row.start(a)
a<-table.element(a,'Demand Forecast',6,TRUE)
a<-table.row.end(a)
a<-table.row.start(a)
a<-table.element(a,'Point',header=TRUE)
a<-table.element(a,'Forecast',header=TRUE)
a<-table.element(a,'95% LB',header=TRUE)
a<-table.element(a,'80% LB',header=TRUE)
a<-table.element(a,'80% UB',header=TRUE)
a<-table.element(a,'95% UB',header=TRUE)
a<-table.row.end(a)
for (i in 1:length(mydemand$mean)) {
a<-table.row.start(a)
a<-table.element(a,i+n,header=TRUE)
a<-table.element(a,as.numeric(mydemand$mean[i]))
a<-table.element(a,as.numeric(mydemand$lower[i,2]))
a<-table.element(a,as.numeric(mydemand$lower[i,1]))
a<-table.element(a,as.numeric(mydemand$upper[i,1]))
a<-table.element(a,as.numeric(mydemand$upper[i,2]))
a<-table.row.end(a)
}
a<-table.end(a)
table.save(a,file='mytable.tab')
a<-table.start()
a<-table.row.start(a)
a<-table.element(a,'Actuals and Interpolation',3,TRUE)
a<-table.row.end(a)
a<-table.row.start(a)
a<-table.element(a,'Time',header=TRUE)
a<-table.element(a,'Actual',header=TRUE)
a<-table.element(a,'Forecast',header=TRUE)
a<-table.row.end(a)
for (i in 1:n) {
a<-table.row.start(a)
a<-table.element(a,i,header=TRUE)
a<-table.element(a,x[i])
a<-table.element(a,x[i] - as.numeric(m$resid[i]))
a<-table.row.end(a)
}
a<-table.end(a)
table.save(a,file='mytable1.tab')
a<-table.start()
a<-table.row.start(a)
a<-table.element(a,'What is next?',1,TRUE)
a<-table.row.end(a)
a<-table.row.start(a)
a<-table.element(a,hyperlink(paste('https://automated.biganalytics.eu/Patrick.Wessa/rwasp_demand_forecasting_simulate.wasp',sep=''),'Simulate Time Series','',target=''))
a<-table.row.end(a)
a<-table.row.start(a)
a<-table.element(a,hyperlink(paste('https://automated.biganalytics.eu/Patrick.Wessa/rwasp_demand_forecasting_croston.wasp#output',sep=''),'Generate Forecasts','',target=''))
a<-table.row.end(a)
a<-table.row.start(a)
a<-table.element(a,hyperlink(paste('https://automated.biganalytics.eu/Patrick.Wessa/rwasp_demand_forecasting_analysis.wasp',sep=''),'Forecast Analysis','',target=''))
a<-table.row.end(a)
a<-table.end(a)
table.save(a,file='mytable0.tab')
-SERVER-wessa.org