Free Statistics

of Irreproducible Research!

Author's title

Author*Unverified author*
R Software ModulePatrick.Wessarwasp_demand_forecasting_croston.wasp
Title produced by softwareCroston Forecasting
Date of computationMon, 26 Apr 2010 10:45:09 +0000
Cite this page as followsStatistical Computations at FreeStatistics.org, Office for Research Development and Education, URL https://freestatistics.org/blog/index.php?v=date/2010/Apr/26/t1272279143ujygsjwhsmxhdt5.htm/, Retrieved Thu, 25 Apr 2024 21:25:17 +0000
Statistical Computations at FreeStatistics.org, Office for Research Development and Education, URL https://freestatistics.org/blog/index.php?pk=74807, Retrieved Thu, 25 Apr 2024 21:25:17 +0000
QR Codes:

Original text written by user:
IsPrivate?No (this computation is public)
User-defined keywordsB382,steven,coomans,thesis,croston,permaand
Estimated Impact178
Family? (F = Feedback message, R = changed R code, M = changed R Module, P = changed Parameters, D = changed Data)
-       [Croston Forecasting] [B382,steven,cooma...] [2010-04-26 10:45:09] [d41d8cd98f00b204e9800998ecf8427e] [Current]
Feedback Forum

Post a new message
Dataseries X:
203,5
168,85
295,75
312,2
335,25
261,5
305,75
230
230
247,25
276,25
356,3
320,5
188,5
372,75
296
329,5
376,53
281,5
390
0
203,25
337
214,775
270
280
309,25
347
214,575
213,62
231,75
224,3
278
226,525
360,302
263,25
263,75
269,775
283,25
286,75
230,25
200,5
297,95
329,5
289,75
223,775
281,78
265,8
256,75
89,275
225,5
124,25
230
286,525
227
218,3
334,525
128,95
195,5
106,056
173,525
114,75
131,05
141,25
160,25
145,5
297,5
179,25
137
158,6
55,6
15,25
67,75
93
126,75
160
150,525
239,25
165,05
215,81
166
79,05
204,25
102
87,025
72,175
176,75
188,975


Summary of computational transaction
Raw Inputview raw input (R code)
Raw Outputview raw output of R engine
Computing time5 seconds
R Serverwessa.org @ wessa.org

\begin{tabular}{lllllllll}
\hline
Summary of computational transaction \tabularnewline
Raw Input & view raw input (R code)  \tabularnewline
Raw Output & view raw output of R engine  \tabularnewline
Computing time & 5 seconds \tabularnewline
R Server & wessa.org @ wessa.org \tabularnewline
\hline
\end{tabular}
%Source: https://freestatistics.org/blog/index.php?pk=74807&T=0

[TABLE]
[ROW][C]Summary of computational transaction[/C][/ROW]
[ROW][C]Raw Input[/C][C]view raw input (R code) [/C][/ROW]
[ROW][C]Raw Output[/C][C]view raw output of R engine [/C][/ROW]
[ROW][C]Computing time[/C][C]5 seconds[/C][/ROW]
[ROW][C]R Server[/C][C]wessa.org @ wessa.org[/C][/ROW]
[/TABLE]
Source: https://freestatistics.org/blog/index.php?pk=74807&T=0

Globally Unique Identifier (entire table): ba.freestatistics.org/blog/index.php?pk=74807&T=0

As an alternative you can also use a QR Code:  

The GUIDs for individual cells are displayed in the table below:

Summary of computational transaction
Raw Inputview raw input (R code)
Raw Outputview raw output of R engine
Computing time5 seconds
R Serverwessa.org @ wessa.org


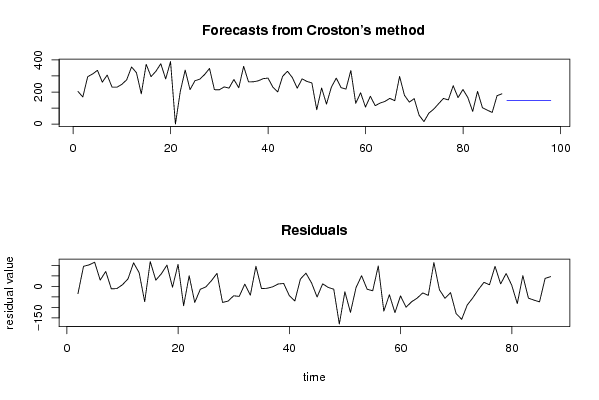
Demand Forecast
PointForecast95% LB80% LB80% UB95% UB
89146.88490073040014.464132796470860.2996145746596233.470186886139279.305668664328
90146.88490073040013.803675991469859.8677650819649233.902036378834279.966125469329
91146.88490073040013.146480761358359.4380482184607234.331753242338280.623320699441
92146.88490073040012.492499257631259.0104326976911234.759368763108281.277302203168
93146.88490073040011.841684790390758.584887990773235.184913470026281.928116670408
94146.88490073040011.193991789446658.1613843009606235.608417159838282.575809671352
95146.88490073040010.549375767079457.7398925392976236.029908921501283.220425693720
96146.8849007304009.9077932823803157.3203843013005236.449417159499283.862008178419
97146.8849007304009.2692019070882756.9028318446206236.866969616178284.500599553711
98146.8849007304008.6335601928465756.4872080676342237.282593393165285.136241267952

\begin{tabular}{lllllllll}
\hline
Demand Forecast \tabularnewline
Point & Forecast & 95% LB & 80% LB & 80% UB & 95% UB \tabularnewline
89 & 146.884900730400 & 14.4641327964708 & 60.2996145746596 & 233.470186886139 & 279.305668664328 \tabularnewline
90 & 146.884900730400 & 13.8036759914698 & 59.8677650819649 & 233.902036378834 & 279.966125469329 \tabularnewline
91 & 146.884900730400 & 13.1464807613583 & 59.4380482184607 & 234.331753242338 & 280.623320699441 \tabularnewline
92 & 146.884900730400 & 12.4924992576312 & 59.0104326976911 & 234.759368763108 & 281.277302203168 \tabularnewline
93 & 146.884900730400 & 11.8416847903907 & 58.584887990773 & 235.184913470026 & 281.928116670408 \tabularnewline
94 & 146.884900730400 & 11.1939917894466 & 58.1613843009606 & 235.608417159838 & 282.575809671352 \tabularnewline
95 & 146.884900730400 & 10.5493757670794 & 57.7398925392976 & 236.029908921501 & 283.220425693720 \tabularnewline
96 & 146.884900730400 & 9.90779328238031 & 57.3203843013005 & 236.449417159499 & 283.862008178419 \tabularnewline
97 & 146.884900730400 & 9.26920190708827 & 56.9028318446206 & 236.866969616178 & 284.500599553711 \tabularnewline
98 & 146.884900730400 & 8.63356019284657 & 56.4872080676342 & 237.282593393165 & 285.136241267952 \tabularnewline
\hline
\end{tabular}
%Source: https://freestatistics.org/blog/index.php?pk=74807&T=1

[TABLE]
[ROW][C]Demand Forecast[/C][/ROW]
[ROW][C]Point[/C][C]Forecast[/C][C]95% LB[/C][C]80% LB[/C][C]80% UB[/C][C]95% UB[/C][/ROW]
[ROW][C]89[/C][C]146.884900730400[/C][C]14.4641327964708[/C][C]60.2996145746596[/C][C]233.470186886139[/C][C]279.305668664328[/C][/ROW]
[ROW][C]90[/C][C]146.884900730400[/C][C]13.8036759914698[/C][C]59.8677650819649[/C][C]233.902036378834[/C][C]279.966125469329[/C][/ROW]
[ROW][C]91[/C][C]146.884900730400[/C][C]13.1464807613583[/C][C]59.4380482184607[/C][C]234.331753242338[/C][C]280.623320699441[/C][/ROW]
[ROW][C]92[/C][C]146.884900730400[/C][C]12.4924992576312[/C][C]59.0104326976911[/C][C]234.759368763108[/C][C]281.277302203168[/C][/ROW]
[ROW][C]93[/C][C]146.884900730400[/C][C]11.8416847903907[/C][C]58.584887990773[/C][C]235.184913470026[/C][C]281.928116670408[/C][/ROW]
[ROW][C]94[/C][C]146.884900730400[/C][C]11.1939917894466[/C][C]58.1613843009606[/C][C]235.608417159838[/C][C]282.575809671352[/C][/ROW]
[ROW][C]95[/C][C]146.884900730400[/C][C]10.5493757670794[/C][C]57.7398925392976[/C][C]236.029908921501[/C][C]283.220425693720[/C][/ROW]
[ROW][C]96[/C][C]146.884900730400[/C][C]9.90779328238031[/C][C]57.3203843013005[/C][C]236.449417159499[/C][C]283.862008178419[/C][/ROW]
[ROW][C]97[/C][C]146.884900730400[/C][C]9.26920190708827[/C][C]56.9028318446206[/C][C]236.866969616178[/C][C]284.500599553711[/C][/ROW]
[ROW][C]98[/C][C]146.884900730400[/C][C]8.63356019284657[/C][C]56.4872080676342[/C][C]237.282593393165[/C][C]285.136241267952[/C][/ROW]
[/TABLE]
Source: https://freestatistics.org/blog/index.php?pk=74807&T=1

Globally Unique Identifier (entire table): ba.freestatistics.org/blog/index.php?pk=74807&T=1

As an alternative you can also use a QR Code:  

The GUIDs for individual cells are displayed in the table below:

Demand Forecast
PointForecast95% LB80% LB80% UB95% UB
89146.88490073040014.464132796470860.2996145746596233.470186886139279.305668664328
90146.88490073040013.803675991469859.8677650819649233.902036378834279.966125469329
91146.88490073040013.146480761358359.4380482184607234.331753242338280.623320699441
92146.88490073040012.492499257631259.0104326976911234.759368763108281.277302203168
93146.88490073040011.841684790390758.584887990773235.184913470026281.928116670408
94146.88490073040011.193991789446658.1613843009606235.608417159838282.575809671352
95146.88490073040010.549375767079457.7398925392976236.029908921501283.220425693720
96146.8849007304009.9077932823803157.3203843013005236.449417159499283.862008178419
97146.8849007304009.2692019070882756.9028318446206236.866969616178284.500599553711
98146.8849007304008.6335601928465756.4872080676342237.282593393165285.136241267952


Actuals and Interpolation
TimeActualForecast
1203.5NA
2168.85203.5
3295.75200.035
4312.2209.6065
5335.25219.86585
6261.5231.404265
7305.75234.4138385
8230241.54745465
9230240.392709185
10247.25239.3534382665
11276.25240.14309443985
12356.3243.753784995865
13320.5255.008406496279
14188.5261.557565846651
15372.75254.251809261986
16296266.101628335787
17329.5269.091465502208
18376.53275.132318951987
19281.5285.272087056789
20390284.89487835111
210295.405390515999
22203.25295.405390515999
23337260.172592240363
24214.775267.220978273357
25270262.369361411807
26280263.080577609793
27309.25264.668346342275
28347268.877939444929
29214.575276.295923418354
30213.62270.405565089382
31231.75264.961363602901
32224.3261.764095942650
33278258.143914277958
34226.525260.069108224177
35360.302256.806833670759
36263.25266.899800625593
37263.75266.542983396723
38269.775266.269319552912
39283.25266.613509684986
40286.75268.249868857245
41230.25270.072524882384
42200.5266.14334972426
43297.95259.657863128208
44329.5263.445631437441
45289.75269.986654204779
46223.775271.945626533771
47281.78267.166683806695
48265.8268.617599332661
49256.75268.337648186674
5089.275267.185582599100
51225.5249.487148674218
52124.25247.099679095772
53230234.866568757848
54286.525234.381761520692
55227239.57824229666
56218.3238.324293165353
57334.525236.327417726316
58128.95246.122656946707
59195.5234.431729041526
60106.056230.546433790912
61173.525218.120066052183
62114.75213.667871376779
63131.05203.790683594741
64141.25196.526278923624
65160.25191.005261078259
66145.5187.933045363869
67297.5183.693851885952
68179.25195.064542400102
69137193.484329443792
70158.6187.839886922996
7155.6184.917757489737
7215.25171.993382776537
7367.75156.327118539305
7493147.473513339562
75126.75142.028435085060
76160140.501165387377
77150.525142.450389739493
78239.25143.257605109507
79165.05152.854216156414
80215.81154.073493984556
81166160.245775246224
8279.05160.821082851191
83204.25152.645443736842
84102157.805064892845
8587.025152.225370571782
8672.175145.706187540951
87176.75138.353935630926
88188.975142.193134684045

\begin{tabular}{lllllllll}
\hline
Actuals and Interpolation \tabularnewline
Time & Actual & Forecast \tabularnewline
1 & 203.5 & NA \tabularnewline
2 & 168.85 & 203.5 \tabularnewline
3 & 295.75 & 200.035 \tabularnewline
4 & 312.2 & 209.6065 \tabularnewline
5 & 335.25 & 219.86585 \tabularnewline
6 & 261.5 & 231.404265 \tabularnewline
7 & 305.75 & 234.4138385 \tabularnewline
8 & 230 & 241.54745465 \tabularnewline
9 & 230 & 240.392709185 \tabularnewline
10 & 247.25 & 239.3534382665 \tabularnewline
11 & 276.25 & 240.14309443985 \tabularnewline
12 & 356.3 & 243.753784995865 \tabularnewline
13 & 320.5 & 255.008406496279 \tabularnewline
14 & 188.5 & 261.557565846651 \tabularnewline
15 & 372.75 & 254.251809261986 \tabularnewline
16 & 296 & 266.101628335787 \tabularnewline
17 & 329.5 & 269.091465502208 \tabularnewline
18 & 376.53 & 275.132318951987 \tabularnewline
19 & 281.5 & 285.272087056789 \tabularnewline
20 & 390 & 284.89487835111 \tabularnewline
21 & 0 & 295.405390515999 \tabularnewline
22 & 203.25 & 295.405390515999 \tabularnewline
23 & 337 & 260.172592240363 \tabularnewline
24 & 214.775 & 267.220978273357 \tabularnewline
25 & 270 & 262.369361411807 \tabularnewline
26 & 280 & 263.080577609793 \tabularnewline
27 & 309.25 & 264.668346342275 \tabularnewline
28 & 347 & 268.877939444929 \tabularnewline
29 & 214.575 & 276.295923418354 \tabularnewline
30 & 213.62 & 270.405565089382 \tabularnewline
31 & 231.75 & 264.961363602901 \tabularnewline
32 & 224.3 & 261.764095942650 \tabularnewline
33 & 278 & 258.143914277958 \tabularnewline
34 & 226.525 & 260.069108224177 \tabularnewline
35 & 360.302 & 256.806833670759 \tabularnewline
36 & 263.25 & 266.899800625593 \tabularnewline
37 & 263.75 & 266.542983396723 \tabularnewline
38 & 269.775 & 266.269319552912 \tabularnewline
39 & 283.25 & 266.613509684986 \tabularnewline
40 & 286.75 & 268.249868857245 \tabularnewline
41 & 230.25 & 270.072524882384 \tabularnewline
42 & 200.5 & 266.14334972426 \tabularnewline
43 & 297.95 & 259.657863128208 \tabularnewline
44 & 329.5 & 263.445631437441 \tabularnewline
45 & 289.75 & 269.986654204779 \tabularnewline
46 & 223.775 & 271.945626533771 \tabularnewline
47 & 281.78 & 267.166683806695 \tabularnewline
48 & 265.8 & 268.617599332661 \tabularnewline
49 & 256.75 & 268.337648186674 \tabularnewline
50 & 89.275 & 267.185582599100 \tabularnewline
51 & 225.5 & 249.487148674218 \tabularnewline
52 & 124.25 & 247.099679095772 \tabularnewline
53 & 230 & 234.866568757848 \tabularnewline
54 & 286.525 & 234.381761520692 \tabularnewline
55 & 227 & 239.57824229666 \tabularnewline
56 & 218.3 & 238.324293165353 \tabularnewline
57 & 334.525 & 236.327417726316 \tabularnewline
58 & 128.95 & 246.122656946707 \tabularnewline
59 & 195.5 & 234.431729041526 \tabularnewline
60 & 106.056 & 230.546433790912 \tabularnewline
61 & 173.525 & 218.120066052183 \tabularnewline
62 & 114.75 & 213.667871376779 \tabularnewline
63 & 131.05 & 203.790683594741 \tabularnewline
64 & 141.25 & 196.526278923624 \tabularnewline
65 & 160.25 & 191.005261078259 \tabularnewline
66 & 145.5 & 187.933045363869 \tabularnewline
67 & 297.5 & 183.693851885952 \tabularnewline
68 & 179.25 & 195.064542400102 \tabularnewline
69 & 137 & 193.484329443792 \tabularnewline
70 & 158.6 & 187.839886922996 \tabularnewline
71 & 55.6 & 184.917757489737 \tabularnewline
72 & 15.25 & 171.993382776537 \tabularnewline
73 & 67.75 & 156.327118539305 \tabularnewline
74 & 93 & 147.473513339562 \tabularnewline
75 & 126.75 & 142.028435085060 \tabularnewline
76 & 160 & 140.501165387377 \tabularnewline
77 & 150.525 & 142.450389739493 \tabularnewline
78 & 239.25 & 143.257605109507 \tabularnewline
79 & 165.05 & 152.854216156414 \tabularnewline
80 & 215.81 & 154.073493984556 \tabularnewline
81 & 166 & 160.245775246224 \tabularnewline
82 & 79.05 & 160.821082851191 \tabularnewline
83 & 204.25 & 152.645443736842 \tabularnewline
84 & 102 & 157.805064892845 \tabularnewline
85 & 87.025 & 152.225370571782 \tabularnewline
86 & 72.175 & 145.706187540951 \tabularnewline
87 & 176.75 & 138.353935630926 \tabularnewline
88 & 188.975 & 142.193134684045 \tabularnewline
\hline
\end{tabular}
%Source: https://freestatistics.org/blog/index.php?pk=74807&T=2

[TABLE]
[ROW][C]Actuals and Interpolation[/C][/ROW]
[ROW][C]Time[/C][C]Actual[/C][C]Forecast[/C][/ROW]
[ROW][C]1[/C][C]203.5[/C][C]NA[/C][/ROW]
[ROW][C]2[/C][C]168.85[/C][C]203.5[/C][/ROW]
[ROW][C]3[/C][C]295.75[/C][C]200.035[/C][/ROW]
[ROW][C]4[/C][C]312.2[/C][C]209.6065[/C][/ROW]
[ROW][C]5[/C][C]335.25[/C][C]219.86585[/C][/ROW]
[ROW][C]6[/C][C]261.5[/C][C]231.404265[/C][/ROW]
[ROW][C]7[/C][C]305.75[/C][C]234.4138385[/C][/ROW]
[ROW][C]8[/C][C]230[/C][C]241.54745465[/C][/ROW]
[ROW][C]9[/C][C]230[/C][C]240.392709185[/C][/ROW]
[ROW][C]10[/C][C]247.25[/C][C]239.3534382665[/C][/ROW]
[ROW][C]11[/C][C]276.25[/C][C]240.14309443985[/C][/ROW]
[ROW][C]12[/C][C]356.3[/C][C]243.753784995865[/C][/ROW]
[ROW][C]13[/C][C]320.5[/C][C]255.008406496279[/C][/ROW]
[ROW][C]14[/C][C]188.5[/C][C]261.557565846651[/C][/ROW]
[ROW][C]15[/C][C]372.75[/C][C]254.251809261986[/C][/ROW]
[ROW][C]16[/C][C]296[/C][C]266.101628335787[/C][/ROW]
[ROW][C]17[/C][C]329.5[/C][C]269.091465502208[/C][/ROW]
[ROW][C]18[/C][C]376.53[/C][C]275.132318951987[/C][/ROW]
[ROW][C]19[/C][C]281.5[/C][C]285.272087056789[/C][/ROW]
[ROW][C]20[/C][C]390[/C][C]284.89487835111[/C][/ROW]
[ROW][C]21[/C][C]0[/C][C]295.405390515999[/C][/ROW]
[ROW][C]22[/C][C]203.25[/C][C]295.405390515999[/C][/ROW]
[ROW][C]23[/C][C]337[/C][C]260.172592240363[/C][/ROW]
[ROW][C]24[/C][C]214.775[/C][C]267.220978273357[/C][/ROW]
[ROW][C]25[/C][C]270[/C][C]262.369361411807[/C][/ROW]
[ROW][C]26[/C][C]280[/C][C]263.080577609793[/C][/ROW]
[ROW][C]27[/C][C]309.25[/C][C]264.668346342275[/C][/ROW]
[ROW][C]28[/C][C]347[/C][C]268.877939444929[/C][/ROW]
[ROW][C]29[/C][C]214.575[/C][C]276.295923418354[/C][/ROW]
[ROW][C]30[/C][C]213.62[/C][C]270.405565089382[/C][/ROW]
[ROW][C]31[/C][C]231.75[/C][C]264.961363602901[/C][/ROW]
[ROW][C]32[/C][C]224.3[/C][C]261.764095942650[/C][/ROW]
[ROW][C]33[/C][C]278[/C][C]258.143914277958[/C][/ROW]
[ROW][C]34[/C][C]226.525[/C][C]260.069108224177[/C][/ROW]
[ROW][C]35[/C][C]360.302[/C][C]256.806833670759[/C][/ROW]
[ROW][C]36[/C][C]263.25[/C][C]266.899800625593[/C][/ROW]
[ROW][C]37[/C][C]263.75[/C][C]266.542983396723[/C][/ROW]
[ROW][C]38[/C][C]269.775[/C][C]266.269319552912[/C][/ROW]
[ROW][C]39[/C][C]283.25[/C][C]266.613509684986[/C][/ROW]
[ROW][C]40[/C][C]286.75[/C][C]268.249868857245[/C][/ROW]
[ROW][C]41[/C][C]230.25[/C][C]270.072524882384[/C][/ROW]
[ROW][C]42[/C][C]200.5[/C][C]266.14334972426[/C][/ROW]
[ROW][C]43[/C][C]297.95[/C][C]259.657863128208[/C][/ROW]
[ROW][C]44[/C][C]329.5[/C][C]263.445631437441[/C][/ROW]
[ROW][C]45[/C][C]289.75[/C][C]269.986654204779[/C][/ROW]
[ROW][C]46[/C][C]223.775[/C][C]271.945626533771[/C][/ROW]
[ROW][C]47[/C][C]281.78[/C][C]267.166683806695[/C][/ROW]
[ROW][C]48[/C][C]265.8[/C][C]268.617599332661[/C][/ROW]
[ROW][C]49[/C][C]256.75[/C][C]268.337648186674[/C][/ROW]
[ROW][C]50[/C][C]89.275[/C][C]267.185582599100[/C][/ROW]
[ROW][C]51[/C][C]225.5[/C][C]249.487148674218[/C][/ROW]
[ROW][C]52[/C][C]124.25[/C][C]247.099679095772[/C][/ROW]
[ROW][C]53[/C][C]230[/C][C]234.866568757848[/C][/ROW]
[ROW][C]54[/C][C]286.525[/C][C]234.381761520692[/C][/ROW]
[ROW][C]55[/C][C]227[/C][C]239.57824229666[/C][/ROW]
[ROW][C]56[/C][C]218.3[/C][C]238.324293165353[/C][/ROW]
[ROW][C]57[/C][C]334.525[/C][C]236.327417726316[/C][/ROW]
[ROW][C]58[/C][C]128.95[/C][C]246.122656946707[/C][/ROW]
[ROW][C]59[/C][C]195.5[/C][C]234.431729041526[/C][/ROW]
[ROW][C]60[/C][C]106.056[/C][C]230.546433790912[/C][/ROW]
[ROW][C]61[/C][C]173.525[/C][C]218.120066052183[/C][/ROW]
[ROW][C]62[/C][C]114.75[/C][C]213.667871376779[/C][/ROW]
[ROW][C]63[/C][C]131.05[/C][C]203.790683594741[/C][/ROW]
[ROW][C]64[/C][C]141.25[/C][C]196.526278923624[/C][/ROW]
[ROW][C]65[/C][C]160.25[/C][C]191.005261078259[/C][/ROW]
[ROW][C]66[/C][C]145.5[/C][C]187.933045363869[/C][/ROW]
[ROW][C]67[/C][C]297.5[/C][C]183.693851885952[/C][/ROW]
[ROW][C]68[/C][C]179.25[/C][C]195.064542400102[/C][/ROW]
[ROW][C]69[/C][C]137[/C][C]193.484329443792[/C][/ROW]
[ROW][C]70[/C][C]158.6[/C][C]187.839886922996[/C][/ROW]
[ROW][C]71[/C][C]55.6[/C][C]184.917757489737[/C][/ROW]
[ROW][C]72[/C][C]15.25[/C][C]171.993382776537[/C][/ROW]
[ROW][C]73[/C][C]67.75[/C][C]156.327118539305[/C][/ROW]
[ROW][C]74[/C][C]93[/C][C]147.473513339562[/C][/ROW]
[ROW][C]75[/C][C]126.75[/C][C]142.028435085060[/C][/ROW]
[ROW][C]76[/C][C]160[/C][C]140.501165387377[/C][/ROW]
[ROW][C]77[/C][C]150.525[/C][C]142.450389739493[/C][/ROW]
[ROW][C]78[/C][C]239.25[/C][C]143.257605109507[/C][/ROW]
[ROW][C]79[/C][C]165.05[/C][C]152.854216156414[/C][/ROW]
[ROW][C]80[/C][C]215.81[/C][C]154.073493984556[/C][/ROW]
[ROW][C]81[/C][C]166[/C][C]160.245775246224[/C][/ROW]
[ROW][C]82[/C][C]79.05[/C][C]160.821082851191[/C][/ROW]
[ROW][C]83[/C][C]204.25[/C][C]152.645443736842[/C][/ROW]
[ROW][C]84[/C][C]102[/C][C]157.805064892845[/C][/ROW]
[ROW][C]85[/C][C]87.025[/C][C]152.225370571782[/C][/ROW]
[ROW][C]86[/C][C]72.175[/C][C]145.706187540951[/C][/ROW]
[ROW][C]87[/C][C]176.75[/C][C]138.353935630926[/C][/ROW]
[ROW][C]88[/C][C]188.975[/C][C]142.193134684045[/C][/ROW]
[/TABLE]
Source: https://freestatistics.org/blog/index.php?pk=74807&T=2

Globally Unique Identifier (entire table): ba.freestatistics.org/blog/index.php?pk=74807&T=2

As an alternative you can also use a QR Code:  

The GUIDs for individual cells are displayed in the table below:

Actuals and Interpolation
TimeActualForecast
1203.5NA
2168.85203.5
3295.75200.035
4312.2209.6065
5335.25219.86585
6261.5231.404265
7305.75234.4138385
8230241.54745465
9230240.392709185
10247.25239.3534382665
11276.25240.14309443985
12356.3243.753784995865
13320.5255.008406496279
14188.5261.557565846651
15372.75254.251809261986
16296266.101628335787
17329.5269.091465502208
18376.53275.132318951987
19281.5285.272087056789
20390284.89487835111
210295.405390515999
22203.25295.405390515999
23337260.172592240363
24214.775267.220978273357
25270262.369361411807
26280263.080577609793
27309.25264.668346342275
28347268.877939444929
29214.575276.295923418354
30213.62270.405565089382
31231.75264.961363602901
32224.3261.764095942650
33278258.143914277958
34226.525260.069108224177
35360.302256.806833670759
36263.25266.899800625593
37263.75266.542983396723
38269.775266.269319552912
39283.25266.613509684986
40286.75268.249868857245
41230.25270.072524882384
42200.5266.14334972426
43297.95259.657863128208
44329.5263.445631437441
45289.75269.986654204779
46223.775271.945626533771
47281.78267.166683806695
48265.8268.617599332661
49256.75268.337648186674
5089.275267.185582599100
51225.5249.487148674218
52124.25247.099679095772
53230234.866568757848
54286.525234.381761520692
55227239.57824229666
56218.3238.324293165353
57334.525236.327417726316
58128.95246.122656946707
59195.5234.431729041526
60106.056230.546433790912
61173.525218.120066052183
62114.75213.667871376779
63131.05203.790683594741
64141.25196.526278923624
65160.25191.005261078259
66145.5187.933045363869
67297.5183.693851885952
68179.25195.064542400102
69137193.484329443792
70158.6187.839886922996
7155.6184.917757489737
7215.25171.993382776537
7367.75156.327118539305
7493147.473513339562
75126.75142.028435085060
76160140.501165387377
77150.525142.450389739493
78239.25143.257605109507
79165.05152.854216156414
80215.81154.073493984556
81166160.245775246224
8279.05160.821082851191
83204.25152.645443736842
84102157.805064892845
8587.025152.225370571782
8672.175145.706187540951
87176.75138.353935630926
88188.975142.193134684045


\begin{tabular}{lllllllll}
\hline
What is next? \tabularnewline
Simulate Time Series \tabularnewline
Generate Forecasts \tabularnewline
Forecast Analysis \tabularnewline
\hline
\end{tabular}
%Source: https://freestatistics.org/blog/index.php?pk=74807&T=3

[TABLE]
[ROW][C]What is next?[/C][/ROW]
[ROW][C]Simulate Time Series[/C][/ROW]
[ROW][C]Generate Forecasts[/C][/ROW]
[ROW][C]Forecast Analysis[/C][/ROW]
[/TABLE]
Source: https://freestatistics.org/blog/index.php?pk=74807&T=3

Globally Unique Identifier (entire table): ba.freestatistics.org/blog/index.php?pk=74807&T=3

As an alternative you can also use a QR Code:  

The GUIDs for individual cells are displayed in the table below:

What is next?
Simulate Time Series
Generate Forecasts
Forecast Analysis


Parameters (Session):
par1 = Input box ; par2 = Croston ; par3 = NA ; par4 = NA ; par5 = ZZZ ; par6 = 12 ; par7 = dum ; par8 = B382crostonm ; par9 = 3 ; par10 = 0.1 ;
Parameters (R input):
par1 = Input box ; par2 = Croston ; par3 = NA ; par4 = NA ; par5 = ZZZ ; par6 = 12 ; par7 = dum ; par8 = B382crostonm ; par9 = 3 ; par10 = 0.1 ;
R code (references can be found in the software module):
if(par3!='NA') par3 <- as.numeric(par3) else par3 <- NA
if(par4!='NA') par4 <- as.numeric(par4) else par4 <- NA
par6 <- as.numeric(par6) #Seasonal Period
par9 <- as.numeric(par9) #Forecast Horizon
par10 <- as.numeric(par10) #Alpha
library(forecast)
if (par1 == 'CSV') {
xarr <- read.csv(file=paste('tmp/',par7,'.csv',sep=''),header=T)
numseries <- length(xarr[1,])-1
n <- length(xarr[,1])
nmh <- n - par9
nmhp1 <- nmh + 1
rarr <- array(NA,dim=c(n,numseries))
farr <- array(NA,dim=c(n,numseries))
parr <- array(NA,dim=c(numseries,8))
colnames(parr) = list('ME','RMSE','MAE','MPE','MAPE','MASE','ACF1','TheilU')
for(i in 1:numseries) {
sindex <- i+1
x <- xarr[,sindex]
if(par2=='Croston') {
if (i==1) m <- croston(x,alpha=par10)
if (i==1) mydemand <- m$model$demand[]
fit <- croston(x[1:nmh],h=par9,alpha=par10)
}
if(par2=='ARIMA') {
m <- auto.arima(ts(x,freq=par6),d=par3,D=par4)
mydemand <- forecast(m)
fit <- auto.arima(ts(x[1:nmh],freq=par6),d=par3,D=par4)
}
if(par2=='ETS') {
m <- ets(ts(x,freq=par6),model=par5)
mydemand <- forecast(m)
fit <- ets(ts(x[1:nmh],freq=par6),model=par5)
}
try(rarr[,i] <- mydemand$resid,silent=T)
try(farr[,i] <- mydemand$mean,silent=T)
if (par2!='Croston') parr[i,] <- accuracy(forecast(fit,par9),x[nmhp1:n])
if (par2=='Croston') parr[i,] <- accuracy(fit,x[nmhp1:n])
}
write.csv(farr,file=paste('tmp/',par8,'_f.csv',sep=''))
write.csv(rarr,file=paste('tmp/',par8,'_r.csv',sep=''))
write.csv(parr,file=paste('tmp/',par8,'_p.csv',sep=''))
}
if (par1 == 'Input box') {
numseries <- 1
n <- length(x)
if(par2=='Croston') {
m <- croston(x)
mydemand <- m$model$demand[]
}
if(par2=='ARIMA') {
m <- auto.arima(ts(x,freq=par6),d=par3,D=par4)
mydemand <- forecast(m)
}
if(par2=='ETS') {
m <- ets(ts(x,freq=par6),model=par5)
mydemand <- forecast(m)
}
summary(m)
}
bitmap(file='test1.png')
op <- par(mfrow=c(2,1))
if (par2=='Croston') plot(m)
if ((par2=='ARIMA') | par2=='ETS') plot(forecast(m))
plot(mydemand$resid,type='l',main='Residuals', ylab='residual value', xlab='time')
par(op)
dev.off()
bitmap(file='pic2.png')
op <- par(mfrow=c(2,2))
acf(mydemand$resid, lag.max=n/3, main='Residual ACF', ylab='autocorrelation', xlab='time lag')
pacf(mydemand$resid,lag.max=n/3, main='Residual PACF', ylab='partial autocorrelation', xlab='time lag')
cpgram(mydemand$resid, main='Cumulative Periodogram of Residuals')
qqnorm(mydemand$resid); qqline(mydemand$resid, col=2)
par(op)
dev.off()
load(file='createtable')
a<-table.start()
a<-table.row.start(a)
a<-table.element(a,'Demand Forecast',6,TRUE)
a<-table.row.end(a)
a<-table.row.start(a)
a<-table.element(a,'Point',header=TRUE)
a<-table.element(a,'Forecast',header=TRUE)
a<-table.element(a,'95% LB',header=TRUE)
a<-table.element(a,'80% LB',header=TRUE)
a<-table.element(a,'80% UB',header=TRUE)
a<-table.element(a,'95% UB',header=TRUE)
a<-table.row.end(a)
for (i in 1:length(mydemand$mean)) {
a<-table.row.start(a)
a<-table.element(a,i+n,header=TRUE)
a<-table.element(a,as.numeric(mydemand$mean[i]))
a<-table.element(a,as.numeric(mydemand$lower[i,2]))
a<-table.element(a,as.numeric(mydemand$lower[i,1]))
a<-table.element(a,as.numeric(mydemand$upper[i,1]))
a<-table.element(a,as.numeric(mydemand$upper[i,2]))
a<-table.row.end(a)
}
a<-table.end(a)
table.save(a,file='mytable.tab')
a<-table.start()
a<-table.row.start(a)
a<-table.element(a,'Actuals and Interpolation',3,TRUE)
a<-table.row.end(a)
a<-table.row.start(a)
a<-table.element(a,'Time',header=TRUE)
a<-table.element(a,'Actual',header=TRUE)
a<-table.element(a,'Forecast',header=TRUE)
a<-table.row.end(a)
for (i in 1:n) {
a<-table.row.start(a)
a<-table.element(a,i,header=TRUE)
a<-table.element(a,x[i])
a<-table.element(a,x[i] - as.numeric(m$resid[i]))
a<-table.row.end(a)
}
a<-table.end(a)
table.save(a,file='mytable1.tab')
a<-table.start()
a<-table.row.start(a)
a<-table.element(a,'What is next?',1,TRUE)
a<-table.row.end(a)
a<-table.row.start(a)
a<-table.element(a,hyperlink(paste('https://automated.biganalytics.eu/Patrick.Wessa/rwasp_demand_forecasting_simulate.wasp',sep=''),'Simulate Time Series','',target=''))
a<-table.row.end(a)
a<-table.row.start(a)
a<-table.element(a,hyperlink(paste('https://automated.biganalytics.eu/Patrick.Wessa/rwasp_demand_forecasting_croston.wasp#output',sep=''),'Generate Forecasts','',target=''))
a<-table.row.end(a)
a<-table.row.start(a)
a<-table.element(a,hyperlink(paste('https://automated.biganalytics.eu/Patrick.Wessa/rwasp_demand_forecasting_analysis.wasp',sep=''),'Forecast Analysis','',target=''))
a<-table.row.end(a)
a<-table.end(a)
table.save(a,file='mytable0.tab')
-SERVER-wessa.org