Free Statistics

of Irreproducible Research!

Author's title

Author*Unverified author*
R Software ModulePatrick.Wessarwasp_demand_forecasting_croston.wasp
Title produced by softwareCroston Forecasting
Date of computationMon, 26 Apr 2010 10:32:28 +0000
Cite this page as followsStatistical Computations at FreeStatistics.org, Office for Research Development and Education, URL https://freestatistics.org/blog/index.php?v=date/2010/Apr/26/t1272278403trvawrpx09un5jv.htm/, Retrieved Fri, 26 Apr 2024 15:14:10 +0000
Statistical Computations at FreeStatistics.org, Office for Research Development and Education, URL https://freestatistics.org/blog/index.php?pk=74806, Retrieved Fri, 26 Apr 2024 15:14:10 +0000
QR Codes:

Original text written by user:
IsPrivate?No (this computation is public)
User-defined keywordsB28A,steven, coomans, thesis, croston,forecast,per maand
Estimated Impact174
Family? (F = Feedback message, R = changed R code, M = changed R Module, P = changed Parameters, D = changed Data)
-       [Croston Forecasting] [B28A,steven, coom...] [2010-04-26 10:32:28] [d41d8cd98f00b204e9800998ecf8427e] [Current]
Feedback Forum

Post a new message
Dataseries X:
647,5
174
781
277,1
653
435,75
613,775
509,75
509,75
314,5
486
212
503,825
435
563
457,05
451,25
500,75
437,75
470,5
0
313,25
314
454
570,5
485
243
310
421,752
494,5
253,5
417,5
182,826
339,25
199
412,25
438,25
356
266,25
235,25
323,775
305,25
383,527
515,25
496,15
115,25
170,5
154,25
170
534,05
193,75
564,5
346
308,25
437,05
410,275
149,75
154,75
240,1
127,525
222,25
85,525
427,75
63,5
118,3
99,5
182,25
401
119,5
450,25
147,5
237
80,025
10,5
176,75
234
282,5
320
167,5
163,25
238,15
325,125
126,3
154,875
327,25
336,25
188
277,25


Summary of computational transaction
Raw Inputview raw input (R code)
Raw Outputview raw output of R engine
Computing time6 seconds
R Serverwessa.org @ wessa.org

\begin{tabular}{lllllllll}
\hline
Summary of computational transaction \tabularnewline
Raw Input & view raw input (R code)  \tabularnewline
Raw Output & view raw output of R engine  \tabularnewline
Computing time & 6 seconds \tabularnewline
R Server & wessa.org @ wessa.org \tabularnewline
\hline
\end{tabular}
%Source: https://freestatistics.org/blog/index.php?pk=74806&T=0

[TABLE]
[ROW][C]Summary of computational transaction[/C][/ROW]
[ROW][C]Raw Input[/C][C]view raw input (R code) [/C][/ROW]
[ROW][C]Raw Output[/C][C]view raw output of R engine [/C][/ROW]
[ROW][C]Computing time[/C][C]6 seconds[/C][/ROW]
[ROW][C]R Server[/C][C]wessa.org @ wessa.org[/C][/ROW]
[/TABLE]
Source: https://freestatistics.org/blog/index.php?pk=74806&T=0

Globally Unique Identifier (entire table): ba.freestatistics.org/blog/index.php?pk=74806&T=0

As an alternative you can also use a QR Code:  

The GUIDs for individual cells are displayed in the table below:

Summary of computational transaction
Raw Inputview raw input (R code)
Raw Outputview raw output of R engine
Computing time6 seconds
R Serverwessa.org @ wessa.org


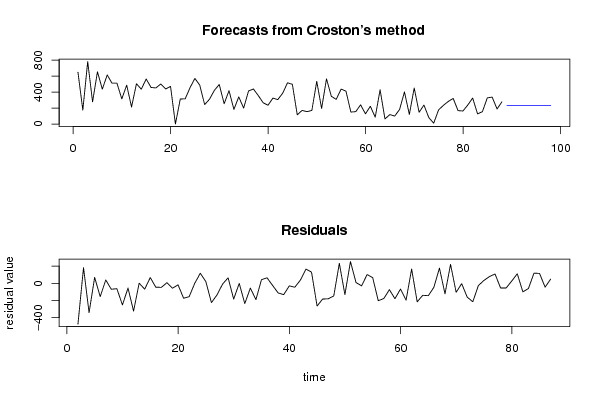
Demand Forecast
PointForecast95% LB80% LB80% UB95% UB
89233.208640990627-35.109488442298157.7648463336253408.652435647628501.526770423552
90233.208640990627-36.447741778644556.8898095105928409.527472470661502.865023759898
91233.208640990627-37.779386335363256.0190939362899410.398188044964504.196668316617
92233.208640990627-39.104519065686655.1526362164054411.264645764848505.52180104694
93233.208640990627-40.423234575212954.2903744916635412.12690748959506.840516556467
94233.208640990627-41.735625200728853.4322483862848412.985033594969508.152907181983
95233.208640990627-43.041781085660552.5781989586509413.839083022603509.459063066914
96233.208640990627-44.34179025232951.7281686540597414.689113327194510.759072233583
97233.208640990627-45.63573867117450.8821012594622415.535180721792512.053020652428
98233.208640990627-46.923710327100150.0399418600809416.377340121173513.340992308354

\begin{tabular}{lllllllll}
\hline
Demand Forecast \tabularnewline
Point & Forecast & 95% LB & 80% LB & 80% UB & 95% UB \tabularnewline
89 & 233.208640990627 & -35.1094884422981 & 57.7648463336253 & 408.652435647628 & 501.526770423552 \tabularnewline
90 & 233.208640990627 & -36.4477417786445 & 56.8898095105928 & 409.527472470661 & 502.865023759898 \tabularnewline
91 & 233.208640990627 & -37.7793863353632 & 56.0190939362899 & 410.398188044964 & 504.196668316617 \tabularnewline
92 & 233.208640990627 & -39.1045190656866 & 55.1526362164054 & 411.264645764848 & 505.52180104694 \tabularnewline
93 & 233.208640990627 & -40.4232345752129 & 54.2903744916635 & 412.12690748959 & 506.840516556467 \tabularnewline
94 & 233.208640990627 & -41.7356252007288 & 53.4322483862848 & 412.985033594969 & 508.152907181983 \tabularnewline
95 & 233.208640990627 & -43.0417810856605 & 52.5781989586509 & 413.839083022603 & 509.459063066914 \tabularnewline
96 & 233.208640990627 & -44.341790252329 & 51.7281686540597 & 414.689113327194 & 510.759072233583 \tabularnewline
97 & 233.208640990627 & -45.635738671174 & 50.8821012594622 & 415.535180721792 & 512.053020652428 \tabularnewline
98 & 233.208640990627 & -46.9237103271001 & 50.0399418600809 & 416.377340121173 & 513.340992308354 \tabularnewline
\hline
\end{tabular}
%Source: https://freestatistics.org/blog/index.php?pk=74806&T=1

[TABLE]
[ROW][C]Demand Forecast[/C][/ROW]
[ROW][C]Point[/C][C]Forecast[/C][C]95% LB[/C][C]80% LB[/C][C]80% UB[/C][C]95% UB[/C][/ROW]
[ROW][C]89[/C][C]233.208640990627[/C][C]-35.1094884422981[/C][C]57.7648463336253[/C][C]408.652435647628[/C][C]501.526770423552[/C][/ROW]
[ROW][C]90[/C][C]233.208640990627[/C][C]-36.4477417786445[/C][C]56.8898095105928[/C][C]409.527472470661[/C][C]502.865023759898[/C][/ROW]
[ROW][C]91[/C][C]233.208640990627[/C][C]-37.7793863353632[/C][C]56.0190939362899[/C][C]410.398188044964[/C][C]504.196668316617[/C][/ROW]
[ROW][C]92[/C][C]233.208640990627[/C][C]-39.1045190656866[/C][C]55.1526362164054[/C][C]411.264645764848[/C][C]505.52180104694[/C][/ROW]
[ROW][C]93[/C][C]233.208640990627[/C][C]-40.4232345752129[/C][C]54.2903744916635[/C][C]412.12690748959[/C][C]506.840516556467[/C][/ROW]
[ROW][C]94[/C][C]233.208640990627[/C][C]-41.7356252007288[/C][C]53.4322483862848[/C][C]412.985033594969[/C][C]508.152907181983[/C][/ROW]
[ROW][C]95[/C][C]233.208640990627[/C][C]-43.0417810856605[/C][C]52.5781989586509[/C][C]413.839083022603[/C][C]509.459063066914[/C][/ROW]
[ROW][C]96[/C][C]233.208640990627[/C][C]-44.341790252329[/C][C]51.7281686540597[/C][C]414.689113327194[/C][C]510.759072233583[/C][/ROW]
[ROW][C]97[/C][C]233.208640990627[/C][C]-45.635738671174[/C][C]50.8821012594622[/C][C]415.535180721792[/C][C]512.053020652428[/C][/ROW]
[ROW][C]98[/C][C]233.208640990627[/C][C]-46.9237103271001[/C][C]50.0399418600809[/C][C]416.377340121173[/C][C]513.340992308354[/C][/ROW]
[/TABLE]
Source: https://freestatistics.org/blog/index.php?pk=74806&T=1

Globally Unique Identifier (entire table): ba.freestatistics.org/blog/index.php?pk=74806&T=1

As an alternative you can also use a QR Code:  

The GUIDs for individual cells are displayed in the table below:

Demand Forecast
PointForecast95% LB80% LB80% UB95% UB
89233.208640990627-35.109488442298157.7648463336253408.652435647628501.526770423552
90233.208640990627-36.447741778644556.8898095105928409.527472470661502.865023759898
91233.208640990627-37.779386335363256.0190939362899410.398188044964504.196668316617
92233.208640990627-39.104519065686655.1526362164054411.264645764848505.52180104694
93233.208640990627-40.423234575212954.2903744916635412.12690748959506.840516556467
94233.208640990627-41.735625200728853.4322483862848412.985033594969508.152907181983
95233.208640990627-43.041781085660552.5781989586509413.839083022603509.459063066914
96233.208640990627-44.34179025232951.7281686540597414.689113327194510.759072233583
97233.208640990627-45.63573867117450.8821012594622415.535180721792512.053020652428
98233.208640990627-46.923710327100150.0399418600809416.377340121173513.340992308354


Actuals and Interpolation
TimeActualForecast
1647.5NA
2174647.5
3781600.15
4277.1618.235
5653584.1215
6435.75591.00935
7613.775575.483415
8509.75579.3125735
9509.75572.35631615
10314.5566.095684535
11486540.9361160815
12212535.44250447335
13503.825503.098254026015
14435503.170928623414
15563496.353835761072
16457.05503.018452184965
17451.25498.421606966469
18500.75493.704446269822
19437.75494.40900164284
20470.5488.743101478556
210486.9187913307
22313.25486.9187913307
23314426.865374725118
24454416.510753190704
25570.5419.978768621721
26485434.008149866784
27243438.793376181591
28310420.305716386663
29421.752409.831773040575
30494.5410.969384149822
31253.5418.977713419108
32417.5403.047125686153
33182.826404.443716989816
34339.25382.956244932318
35199378.705669251030
36412.25361.180566913621
37438.25366.173292671316
38356373.235557631406
39266.25371.543358656898
40235.25361.186741969498
41323.775348.779296867306
42305.25346.312194080942
43383.527342.255297069515
44515.25346.337797060351
45496.15363.064299624115
46115.25376.255952855418
47170.5350.361905177886
48154.25332.50391679931
49170314.792957080459
50534.05300.397371324982
51193.75323.640989268148
52564.5310.712783852665
53346335.984376260037
54308.25336.982131992129
55437.05334.118750738797
56410.275344.380164659061
57149.75350.951371800566
58154.75330.88147269893
59240.1313.307915840071
60127.525306.001937535911
61222.25288.186752937644
6285.525281.603888815437
63427.75262.024939349910
6463.5278.575428638886
65118.3257.093604921059
6699.5243.229183708365
67182.25228.870190312110
68401224.212236725820
69119.5241.877136978712
70450.25229.648068804622
71147.5251.694234642319
72237241.280774359579
7380.025240.852917431464
7410.5224.777582068153
75176.75203.358765270464
76234200.698888086440
77282.5204.027873617320
78320211.872698877006
79167.5222.682468271893
80163.25217.165581376469
81238.15211.775219107528
82325.125214.412170682427
83126.3225.481464450692
84154.875215.564921817256
85327.25209.496812896323
86336.25221.270589217846
87188232.767174827398
88277.25228.290932326186

\begin{tabular}{lllllllll}
\hline
Actuals and Interpolation \tabularnewline
Time & Actual & Forecast \tabularnewline
1 & 647.5 & NA \tabularnewline
2 & 174 & 647.5 \tabularnewline
3 & 781 & 600.15 \tabularnewline
4 & 277.1 & 618.235 \tabularnewline
5 & 653 & 584.1215 \tabularnewline
6 & 435.75 & 591.00935 \tabularnewline
7 & 613.775 & 575.483415 \tabularnewline
8 & 509.75 & 579.3125735 \tabularnewline
9 & 509.75 & 572.35631615 \tabularnewline
10 & 314.5 & 566.095684535 \tabularnewline
11 & 486 & 540.9361160815 \tabularnewline
12 & 212 & 535.44250447335 \tabularnewline
13 & 503.825 & 503.098254026015 \tabularnewline
14 & 435 & 503.170928623414 \tabularnewline
15 & 563 & 496.353835761072 \tabularnewline
16 & 457.05 & 503.018452184965 \tabularnewline
17 & 451.25 & 498.421606966469 \tabularnewline
18 & 500.75 & 493.704446269822 \tabularnewline
19 & 437.75 & 494.40900164284 \tabularnewline
20 & 470.5 & 488.743101478556 \tabularnewline
21 & 0 & 486.9187913307 \tabularnewline
22 & 313.25 & 486.9187913307 \tabularnewline
23 & 314 & 426.865374725118 \tabularnewline
24 & 454 & 416.510753190704 \tabularnewline
25 & 570.5 & 419.978768621721 \tabularnewline
26 & 485 & 434.008149866784 \tabularnewline
27 & 243 & 438.793376181591 \tabularnewline
28 & 310 & 420.305716386663 \tabularnewline
29 & 421.752 & 409.831773040575 \tabularnewline
30 & 494.5 & 410.969384149822 \tabularnewline
31 & 253.5 & 418.977713419108 \tabularnewline
32 & 417.5 & 403.047125686153 \tabularnewline
33 & 182.826 & 404.443716989816 \tabularnewline
34 & 339.25 & 382.956244932318 \tabularnewline
35 & 199 & 378.705669251030 \tabularnewline
36 & 412.25 & 361.180566913621 \tabularnewline
37 & 438.25 & 366.173292671316 \tabularnewline
38 & 356 & 373.235557631406 \tabularnewline
39 & 266.25 & 371.543358656898 \tabularnewline
40 & 235.25 & 361.186741969498 \tabularnewline
41 & 323.775 & 348.779296867306 \tabularnewline
42 & 305.25 & 346.312194080942 \tabularnewline
43 & 383.527 & 342.255297069515 \tabularnewline
44 & 515.25 & 346.337797060351 \tabularnewline
45 & 496.15 & 363.064299624115 \tabularnewline
46 & 115.25 & 376.255952855418 \tabularnewline
47 & 170.5 & 350.361905177886 \tabularnewline
48 & 154.25 & 332.50391679931 \tabularnewline
49 & 170 & 314.792957080459 \tabularnewline
50 & 534.05 & 300.397371324982 \tabularnewline
51 & 193.75 & 323.640989268148 \tabularnewline
52 & 564.5 & 310.712783852665 \tabularnewline
53 & 346 & 335.984376260037 \tabularnewline
54 & 308.25 & 336.982131992129 \tabularnewline
55 & 437.05 & 334.118750738797 \tabularnewline
56 & 410.275 & 344.380164659061 \tabularnewline
57 & 149.75 & 350.951371800566 \tabularnewline
58 & 154.75 & 330.88147269893 \tabularnewline
59 & 240.1 & 313.307915840071 \tabularnewline
60 & 127.525 & 306.001937535911 \tabularnewline
61 & 222.25 & 288.186752937644 \tabularnewline
62 & 85.525 & 281.603888815437 \tabularnewline
63 & 427.75 & 262.024939349910 \tabularnewline
64 & 63.5 & 278.575428638886 \tabularnewline
65 & 118.3 & 257.093604921059 \tabularnewline
66 & 99.5 & 243.229183708365 \tabularnewline
67 & 182.25 & 228.870190312110 \tabularnewline
68 & 401 & 224.212236725820 \tabularnewline
69 & 119.5 & 241.877136978712 \tabularnewline
70 & 450.25 & 229.648068804622 \tabularnewline
71 & 147.5 & 251.694234642319 \tabularnewline
72 & 237 & 241.280774359579 \tabularnewline
73 & 80.025 & 240.852917431464 \tabularnewline
74 & 10.5 & 224.777582068153 \tabularnewline
75 & 176.75 & 203.358765270464 \tabularnewline
76 & 234 & 200.698888086440 \tabularnewline
77 & 282.5 & 204.027873617320 \tabularnewline
78 & 320 & 211.872698877006 \tabularnewline
79 & 167.5 & 222.682468271893 \tabularnewline
80 & 163.25 & 217.165581376469 \tabularnewline
81 & 238.15 & 211.775219107528 \tabularnewline
82 & 325.125 & 214.412170682427 \tabularnewline
83 & 126.3 & 225.481464450692 \tabularnewline
84 & 154.875 & 215.564921817256 \tabularnewline
85 & 327.25 & 209.496812896323 \tabularnewline
86 & 336.25 & 221.270589217846 \tabularnewline
87 & 188 & 232.767174827398 \tabularnewline
88 & 277.25 & 228.290932326186 \tabularnewline
\hline
\end{tabular}
%Source: https://freestatistics.org/blog/index.php?pk=74806&T=2

[TABLE]
[ROW][C]Actuals and Interpolation[/C][/ROW]
[ROW][C]Time[/C][C]Actual[/C][C]Forecast[/C][/ROW]
[ROW][C]1[/C][C]647.5[/C][C]NA[/C][/ROW]
[ROW][C]2[/C][C]174[/C][C]647.5[/C][/ROW]
[ROW][C]3[/C][C]781[/C][C]600.15[/C][/ROW]
[ROW][C]4[/C][C]277.1[/C][C]618.235[/C][/ROW]
[ROW][C]5[/C][C]653[/C][C]584.1215[/C][/ROW]
[ROW][C]6[/C][C]435.75[/C][C]591.00935[/C][/ROW]
[ROW][C]7[/C][C]613.775[/C][C]575.483415[/C][/ROW]
[ROW][C]8[/C][C]509.75[/C][C]579.3125735[/C][/ROW]
[ROW][C]9[/C][C]509.75[/C][C]572.35631615[/C][/ROW]
[ROW][C]10[/C][C]314.5[/C][C]566.095684535[/C][/ROW]
[ROW][C]11[/C][C]486[/C][C]540.9361160815[/C][/ROW]
[ROW][C]12[/C][C]212[/C][C]535.44250447335[/C][/ROW]
[ROW][C]13[/C][C]503.825[/C][C]503.098254026015[/C][/ROW]
[ROW][C]14[/C][C]435[/C][C]503.170928623414[/C][/ROW]
[ROW][C]15[/C][C]563[/C][C]496.353835761072[/C][/ROW]
[ROW][C]16[/C][C]457.05[/C][C]503.018452184965[/C][/ROW]
[ROW][C]17[/C][C]451.25[/C][C]498.421606966469[/C][/ROW]
[ROW][C]18[/C][C]500.75[/C][C]493.704446269822[/C][/ROW]
[ROW][C]19[/C][C]437.75[/C][C]494.40900164284[/C][/ROW]
[ROW][C]20[/C][C]470.5[/C][C]488.743101478556[/C][/ROW]
[ROW][C]21[/C][C]0[/C][C]486.9187913307[/C][/ROW]
[ROW][C]22[/C][C]313.25[/C][C]486.9187913307[/C][/ROW]
[ROW][C]23[/C][C]314[/C][C]426.865374725118[/C][/ROW]
[ROW][C]24[/C][C]454[/C][C]416.510753190704[/C][/ROW]
[ROW][C]25[/C][C]570.5[/C][C]419.978768621721[/C][/ROW]
[ROW][C]26[/C][C]485[/C][C]434.008149866784[/C][/ROW]
[ROW][C]27[/C][C]243[/C][C]438.793376181591[/C][/ROW]
[ROW][C]28[/C][C]310[/C][C]420.305716386663[/C][/ROW]
[ROW][C]29[/C][C]421.752[/C][C]409.831773040575[/C][/ROW]
[ROW][C]30[/C][C]494.5[/C][C]410.969384149822[/C][/ROW]
[ROW][C]31[/C][C]253.5[/C][C]418.977713419108[/C][/ROW]
[ROW][C]32[/C][C]417.5[/C][C]403.047125686153[/C][/ROW]
[ROW][C]33[/C][C]182.826[/C][C]404.443716989816[/C][/ROW]
[ROW][C]34[/C][C]339.25[/C][C]382.956244932318[/C][/ROW]
[ROW][C]35[/C][C]199[/C][C]378.705669251030[/C][/ROW]
[ROW][C]36[/C][C]412.25[/C][C]361.180566913621[/C][/ROW]
[ROW][C]37[/C][C]438.25[/C][C]366.173292671316[/C][/ROW]
[ROW][C]38[/C][C]356[/C][C]373.235557631406[/C][/ROW]
[ROW][C]39[/C][C]266.25[/C][C]371.543358656898[/C][/ROW]
[ROW][C]40[/C][C]235.25[/C][C]361.186741969498[/C][/ROW]
[ROW][C]41[/C][C]323.775[/C][C]348.779296867306[/C][/ROW]
[ROW][C]42[/C][C]305.25[/C][C]346.312194080942[/C][/ROW]
[ROW][C]43[/C][C]383.527[/C][C]342.255297069515[/C][/ROW]
[ROW][C]44[/C][C]515.25[/C][C]346.337797060351[/C][/ROW]
[ROW][C]45[/C][C]496.15[/C][C]363.064299624115[/C][/ROW]
[ROW][C]46[/C][C]115.25[/C][C]376.255952855418[/C][/ROW]
[ROW][C]47[/C][C]170.5[/C][C]350.361905177886[/C][/ROW]
[ROW][C]48[/C][C]154.25[/C][C]332.50391679931[/C][/ROW]
[ROW][C]49[/C][C]170[/C][C]314.792957080459[/C][/ROW]
[ROW][C]50[/C][C]534.05[/C][C]300.397371324982[/C][/ROW]
[ROW][C]51[/C][C]193.75[/C][C]323.640989268148[/C][/ROW]
[ROW][C]52[/C][C]564.5[/C][C]310.712783852665[/C][/ROW]
[ROW][C]53[/C][C]346[/C][C]335.984376260037[/C][/ROW]
[ROW][C]54[/C][C]308.25[/C][C]336.982131992129[/C][/ROW]
[ROW][C]55[/C][C]437.05[/C][C]334.118750738797[/C][/ROW]
[ROW][C]56[/C][C]410.275[/C][C]344.380164659061[/C][/ROW]
[ROW][C]57[/C][C]149.75[/C][C]350.951371800566[/C][/ROW]
[ROW][C]58[/C][C]154.75[/C][C]330.88147269893[/C][/ROW]
[ROW][C]59[/C][C]240.1[/C][C]313.307915840071[/C][/ROW]
[ROW][C]60[/C][C]127.525[/C][C]306.001937535911[/C][/ROW]
[ROW][C]61[/C][C]222.25[/C][C]288.186752937644[/C][/ROW]
[ROW][C]62[/C][C]85.525[/C][C]281.603888815437[/C][/ROW]
[ROW][C]63[/C][C]427.75[/C][C]262.024939349910[/C][/ROW]
[ROW][C]64[/C][C]63.5[/C][C]278.575428638886[/C][/ROW]
[ROW][C]65[/C][C]118.3[/C][C]257.093604921059[/C][/ROW]
[ROW][C]66[/C][C]99.5[/C][C]243.229183708365[/C][/ROW]
[ROW][C]67[/C][C]182.25[/C][C]228.870190312110[/C][/ROW]
[ROW][C]68[/C][C]401[/C][C]224.212236725820[/C][/ROW]
[ROW][C]69[/C][C]119.5[/C][C]241.877136978712[/C][/ROW]
[ROW][C]70[/C][C]450.25[/C][C]229.648068804622[/C][/ROW]
[ROW][C]71[/C][C]147.5[/C][C]251.694234642319[/C][/ROW]
[ROW][C]72[/C][C]237[/C][C]241.280774359579[/C][/ROW]
[ROW][C]73[/C][C]80.025[/C][C]240.852917431464[/C][/ROW]
[ROW][C]74[/C][C]10.5[/C][C]224.777582068153[/C][/ROW]
[ROW][C]75[/C][C]176.75[/C][C]203.358765270464[/C][/ROW]
[ROW][C]76[/C][C]234[/C][C]200.698888086440[/C][/ROW]
[ROW][C]77[/C][C]282.5[/C][C]204.027873617320[/C][/ROW]
[ROW][C]78[/C][C]320[/C][C]211.872698877006[/C][/ROW]
[ROW][C]79[/C][C]167.5[/C][C]222.682468271893[/C][/ROW]
[ROW][C]80[/C][C]163.25[/C][C]217.165581376469[/C][/ROW]
[ROW][C]81[/C][C]238.15[/C][C]211.775219107528[/C][/ROW]
[ROW][C]82[/C][C]325.125[/C][C]214.412170682427[/C][/ROW]
[ROW][C]83[/C][C]126.3[/C][C]225.481464450692[/C][/ROW]
[ROW][C]84[/C][C]154.875[/C][C]215.564921817256[/C][/ROW]
[ROW][C]85[/C][C]327.25[/C][C]209.496812896323[/C][/ROW]
[ROW][C]86[/C][C]336.25[/C][C]221.270589217846[/C][/ROW]
[ROW][C]87[/C][C]188[/C][C]232.767174827398[/C][/ROW]
[ROW][C]88[/C][C]277.25[/C][C]228.290932326186[/C][/ROW]
[/TABLE]
Source: https://freestatistics.org/blog/index.php?pk=74806&T=2

Globally Unique Identifier (entire table): ba.freestatistics.org/blog/index.php?pk=74806&T=2

As an alternative you can also use a QR Code:  

The GUIDs for individual cells are displayed in the table below:

Actuals and Interpolation
TimeActualForecast
1647.5NA
2174647.5
3781600.15
4277.1618.235
5653584.1215
6435.75591.00935
7613.775575.483415
8509.75579.3125735
9509.75572.35631615
10314.5566.095684535
11486540.9361160815
12212535.44250447335
13503.825503.098254026015
14435503.170928623414
15563496.353835761072
16457.05503.018452184965
17451.25498.421606966469
18500.75493.704446269822
19437.75494.40900164284
20470.5488.743101478556
210486.9187913307
22313.25486.9187913307
23314426.865374725118
24454416.510753190704
25570.5419.978768621721
26485434.008149866784
27243438.793376181591
28310420.305716386663
29421.752409.831773040575
30494.5410.969384149822
31253.5418.977713419108
32417.5403.047125686153
33182.826404.443716989816
34339.25382.956244932318
35199378.705669251030
36412.25361.180566913621
37438.25366.173292671316
38356373.235557631406
39266.25371.543358656898
40235.25361.186741969498
41323.775348.779296867306
42305.25346.312194080942
43383.527342.255297069515
44515.25346.337797060351
45496.15363.064299624115
46115.25376.255952855418
47170.5350.361905177886
48154.25332.50391679931
49170314.792957080459
50534.05300.397371324982
51193.75323.640989268148
52564.5310.712783852665
53346335.984376260037
54308.25336.982131992129
55437.05334.118750738797
56410.275344.380164659061
57149.75350.951371800566
58154.75330.88147269893
59240.1313.307915840071
60127.525306.001937535911
61222.25288.186752937644
6285.525281.603888815437
63427.75262.024939349910
6463.5278.575428638886
65118.3257.093604921059
6699.5243.229183708365
67182.25228.870190312110
68401224.212236725820
69119.5241.877136978712
70450.25229.648068804622
71147.5251.694234642319
72237241.280774359579
7380.025240.852917431464
7410.5224.777582068153
75176.75203.358765270464
76234200.698888086440
77282.5204.027873617320
78320211.872698877006
79167.5222.682468271893
80163.25217.165581376469
81238.15211.775219107528
82325.125214.412170682427
83126.3225.481464450692
84154.875215.564921817256
85327.25209.496812896323
86336.25221.270589217846
87188232.767174827398
88277.25228.290932326186


\begin{tabular}{lllllllll}
\hline
What is next? \tabularnewline
Simulate Time Series \tabularnewline
Generate Forecasts \tabularnewline
Forecast Analysis \tabularnewline
\hline
\end{tabular}
%Source: https://freestatistics.org/blog/index.php?pk=74806&T=3

[TABLE]
[ROW][C]What is next?[/C][/ROW]
[ROW][C]Simulate Time Series[/C][/ROW]
[ROW][C]Generate Forecasts[/C][/ROW]
[ROW][C]Forecast Analysis[/C][/ROW]
[/TABLE]
Source: https://freestatistics.org/blog/index.php?pk=74806&T=3

Globally Unique Identifier (entire table): ba.freestatistics.org/blog/index.php?pk=74806&T=3

As an alternative you can also use a QR Code:  

The GUIDs for individual cells are displayed in the table below:

What is next?
Simulate Time Series
Generate Forecasts
Forecast Analysis


Parameters (Session):
par1 = Input box ; par2 = Croston ; par3 = NA ; par4 = NA ; par5 = ZZZ ; par6 = 12 ; par7 = dum ; par8 = B28Acrostonm ; par9 = 3 ; par10 = 0.1 ;
Parameters (R input):
par1 = Input box ; par2 = Croston ; par3 = NA ; par4 = NA ; par5 = ZZZ ; par6 = 12 ; par7 = dum ; par8 = B28Acrostonm ; par9 = 3 ; par10 = 0.1 ;
R code (references can be found in the software module):
if(par3!='NA') par3 <- as.numeric(par3) else par3 <- NA
if(par4!='NA') par4 <- as.numeric(par4) else par4 <- NA
par6 <- as.numeric(par6) #Seasonal Period
par9 <- as.numeric(par9) #Forecast Horizon
par10 <- as.numeric(par10) #Alpha
library(forecast)
if (par1 == 'CSV') {
xarr <- read.csv(file=paste('tmp/',par7,'.csv',sep=''),header=T)
numseries <- length(xarr[1,])-1
n <- length(xarr[,1])
nmh <- n - par9
nmhp1 <- nmh + 1
rarr <- array(NA,dim=c(n,numseries))
farr <- array(NA,dim=c(n,numseries))
parr <- array(NA,dim=c(numseries,8))
colnames(parr) = list('ME','RMSE','MAE','MPE','MAPE','MASE','ACF1','TheilU')
for(i in 1:numseries) {
sindex <- i+1
x <- xarr[,sindex]
if(par2=='Croston') {
if (i==1) m <- croston(x,alpha=par10)
if (i==1) mydemand <- m$model$demand[]
fit <- croston(x[1:nmh],h=par9,alpha=par10)
}
if(par2=='ARIMA') {
m <- auto.arima(ts(x,freq=par6),d=par3,D=par4)
mydemand <- forecast(m)
fit <- auto.arima(ts(x[1:nmh],freq=par6),d=par3,D=par4)
}
if(par2=='ETS') {
m <- ets(ts(x,freq=par6),model=par5)
mydemand <- forecast(m)
fit <- ets(ts(x[1:nmh],freq=par6),model=par5)
}
try(rarr[,i] <- mydemand$resid,silent=T)
try(farr[,i] <- mydemand$mean,silent=T)
if (par2!='Croston') parr[i,] <- accuracy(forecast(fit,par9),x[nmhp1:n])
if (par2=='Croston') parr[i,] <- accuracy(fit,x[nmhp1:n])
}
write.csv(farr,file=paste('tmp/',par8,'_f.csv',sep=''))
write.csv(rarr,file=paste('tmp/',par8,'_r.csv',sep=''))
write.csv(parr,file=paste('tmp/',par8,'_p.csv',sep=''))
}
if (par1 == 'Input box') {
numseries <- 1
n <- length(x)
if(par2=='Croston') {
m <- croston(x)
mydemand <- m$model$demand[]
}
if(par2=='ARIMA') {
m <- auto.arima(ts(x,freq=par6),d=par3,D=par4)
mydemand <- forecast(m)
}
if(par2=='ETS') {
m <- ets(ts(x,freq=par6),model=par5)
mydemand <- forecast(m)
}
summary(m)
}
bitmap(file='test1.png')
op <- par(mfrow=c(2,1))
if (par2=='Croston') plot(m)
if ((par2=='ARIMA') | par2=='ETS') plot(forecast(m))
plot(mydemand$resid,type='l',main='Residuals', ylab='residual value', xlab='time')
par(op)
dev.off()
bitmap(file='pic2.png')
op <- par(mfrow=c(2,2))
acf(mydemand$resid, lag.max=n/3, main='Residual ACF', ylab='autocorrelation', xlab='time lag')
pacf(mydemand$resid,lag.max=n/3, main='Residual PACF', ylab='partial autocorrelation', xlab='time lag')
cpgram(mydemand$resid, main='Cumulative Periodogram of Residuals')
qqnorm(mydemand$resid); qqline(mydemand$resid, col=2)
par(op)
dev.off()
load(file='createtable')
a<-table.start()
a<-table.row.start(a)
a<-table.element(a,'Demand Forecast',6,TRUE)
a<-table.row.end(a)
a<-table.row.start(a)
a<-table.element(a,'Point',header=TRUE)
a<-table.element(a,'Forecast',header=TRUE)
a<-table.element(a,'95% LB',header=TRUE)
a<-table.element(a,'80% LB',header=TRUE)
a<-table.element(a,'80% UB',header=TRUE)
a<-table.element(a,'95% UB',header=TRUE)
a<-table.row.end(a)
for (i in 1:length(mydemand$mean)) {
a<-table.row.start(a)
a<-table.element(a,i+n,header=TRUE)
a<-table.element(a,as.numeric(mydemand$mean[i]))
a<-table.element(a,as.numeric(mydemand$lower[i,2]))
a<-table.element(a,as.numeric(mydemand$lower[i,1]))
a<-table.element(a,as.numeric(mydemand$upper[i,1]))
a<-table.element(a,as.numeric(mydemand$upper[i,2]))
a<-table.row.end(a)
}
a<-table.end(a)
table.save(a,file='mytable.tab')
a<-table.start()
a<-table.row.start(a)
a<-table.element(a,'Actuals and Interpolation',3,TRUE)
a<-table.row.end(a)
a<-table.row.start(a)
a<-table.element(a,'Time',header=TRUE)
a<-table.element(a,'Actual',header=TRUE)
a<-table.element(a,'Forecast',header=TRUE)
a<-table.row.end(a)
for (i in 1:n) {
a<-table.row.start(a)
a<-table.element(a,i,header=TRUE)
a<-table.element(a,x[i])
a<-table.element(a,x[i] - as.numeric(m$resid[i]))
a<-table.row.end(a)
}
a<-table.end(a)
table.save(a,file='mytable1.tab')
a<-table.start()
a<-table.row.start(a)
a<-table.element(a,'What is next?',1,TRUE)
a<-table.row.end(a)
a<-table.row.start(a)
a<-table.element(a,hyperlink(paste('https://automated.biganalytics.eu/Patrick.Wessa/rwasp_demand_forecasting_simulate.wasp',sep=''),'Simulate Time Series','',target=''))
a<-table.row.end(a)
a<-table.row.start(a)
a<-table.element(a,hyperlink(paste('https://automated.biganalytics.eu/Patrick.Wessa/rwasp_demand_forecasting_croston.wasp#output',sep=''),'Generate Forecasts','',target=''))
a<-table.row.end(a)
a<-table.row.start(a)
a<-table.element(a,hyperlink(paste('https://automated.biganalytics.eu/Patrick.Wessa/rwasp_demand_forecasting_analysis.wasp',sep=''),'Forecast Analysis','',target=''))
a<-table.row.end(a)
a<-table.end(a)
table.save(a,file='mytable0.tab')
-SERVER-wessa.org