Free Statistics
of Irreproducible Research!
Description of Statistical Computation | |||||||||||||||||||||||||||||||||
|---|---|---|---|---|---|---|---|---|---|---|---|---|---|---|---|---|---|---|---|---|---|---|---|---|---|---|---|---|---|---|---|---|---|
| Author's title | |||||||||||||||||||||||||||||||||
| Author | *Unverified author* | ||||||||||||||||||||||||||||||||
| R Software Module | rwasp_fitdistrexp.wasp | ||||||||||||||||||||||||||||||||
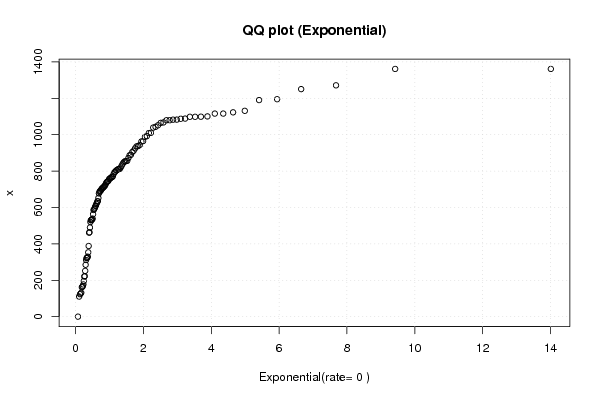
| Title produced by software | Maximum-likelihood Fitting - Exponential Distribution | ||||||||||||||||||||||||||||||||
| Date of computation | Sun, 18 Apr 2010 10:34:33 +0000 | ||||||||||||||||||||||||||||||||
| Cite this page as follows | Statistical Computations at FreeStatistics.org, Office for Research Development and Education, URL https://freestatistics.org/blog/index.php?v=date/2010/Apr/18/t1271586907pabfxk8qqt2seaw.htm/, Retrieved Tue, 15 Jul 2025 21:55:58 +0000 | ||||||||||||||||||||||||||||||||
| Statistical Computations at FreeStatistics.org, Office for Research Development and Education, URL https://freestatistics.org/blog/index.php?pk=74667, Retrieved Tue, 15 Jul 2025 21:55:58 +0000 | |||||||||||||||||||||||||||||||||
| QR Codes: | |||||||||||||||||||||||||||||||||
|
| |||||||||||||||||||||||||||||||||
| Original text written by user: | |||||||||||||||||||||||||||||||||
| IsPrivate? | No (this computation is public) | ||||||||||||||||||||||||||||||||
| User-defined keywords | FM22,steven,coomans,thesis,exponentieel | ||||||||||||||||||||||||||||||||
| Estimated Impact | 359 | ||||||||||||||||||||||||||||||||
Tree of Dependent Computations | |||||||||||||||||||||||||||||||||
| Family? (F = Feedback message, R = changed R code, M = changed R Module, P = changed Parameters, D = changed Data) | |||||||||||||||||||||||||||||||||
| - [Maximum-likelihood Fitting - Exponential Distribution] [FM22,steven,cooma...] [2010-04-18 10:34:33] [d41d8cd98f00b204e9800998ecf8427e] [Current] | |||||||||||||||||||||||||||||||||
| Feedback Forum | |||||||||||||||||||||||||||||||||
Post a new message | |||||||||||||||||||||||||||||||||
Dataset | |||||||||||||||||||||||||||||||||
| Dataseries X: | |||||||||||||||||||||||||||||||||
840.875 1051.8 854.835 849.2 625.1 964.775 887.225 1010.45 1131.25 718.2 1088.5 1271.375 1098.375 1098.375 1195.05 1361.375 1361.375 1100.625 1190.375 1250.485 1087.575 992.05 810 1064.95 937.25 1039 1122.956 1079.5 1079.5 889.5 784.5 793.75 924.5 762.43 811.5 942.94 812.615 911.735 1009.25 1116.01 1116.01 988.16 1067.52 1082.53 1043.215 871.83 904.485 689.56 1082.78 1098.85 713.5 704.5 0 652.25 563 586 538.75 353.6 321.275 388.4 329.6 323 520.25 607.725 803.45 677.25 711 962.5 935.6 722.255 594.25 853.75 766.5 758.05 756.85 685.4 696.525 610.025 708.325 619.1 740.525 730.5 489.75 766.525 690.882 804.975 529.25 743.75 771.15 830.5 600 856.1 702.75 533.775 311.25 590 738 797.05 531.3 820 533.25 633.25 634.275 747.3 220.375 195.75 123.25 161.75 126.75 285.1 461.5 463.625 325.875 177 223 168.45 251.75 131.5 110.375 164.125 | |||||||||||||||||||||||||||||||||
Tables (Output of Computation) | |||||||||||||||||||||||||||||||||
| |||||||||||||||||||||||||||||||||
Figures (Output of Computation) | |||||||||||||||||||||||||||||||||
Input Parameters & R Code | |||||||||||||||||||||||||||||||||
| Parameters (Session): | |||||||||||||||||||||||||||||||||
| Parameters (R input): | |||||||||||||||||||||||||||||||||
| R code (references can be found in the software module): | |||||||||||||||||||||||||||||||||
library(MASS) | |||||||||||||||||||||||||||||||||