Free Statistics
of Irreproducible Research!
Description of Statistical Computation | |||||||||||||||||||||||||||||||||
|---|---|---|---|---|---|---|---|---|---|---|---|---|---|---|---|---|---|---|---|---|---|---|---|---|---|---|---|---|---|---|---|---|---|
| Author's title | |||||||||||||||||||||||||||||||||
| Author | *Unverified author* | ||||||||||||||||||||||||||||||||
| R Software Module | rwasp_fitdistrexp.wasp | ||||||||||||||||||||||||||||||||
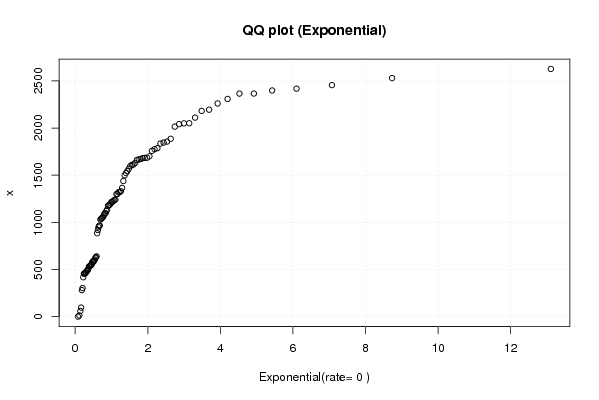
| Title produced by software | Maximum-likelihood Fitting - Exponential Distribution | ||||||||||||||||||||||||||||||||
| Date of computation | Sun, 18 Apr 2010 10:10:58 +0000 | ||||||||||||||||||||||||||||||||
| Cite this page as follows | Statistical Computations at FreeStatistics.org, Office for Research Development and Education, URL https://freestatistics.org/blog/index.php?v=date/2010/Apr/18/t12715854933vc1tqjp87vcg3w.htm/, Retrieved Wed, 16 Jul 2025 01:58:54 +0000 | ||||||||||||||||||||||||||||||||
| Statistical Computations at FreeStatistics.org, Office for Research Development and Education, URL https://freestatistics.org/blog/index.php?pk=74661, Retrieved Wed, 16 Jul 2025 01:58:54 +0000 | |||||||||||||||||||||||||||||||||
| QR Codes: | |||||||||||||||||||||||||||||||||
|
| |||||||||||||||||||||||||||||||||
| Original text written by user: | |||||||||||||||||||||||||||||||||
| IsPrivate? | No (this computation is public) | ||||||||||||||||||||||||||||||||
| User-defined keywords | FM55,steven,coomans,thesis,exponentieel | ||||||||||||||||||||||||||||||||
| Estimated Impact | 341 | ||||||||||||||||||||||||||||||||
Tree of Dependent Computations | |||||||||||||||||||||||||||||||||
| Family? (F = Feedback message, R = changed R code, M = changed R Module, P = changed Parameters, D = changed Data) | |||||||||||||||||||||||||||||||||
| - [Maximum-likelihood Fitting - Exponential Distribution] [FM55,steven,cooma...] [2010-04-18 10:10:58] [d41d8cd98f00b204e9800998ecf8427e] [Current] | |||||||||||||||||||||||||||||||||
| Feedback Forum | |||||||||||||||||||||||||||||||||
Post a new message | |||||||||||||||||||||||||||||||||
Dataset | |||||||||||||||||||||||||||||||||
| Dataseries X: | |||||||||||||||||||||||||||||||||
13 96 60.1 281.25 548.59 470.325 456.25 456.25 483.5 498.25 457.5 490.7 303.075 510 417.7 631.4 595.625 531.15 581.725 581.725 544.75 582 622.225 638.666 469.9 532.78 538.5 884.65 559.08 1045.51 1319.34 0 1300 1322.6 962.57 1030.715 1038.31 967.87 1228.2 1300.285 1095.995 1181.955 1499.46 1523.38 1237.765 1119.545 1136.165 1081.63 1060.065 1216.67 1186.17 1217.475 1096.95 1685.6 1758.5 1786.6 2049.895 1845.895 2015.02 1609.63 918.725 1240.96 1671.785 1438.466 1886.14 2110.66 1856.87 1775.765 1569.625 1835.69 2041.46 1667.035 948.25 1365.66 1681.025 1661.9 2194.88 2051.025 2365.845 2398.5 2181.85 2626.77 2529.72 1700.3 605.38 1200.495 1597.02 1174.955 1612.88 1683.55 2260.955 2455.335 2365.62 2417.755 2308.785 1629.94 1053.275 1330.235 1543.85 | |||||||||||||||||||||||||||||||||
Tables (Output of Computation) | |||||||||||||||||||||||||||||||||
| |||||||||||||||||||||||||||||||||
Figures (Output of Computation) | |||||||||||||||||||||||||||||||||
Input Parameters & R Code | |||||||||||||||||||||||||||||||||
| Parameters (Session): | |||||||||||||||||||||||||||||||||
| Parameters (R input): | |||||||||||||||||||||||||||||||||
| R code (references can be found in the software module): | |||||||||||||||||||||||||||||||||
library(MASS) | |||||||||||||||||||||||||||||||||