Free Statistics

of Irreproducible Research!

Author's title

Author*Unverified author*
R Software ModulePatrick.Wessarwasp_demand_forecasting_croston.wasp
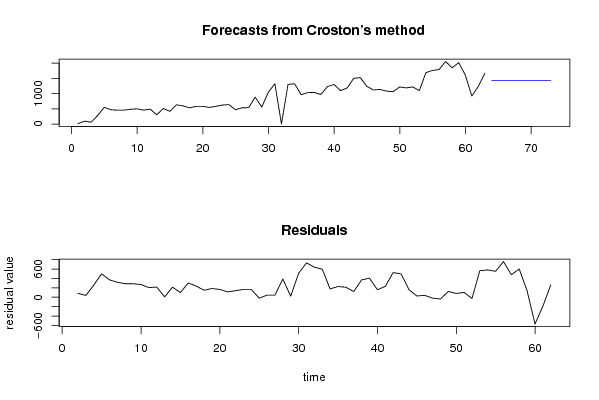
Title produced by softwareCroston Forecasting
Date of computationSun, 18 Apr 2010 09:53:20 +0000
Cite this page as followsStatistical Computations at FreeStatistics.org, Office for Research Development and Education, URL https://freestatistics.org/blog/index.php?v=date/2010/Apr/18/t127158448058nd7p8wbirayzd.htm/, Retrieved Wed, 11 Dec 2024 19:39:20 +0000
Statistical Computations at FreeStatistics.org, Office for Research Development and Education, URL https://freestatistics.org/blog/index.php?pk=74656, Retrieved Wed, 11 Dec 2024 19:39:20 +0000
QR Codes:

Original text written by user:
IsPrivate?No (this computation is public)
User-defined keywordsmissingvalue,FM50,steven,coomans,thesis
Estimated Impact282
Family? (F = Feedback message, R = changed R code, M = changed R Module, P = changed Parameters, D = changed Data)
-       [Croston Forecasting] [missingvalue,FM50...] [2010-04-18 09:53:20] [d41d8cd98f00b204e9800998ecf8427e] [Current]
Feedback Forum

Post a new message
Dataseries X:
13
96
60,1
281,25
548,59
470,325
456,25
456,25
483,5
498,25
457,5
490,7
303,075
510
417,7
631,4
595,625
531,15
581,725
581,725
544,75
582
622,225
638,666
469,9
532,78
538,5
884,65
559,08
1045,51
1319,34
0
1300
1322,6
962,57
1030,715
1038,31
967,87
1228,2
1300,285
1095,995
1181,955
1499,46
1523,38
1237,765
1119,545
1136,165
1081,63
1060,065
1216,67
1186,17
1217,475
1096,95
1685,6
1758,5
1786,6
2049,895
1845,895
2015,02
1609,63
918,725
1240,96
1671,785


Summary of computational transaction
Raw Inputview raw input (R code)
Raw Outputview raw output of R engine
Computing time4 seconds
R Serverwessa.org @ wessa.org

\begin{tabular}{lllllllll}
\hline
Summary of computational transaction \tabularnewline
Raw Input & view raw input (R code)  \tabularnewline
Raw Output & view raw output of R engine  \tabularnewline
Computing time & 4 seconds \tabularnewline
R Server & wessa.org @ wessa.org \tabularnewline
\hline
\end{tabular}
%Source: https://freestatistics.org/blog/index.php?pk=74656&T=0

[TABLE]
[ROW][C]Summary of computational transaction[/C][/ROW]
[ROW][C]Raw Input[/C][C]view raw input (R code) [/C][/ROW]
[ROW][C]Raw Output[/C][C]view raw output of R engine [/C][/ROW]
[ROW][C]Computing time[/C][C]4 seconds[/C][/ROW]
[ROW][C]R Server[/C][C]wessa.org @ wessa.org[/C][/ROW]
[/TABLE]
Source: https://freestatistics.org/blog/index.php?pk=74656&T=0

Globally Unique Identifier (entire table): ba.freestatistics.org/blog/index.php?pk=74656&T=0

As an alternative you can also use a QR Code:  

The GUIDs for individual cells are displayed in the table below:

Summary of computational transaction
Raw Inputview raw input (R code)
Raw Outputview raw output of R engine
Computing time4 seconds
R Serverwessa.org @ wessa.org


Demand Forecast
PointForecast95% LB80% LB80% UB95% UB
641438.46639181646978.2106979798071137.521369540661739.411414092261898.72208565311
651438.46639181646975.9151441193541136.020387549731740.912396083191901.01763951357
661438.46639181646973.6309265352061134.526817951461742.405965681461903.30185709772
671438.46639181646971.3578789200121133.040552003321743.89223162961905.57490471291
681438.46639181646969.0958389934041131.561483595871745.371300037051907.83694463952
691438.46639181646966.8446483667841130.089509164381746.843274468541910.08813526614
701438.46639181646964.6041524139071128.624527604181748.308256028741912.32863121901
711438.46639181646962.3742001469331127.166440189631749.766343443291914.55858348599
721438.46639181646960.154644097691125.715150496481751.217633136441916.77813953523
731438.46639181646957.9453402038651124.270564327431752.662219305491918.98744342906

\begin{tabular}{lllllllll}
\hline
Demand Forecast \tabularnewline
Point & Forecast & 95% LB & 80% LB & 80% UB & 95% UB \tabularnewline
64 & 1438.46639181646 & 978.210697979807 & 1137.52136954066 & 1739.41141409226 & 1898.72208565311 \tabularnewline
65 & 1438.46639181646 & 975.915144119354 & 1136.02038754973 & 1740.91239608319 & 1901.01763951357 \tabularnewline
66 & 1438.46639181646 & 973.630926535206 & 1134.52681795146 & 1742.40596568146 & 1903.30185709772 \tabularnewline
67 & 1438.46639181646 & 971.357878920012 & 1133.04055200332 & 1743.8922316296 & 1905.57490471291 \tabularnewline
68 & 1438.46639181646 & 969.095838993404 & 1131.56148359587 & 1745.37130003705 & 1907.83694463952 \tabularnewline
69 & 1438.46639181646 & 966.844648366784 & 1130.08950916438 & 1746.84327446854 & 1910.08813526614 \tabularnewline
70 & 1438.46639181646 & 964.604152413907 & 1128.62452760418 & 1748.30825602874 & 1912.32863121901 \tabularnewline
71 & 1438.46639181646 & 962.374200146933 & 1127.16644018963 & 1749.76634344329 & 1914.55858348599 \tabularnewline
72 & 1438.46639181646 & 960.15464409769 & 1125.71515049648 & 1751.21763313644 & 1916.77813953523 \tabularnewline
73 & 1438.46639181646 & 957.945340203865 & 1124.27056432743 & 1752.66221930549 & 1918.98744342906 \tabularnewline
\hline
\end{tabular}
%Source: https://freestatistics.org/blog/index.php?pk=74656&T=1

[TABLE]
[ROW][C]Demand Forecast[/C][/ROW]
[ROW][C]Point[/C][C]Forecast[/C][C]95% LB[/C][C]80% LB[/C][C]80% UB[/C][C]95% UB[/C][/ROW]
[ROW][C]64[/C][C]1438.46639181646[/C][C]978.210697979807[/C][C]1137.52136954066[/C][C]1739.41141409226[/C][C]1898.72208565311[/C][/ROW]
[ROW][C]65[/C][C]1438.46639181646[/C][C]975.915144119354[/C][C]1136.02038754973[/C][C]1740.91239608319[/C][C]1901.01763951357[/C][/ROW]
[ROW][C]66[/C][C]1438.46639181646[/C][C]973.630926535206[/C][C]1134.52681795146[/C][C]1742.40596568146[/C][C]1903.30185709772[/C][/ROW]
[ROW][C]67[/C][C]1438.46639181646[/C][C]971.357878920012[/C][C]1133.04055200332[/C][C]1743.8922316296[/C][C]1905.57490471291[/C][/ROW]
[ROW][C]68[/C][C]1438.46639181646[/C][C]969.095838993404[/C][C]1131.56148359587[/C][C]1745.37130003705[/C][C]1907.83694463952[/C][/ROW]
[ROW][C]69[/C][C]1438.46639181646[/C][C]966.844648366784[/C][C]1130.08950916438[/C][C]1746.84327446854[/C][C]1910.08813526614[/C][/ROW]
[ROW][C]70[/C][C]1438.46639181646[/C][C]964.604152413907[/C][C]1128.62452760418[/C][C]1748.30825602874[/C][C]1912.32863121901[/C][/ROW]
[ROW][C]71[/C][C]1438.46639181646[/C][C]962.374200146933[/C][C]1127.16644018963[/C][C]1749.76634344329[/C][C]1914.55858348599[/C][/ROW]
[ROW][C]72[/C][C]1438.46639181646[/C][C]960.15464409769[/C][C]1125.71515049648[/C][C]1751.21763313644[/C][C]1916.77813953523[/C][/ROW]
[ROW][C]73[/C][C]1438.46639181646[/C][C]957.945340203865[/C][C]1124.27056432743[/C][C]1752.66221930549[/C][C]1918.98744342906[/C][/ROW]
[/TABLE]
Source: https://freestatistics.org/blog/index.php?pk=74656&T=1

Globally Unique Identifier (entire table): ba.freestatistics.org/blog/index.php?pk=74656&T=1

As an alternative you can also use a QR Code:  

The GUIDs for individual cells are displayed in the table below:

Demand Forecast
PointForecast95% LB80% LB80% UB95% UB
641438.46639181646978.2106979798071137.521369540661739.411414092261898.72208565311
651438.46639181646975.9151441193541136.020387549731740.912396083191901.01763951357
661438.46639181646973.6309265352061134.526817951461742.405965681461903.30185709772
671438.46639181646971.3578789200121133.040552003321743.89223162961905.57490471291
681438.46639181646969.0958389934041131.561483595871745.371300037051907.83694463952
691438.46639181646966.8446483667841130.089509164381746.843274468541910.08813526614
701438.46639181646964.6041524139071128.624527604181748.308256028741912.32863121901
711438.46639181646962.3742001469331127.166440189631749.766343443291914.55858348599
721438.46639181646960.154644097691125.715150496481751.217633136441916.77813953523
731438.46639181646957.9453402038651124.270564327431752.662219305491918.98744342906


\begin{tabular}{lllllllll}
\hline
What is next? \tabularnewline
Simulate Time Series \tabularnewline
Generate Forecasts \tabularnewline
Forecast Analysis \tabularnewline
\hline
\end{tabular}
%Source: https://freestatistics.org/blog/index.php?pk=74656&T=2

[TABLE]
[ROW][C]What is next?[/C][/ROW]
[ROW][C]Simulate Time Series[/C][/ROW]
[ROW][C]Generate Forecasts[/C][/ROW]
[ROW][C]Forecast Analysis[/C][/ROW]
[/TABLE]
Source: https://freestatistics.org/blog/index.php?pk=74656&T=2

Globally Unique Identifier (entire table): ba.freestatistics.org/blog/index.php?pk=74656&T=2

As an alternative you can also use a QR Code:  

The GUIDs for individual cells are displayed in the table below:

What is next?
Simulate Time Series
Generate Forecasts
Forecast Analysis


Parameters (Session):
par1 = Input box ; par2 = Croston ; par3 = NA ; par4 = NA ; par5 = ZZZ ; par6 = 12 ; par7 = dum ; par8 = dumresult ; par9 = 1 ; par10 = 0.1 ;
Parameters (R input):
par1 = Input box ; par2 = Croston ; par3 = NA ; par4 = NA ; par5 = ZZZ ; par6 = 12 ; par7 = dum ; par8 = dumresult ; par9 = 1 ; par10 = 0.1 ;
R code (references can be found in the software module):
if(par3!='NA') par3 <- as.numeric(par3) else par3 <- NA
if(par4!='NA') par4 <- as.numeric(par4) else par4 <- NA
par6 <- as.numeric(par6) #Seasonal Period
par9 <- as.numeric(par9) #Forecast Horizon
par10 <- as.numeric(par10) #Alpha
library(forecast)
if (par1 == 'CSV') {
xarr <- read.csv(file=paste('tmp/',par7,'.csv',sep=''),header=T)
numseries <- length(xarr[1,])-1
n <- length(xarr[,1])
nmh <- n - par9
nmhp1 <- nmh + 1
rarr <- array(NA,dim=c(n,numseries))
farr <- array(NA,dim=c(n,numseries))
parr <- array(NA,dim=c(numseries,8))
colnames(parr) = list('ME','RMSE','MAE','MPE','MAPE','MASE','ACF1','TheilU')
for(i in 1:numseries) {
sindex <- i+1
x <- xarr[,sindex]
if(par2=='Croston') {
if (i==1) m <- croston(x,alpha=par10)
if (i==1) mydemand <- m$model$demand[]
fit <- croston(x[1:nmh],h=par9,alpha=par10)
}
if(par2=='ARIMA') {
m <- auto.arima(ts(x,freq=par6),d=par3,D=par4)
mydemand <- forecast(m)
fit <- auto.arima(ts(x[1:nmh],freq=par6),d=par3,D=par4)
}
if(par2=='ETS') {
m <- ets(ts(x,freq=par6),model=par5)
mydemand <- forecast(m)
fit <- ets(ts(x[1:nmh],freq=par6),model=par5)
}
try(rarr[,i] <- mydemand$resid,silent=T)
try(farr[,i] <- mydemand$mean,silent=T)
if (par2!='Croston') parr[i,] <- accuracy(forecast(fit,par9),x[nmhp1:n])
if (par2=='Croston') parr[i,] <- accuracy(fit,x[nmhp1:n])
}
write.csv(farr,file=paste('tmp/',par8,'_f.csv',sep=''))
write.csv(rarr,file=paste('tmp/',par8,'_r.csv',sep=''))
write.csv(parr,file=paste('tmp/',par8,'_p.csv',sep=''))
}
if (par1 == 'Input box') {
numseries <- 1
n <- length(x)
if(par2=='Croston') {
m <- croston(x)
mydemand <- m$model$demand[]
}
if(par2=='ARIMA') {
m <- auto.arima(ts(x,freq=par6),d=par3,D=par4)
mydemand <- forecast(m)
}
if(par2=='ETS') {
m <- ets(ts(x,freq=par6),model=par5)
mydemand <- forecast(m)
}
summary(m)
}
bitmap(file='test1.png')
op <- par(mfrow=c(2,1))
if (par2=='Croston') plot(m)
if ((par2=='ARIMA') | par2=='ETS') plot(forecast(m))
plot(mydemand$resid,type='l',main='Residuals', ylab='residual value', xlab='time')
par(op)
dev.off()
bitmap(file='pic2.png')
op <- par(mfrow=c(2,2))
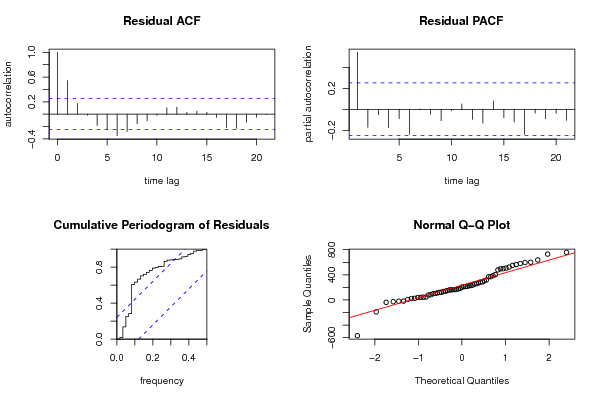
acf(mydemand$resid, lag.max=n/3, main='Residual ACF', ylab='autocorrelation', xlab='time lag')
pacf(mydemand$resid,lag.max=n/3, main='Residual PACF', ylab='partial autocorrelation', xlab='time lag')
cpgram(mydemand$resid, main='Cumulative Periodogram of Residuals')
qqnorm(mydemand$resid); qqline(mydemand$resid, col=2)
par(op)
dev.off()
load(file='createtable')
a<-table.start()
a<-table.row.start(a)
a<-table.element(a,'Demand Forecast',6,TRUE)
a<-table.row.end(a)
a<-table.row.start(a)
a<-table.element(a,'Point',header=TRUE)
a<-table.element(a,'Forecast',header=TRUE)
a<-table.element(a,'95% LB',header=TRUE)
a<-table.element(a,'80% LB',header=TRUE)
a<-table.element(a,'80% UB',header=TRUE)
a<-table.element(a,'95% UB',header=TRUE)
a<-table.row.end(a)
for (i in 1:length(mydemand$mean)) {
a<-table.row.start(a)
a<-table.element(a,i+n,header=TRUE)
a<-table.element(a,as.numeric(mydemand$mean[i]))
a<-table.element(a,as.numeric(mydemand$lower[i,2]))
a<-table.element(a,as.numeric(mydemand$lower[i,1]))
a<-table.element(a,as.numeric(mydemand$upper[i,1]))
a<-table.element(a,as.numeric(mydemand$upper[i,2]))
a<-table.row.end(a)
}
a<-table.end(a)
table.save(a,file='mytable.tab')
a<-table.start()
a<-table.row.start(a)
a<-table.element(a,'What is next?',1,TRUE)
a<-table.row.end(a)
a<-table.row.start(a)
a<-table.element(a,hyperlink(paste('https://automated.biganalytics.eu/Patrick.Wessa/rwasp_demand_forecasting_simulate.wasp',sep=''),'Simulate Time Series','',target=''))
a<-table.row.end(a)
a<-table.row.start(a)
a<-table.element(a,hyperlink(paste('https://automated.biganalytics.eu/Patrick.Wessa/rwasp_demand_forecasting_croston.wasp#output',sep=''),'Generate Forecasts','',target=''))
a<-table.row.end(a)
a<-table.row.start(a)
a<-table.element(a,hyperlink(paste('https://automated.biganalytics.eu/Patrick.Wessa/rwasp_demand_forecasting_analysis.wasp',sep=''),'Forecast Analysis','',target=''))
a<-table.row.end(a)
a<-table.end(a)
table.save(a,file='mytable0.tab')
-SERVER-wessa.org