Free Statistics

of Irreproducible Research!

Author's title

Author*Unverified author*
R Software ModulePatrick.Wessarwasp_demand_forecasting_croston.wasp
Title produced by softwareCroston Forecasting
Date of computationFri, 16 Apr 2010 12:18:06 +0000
Cite this page as followsStatistical Computations at FreeStatistics.org, Office for Research Development and Education, URL https://freestatistics.org/blog/index.php?v=date/2010/Apr/16/t12714203637afknx66s11d2yp.htm/, Retrieved Fri, 29 Mar 2024 07:27:33 +0000
Statistical Computations at FreeStatistics.org, Office for Research Development and Education, URL https://freestatistics.org/blog/index.php?pk=74647, Retrieved Fri, 29 Mar 2024 07:27:33 +0000
QR Codes:

Original text written by user:
IsPrivate?No (this computation is public)
User-defined keywordsmissing,value,b611,steven,coomans,thesis
Estimated Impact251
Family? (F = Feedback message, R = changed R code, M = changed R Module, P = changed Parameters, D = changed Data)
-       [Croston Forecasting] [missing,value,b61...] [2010-04-16 12:18:06] [d41d8cd98f00b204e9800998ecf8427e] [Current]
Feedback Forum

Post a new message
Dataseries X:
46,426
46,855
153,135
64
31
2,25
2,25
2,3
22,6
1,5
10,65
34
81,75
106,5
0,525
24,025
5,25
9
12,8
25,05
0,3
75,75
54,75
1,526


Summary of computational transaction
Raw Inputview raw input (R code)
Raw Outputview raw output of R engine
Computing time2 seconds
R Serverwessa.org @ wessa.org

\begin{tabular}{lllllllll}
\hline
Summary of computational transaction \tabularnewline
Raw Input & view raw input (R code)  \tabularnewline
Raw Output & view raw output of R engine  \tabularnewline
Computing time & 2 seconds \tabularnewline
R Server & wessa.org @ wessa.org \tabularnewline
\hline
\end{tabular}
%Source: https://freestatistics.org/blog/index.php?pk=74647&T=0

[TABLE]
[ROW][C]Summary of computational transaction[/C][/ROW]
[ROW][C]Raw Input[/C][C]view raw input (R code) [/C][/ROW]
[ROW][C]Raw Output[/C][C]view raw output of R engine [/C][/ROW]
[ROW][C]Computing time[/C][C]2 seconds[/C][/ROW]
[ROW][C]R Server[/C][C]wessa.org @ wessa.org[/C][/ROW]
[/TABLE]
Source: https://freestatistics.org/blog/index.php?pk=74647&T=0

Globally Unique Identifier (entire table): ba.freestatistics.org/blog/index.php?pk=74647&T=0

As an alternative you can also use a QR Code:  

The GUIDs for individual cells are displayed in the table below:

Summary of computational transaction
Raw Inputview raw input (R code)
Raw Outputview raw output of R engine
Computing time2 seconds
R Serverwessa.org @ wessa.org


Demand Forecast
PointForecast95% LB80% LB80% UB95% UB
2530.9929215979484-49.1000544245194-21.3770605141583.3629037100468111.085897620416
2630.9929215979484-49.4995231171735-21.638259052743183.6241022486399111.485366313070
2730.9929215979484-49.8970190887545-21.898167698358883.8840108942556111.882862284651
2830.9929215979484-50.2925712798072-22.156805374202284.142648570099112.278414475704
2930.9929215979484-50.686207930108-22.414190545270684.4000337411674112.672051126005
3030.9929215979484-51.0779566021926-22.670341233737384.6561844296341113.063799798089
3130.9929215979484-51.4678442038784-22.925275033678684.9111182295755113.453687399775
3230.9929215979484-51.8558970098331-23.179009125176285.164852321073113.84174020573
3330.9929215979484-52.2421406822376-23.431560287828285.417403483725114.227983878134
3430.9929215979484-52.6266002905903-23.682944913698685.6687881095954114.612443486487

\begin{tabular}{lllllllll}
\hline
Demand Forecast \tabularnewline
Point & Forecast & 95% LB & 80% LB & 80% UB & 95% UB \tabularnewline
25 & 30.9929215979484 & -49.1000544245194 & -21.37706051415 & 83.3629037100468 & 111.085897620416 \tabularnewline
26 & 30.9929215979484 & -49.4995231171735 & -21.6382590527431 & 83.6241022486399 & 111.485366313070 \tabularnewline
27 & 30.9929215979484 & -49.8970190887545 & -21.8981676983588 & 83.8840108942556 & 111.882862284651 \tabularnewline
28 & 30.9929215979484 & -50.2925712798072 & -22.1568053742022 & 84.142648570099 & 112.278414475704 \tabularnewline
29 & 30.9929215979484 & -50.686207930108 & -22.4141905452706 & 84.4000337411674 & 112.672051126005 \tabularnewline
30 & 30.9929215979484 & -51.0779566021926 & -22.6703412337373 & 84.6561844296341 & 113.063799798089 \tabularnewline
31 & 30.9929215979484 & -51.4678442038784 & -22.9252750336786 & 84.9111182295755 & 113.453687399775 \tabularnewline
32 & 30.9929215979484 & -51.8558970098331 & -23.1790091251762 & 85.164852321073 & 113.84174020573 \tabularnewline
33 & 30.9929215979484 & -52.2421406822376 & -23.4315602878282 & 85.417403483725 & 114.227983878134 \tabularnewline
34 & 30.9929215979484 & -52.6266002905903 & -23.6829449136986 & 85.6687881095954 & 114.612443486487 \tabularnewline
\hline
\end{tabular}
%Source: https://freestatistics.org/blog/index.php?pk=74647&T=1

[TABLE]
[ROW][C]Demand Forecast[/C][/ROW]
[ROW][C]Point[/C][C]Forecast[/C][C]95% LB[/C][C]80% LB[/C][C]80% UB[/C][C]95% UB[/C][/ROW]
[ROW][C]25[/C][C]30.9929215979484[/C][C]-49.1000544245194[/C][C]-21.37706051415[/C][C]83.3629037100468[/C][C]111.085897620416[/C][/ROW]
[ROW][C]26[/C][C]30.9929215979484[/C][C]-49.4995231171735[/C][C]-21.6382590527431[/C][C]83.6241022486399[/C][C]111.485366313070[/C][/ROW]
[ROW][C]27[/C][C]30.9929215979484[/C][C]-49.8970190887545[/C][C]-21.8981676983588[/C][C]83.8840108942556[/C][C]111.882862284651[/C][/ROW]
[ROW][C]28[/C][C]30.9929215979484[/C][C]-50.2925712798072[/C][C]-22.1568053742022[/C][C]84.142648570099[/C][C]112.278414475704[/C][/ROW]
[ROW][C]29[/C][C]30.9929215979484[/C][C]-50.686207930108[/C][C]-22.4141905452706[/C][C]84.4000337411674[/C][C]112.672051126005[/C][/ROW]
[ROW][C]30[/C][C]30.9929215979484[/C][C]-51.0779566021926[/C][C]-22.6703412337373[/C][C]84.6561844296341[/C][C]113.063799798089[/C][/ROW]
[ROW][C]31[/C][C]30.9929215979484[/C][C]-51.4678442038784[/C][C]-22.9252750336786[/C][C]84.9111182295755[/C][C]113.453687399775[/C][/ROW]
[ROW][C]32[/C][C]30.9929215979484[/C][C]-51.8558970098331[/C][C]-23.1790091251762[/C][C]85.164852321073[/C][C]113.84174020573[/C][/ROW]
[ROW][C]33[/C][C]30.9929215979484[/C][C]-52.2421406822376[/C][C]-23.4315602878282[/C][C]85.417403483725[/C][C]114.227983878134[/C][/ROW]
[ROW][C]34[/C][C]30.9929215979484[/C][C]-52.6266002905903[/C][C]-23.6829449136986[/C][C]85.6687881095954[/C][C]114.612443486487[/C][/ROW]
[/TABLE]
Source: https://freestatistics.org/blog/index.php?pk=74647&T=1

Globally Unique Identifier (entire table): ba.freestatistics.org/blog/index.php?pk=74647&T=1

As an alternative you can also use a QR Code:  

The GUIDs for individual cells are displayed in the table below:

Demand Forecast
PointForecast95% LB80% LB80% UB95% UB
2530.9929215979484-49.1000544245194-21.3770605141583.3629037100468111.085897620416
2630.9929215979484-49.4995231171735-21.638259052743183.6241022486399111.485366313070
2730.9929215979484-49.8970190887545-21.898167698358883.8840108942556111.882862284651
2830.9929215979484-50.2925712798072-22.156805374202284.142648570099112.278414475704
2930.9929215979484-50.686207930108-22.414190545270684.4000337411674112.672051126005
3030.9929215979484-51.0779566021926-22.670341233737384.6561844296341113.063799798089
3130.9929215979484-51.4678442038784-22.925275033678684.9111182295755113.453687399775
3230.9929215979484-51.8558970098331-23.179009125176285.164852321073113.84174020573
3330.9929215979484-52.2421406822376-23.431560287828285.417403483725114.227983878134
3430.9929215979484-52.6266002905903-23.682944913698685.6687881095954114.612443486487


\begin{tabular}{lllllllll}
\hline
What is next? \tabularnewline
Simulate Time Series \tabularnewline
Generate Forecasts \tabularnewline
Forecast Analysis \tabularnewline
\hline
\end{tabular}
%Source: https://freestatistics.org/blog/index.php?pk=74647&T=2

[TABLE]
[ROW][C]What is next?[/C][/ROW]
[ROW][C]Simulate Time Series[/C][/ROW]
[ROW][C]Generate Forecasts[/C][/ROW]
[ROW][C]Forecast Analysis[/C][/ROW]
[/TABLE]
Source: https://freestatistics.org/blog/index.php?pk=74647&T=2

Globally Unique Identifier (entire table): ba.freestatistics.org/blog/index.php?pk=74647&T=2

As an alternative you can also use a QR Code:  

The GUIDs for individual cells are displayed in the table below:

What is next?
Simulate Time Series
Generate Forecasts
Forecast Analysis


Parameters (Session):
par1 = Input box ; par2 = Croston ; par3 = NA ; par4 = NA ; par5 = ZZZ ; par6 = 12 ; par7 = dum ; par8 = dumresult ; par9 = 1 ; par10 = 0.1 ;
Parameters (R input):
par1 = Input box ; par2 = Croston ; par3 = NA ; par4 = NA ; par5 = ZZZ ; par6 = 12 ; par7 = dum ; par8 = dumresult ; par9 = 1 ; par10 = 0.1 ;
R code (references can be found in the software module):
if(par3!='NA') par3 <- as.numeric(par3) else par3 <- NA
if(par4!='NA') par4 <- as.numeric(par4) else par4 <- NA
par6 <- as.numeric(par6) #Seasonal Period
par9 <- as.numeric(par9) #Forecast Horizon
par10 <- as.numeric(par10) #Alpha
library(forecast)
if (par1 == 'CSV') {
xarr <- read.csv(file=paste('tmp/',par7,'.csv',sep=''),header=T)
numseries <- length(xarr[1,])-1
n <- length(xarr[,1])
nmh <- n - par9
nmhp1 <- nmh + 1
rarr <- array(NA,dim=c(n,numseries))
farr <- array(NA,dim=c(n,numseries))
parr <- array(NA,dim=c(numseries,8))
colnames(parr) = list('ME','RMSE','MAE','MPE','MAPE','MASE','ACF1','TheilU')
for(i in 1:numseries) {
sindex <- i+1
x <- xarr[,sindex]
if(par2=='Croston') {
if (i==1) m <- croston(x,alpha=par10)
if (i==1) mydemand <- m$model$demand[]
fit <- croston(x[1:nmh],h=par9,alpha=par10)
}
if(par2=='ARIMA') {
m <- auto.arima(ts(x,freq=par6),d=par3,D=par4)
mydemand <- forecast(m)
fit <- auto.arima(ts(x[1:nmh],freq=par6),d=par3,D=par4)
}
if(par2=='ETS') {
m <- ets(ts(x,freq=par6),model=par5)
mydemand <- forecast(m)
fit <- ets(ts(x[1:nmh],freq=par6),model=par5)
}
try(rarr[,i] <- mydemand$resid,silent=T)
try(farr[,i] <- mydemand$mean,silent=T)
if (par2!='Croston') parr[i,] <- accuracy(forecast(fit,par9),x[nmhp1:n])
if (par2=='Croston') parr[i,] <- accuracy(fit,x[nmhp1:n])
}
write.csv(farr,file=paste('tmp/',par8,'_f.csv',sep=''))
write.csv(rarr,file=paste('tmp/',par8,'_r.csv',sep=''))
write.csv(parr,file=paste('tmp/',par8,'_p.csv',sep=''))
}
if (par1 == 'Input box') {
numseries <- 1
n <- length(x)
if(par2=='Croston') {
m <- croston(x)
mydemand <- m$model$demand[]
}
if(par2=='ARIMA') {
m <- auto.arima(ts(x,freq=par6),d=par3,D=par4)
mydemand <- forecast(m)
}
if(par2=='ETS') {
m <- ets(ts(x,freq=par6),model=par5)
mydemand <- forecast(m)
}
summary(m)
}
bitmap(file='test1.png')
op <- par(mfrow=c(2,1))
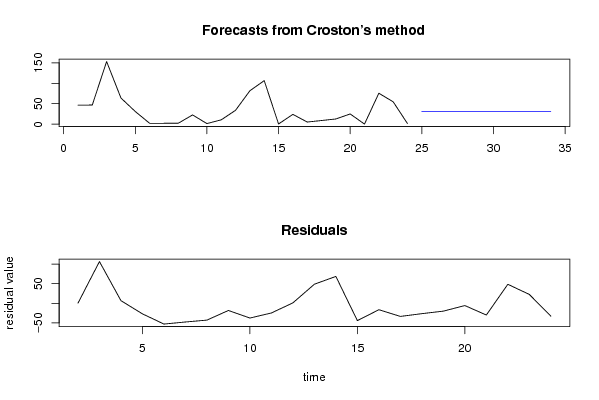
if (par2=='Croston') plot(m)
if ((par2=='ARIMA') | par2=='ETS') plot(forecast(m))
plot(mydemand$resid,type='l',main='Residuals', ylab='residual value', xlab='time')
par(op)
dev.off()
bitmap(file='pic2.png')
op <- par(mfrow=c(2,2))
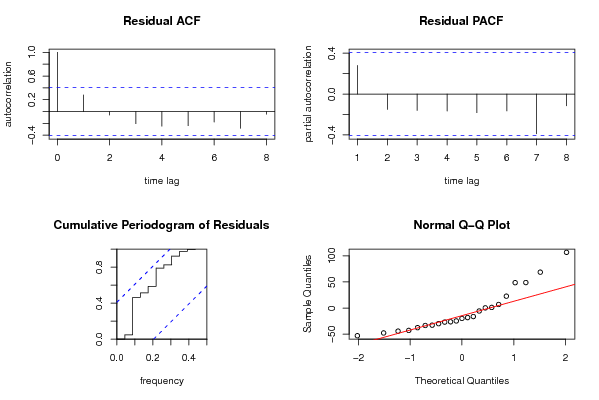
acf(mydemand$resid, lag.max=n/3, main='Residual ACF', ylab='autocorrelation', xlab='time lag')
pacf(mydemand$resid,lag.max=n/3, main='Residual PACF', ylab='partial autocorrelation', xlab='time lag')
cpgram(mydemand$resid, main='Cumulative Periodogram of Residuals')
qqnorm(mydemand$resid); qqline(mydemand$resid, col=2)
par(op)
dev.off()
load(file='createtable')
a<-table.start()
a<-table.row.start(a)
a<-table.element(a,'Demand Forecast',6,TRUE)
a<-table.row.end(a)
a<-table.row.start(a)
a<-table.element(a,'Point',header=TRUE)
a<-table.element(a,'Forecast',header=TRUE)
a<-table.element(a,'95% LB',header=TRUE)
a<-table.element(a,'80% LB',header=TRUE)
a<-table.element(a,'80% UB',header=TRUE)
a<-table.element(a,'95% UB',header=TRUE)
a<-table.row.end(a)
for (i in 1:length(mydemand$mean)) {
a<-table.row.start(a)
a<-table.element(a,i+n,header=TRUE)
a<-table.element(a,as.numeric(mydemand$mean[i]))
a<-table.element(a,as.numeric(mydemand$lower[i,2]))
a<-table.element(a,as.numeric(mydemand$lower[i,1]))
a<-table.element(a,as.numeric(mydemand$upper[i,1]))
a<-table.element(a,as.numeric(mydemand$upper[i,2]))
a<-table.row.end(a)
}
a<-table.end(a)
table.save(a,file='mytable.tab')
a<-table.start()
a<-table.row.start(a)
a<-table.element(a,'What is next?',1,TRUE)
a<-table.row.end(a)
a<-table.row.start(a)
a<-table.element(a,hyperlink(paste('https://automated.biganalytics.eu/Patrick.Wessa/rwasp_demand_forecasting_simulate.wasp',sep=''),'Simulate Time Series','',target=''))
a<-table.row.end(a)
a<-table.row.start(a)
a<-table.element(a,hyperlink(paste('https://automated.biganalytics.eu/Patrick.Wessa/rwasp_demand_forecasting_croston.wasp#output',sep=''),'Generate Forecasts','',target=''))
a<-table.row.end(a)
a<-table.row.start(a)
a<-table.element(a,hyperlink(paste('https://automated.biganalytics.eu/Patrick.Wessa/rwasp_demand_forecasting_analysis.wasp',sep=''),'Forecast Analysis','',target=''))
a<-table.row.end(a)
a<-table.end(a)
table.save(a,file='mytable0.tab')
-SERVER-wessa.org