Free Statistics
of Irreproducible Research!
Description of Statistical Computation | |||||||||||||||||||||||||||||||||||||||
|---|---|---|---|---|---|---|---|---|---|---|---|---|---|---|---|---|---|---|---|---|---|---|---|---|---|---|---|---|---|---|---|---|---|---|---|---|---|---|---|
| Author's title | |||||||||||||||||||||||||||||||||||||||
| Author | *Unverified author* | ||||||||||||||||||||||||||||||||||||||
| R Software Module | rwasp_fitdistrcauchy.wasp | ||||||||||||||||||||||||||||||||||||||
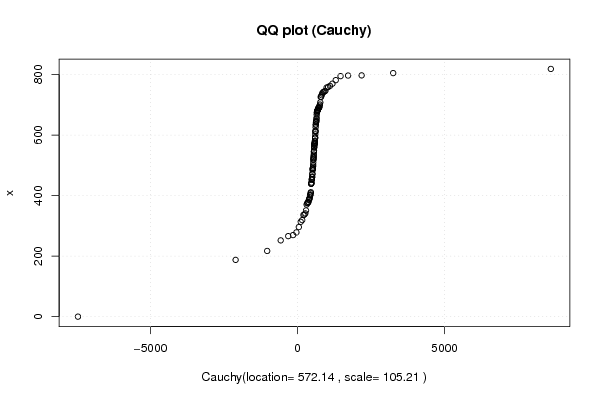
| Title produced by software | Maximum-likelihood Fitting - Cauchy Distribution | ||||||||||||||||||||||||||||||||||||||
| Date of computation | Fri, 16 Apr 2010 12:04:21 +0000 | ||||||||||||||||||||||||||||||||||||||
| Cite this page as follows | Statistical Computations at FreeStatistics.org, Office for Research Development and Education, URL https://freestatistics.org/blog/index.php?v=date/2010/Apr/16/t1271419499l6bhp3dpj0c0myb.htm/, Retrieved Tue, 23 Apr 2024 10:56:04 +0000 | ||||||||||||||||||||||||||||||||||||||
| Statistical Computations at FreeStatistics.org, Office for Research Development and Education, URL https://freestatistics.org/blog/index.php?pk=74645, Retrieved Tue, 23 Apr 2024 10:56:04 +0000 | |||||||||||||||||||||||||||||||||||||||
| QR Codes: | |||||||||||||||||||||||||||||||||||||||
|
| |||||||||||||||||||||||||||||||||||||||
| Original text written by user: | |||||||||||||||||||||||||||||||||||||||
| IsPrivate? | No (this computation is public) | ||||||||||||||||||||||||||||||||||||||
| User-defined keywords | b58a;steven,coomans,cauchy,thesis | ||||||||||||||||||||||||||||||||||||||
| Estimated Impact | 256 | ||||||||||||||||||||||||||||||||||||||
Tree of Dependent Computations | |||||||||||||||||||||||||||||||||||||||
| Family? (F = Feedback message, R = changed R code, M = changed R Module, P = changed Parameters, D = changed Data) | |||||||||||||||||||||||||||||||||||||||
| - [Maximum-likelihood Fitting - Cauchy Distribution] [b58a;steven,cooma...] [2010-04-16 12:04:21] [d41d8cd98f00b204e9800998ecf8427e] [Current] | |||||||||||||||||||||||||||||||||||||||
| Feedback Forum | |||||||||||||||||||||||||||||||||||||||
Post a new message | |||||||||||||||||||||||||||||||||||||||
Dataset | |||||||||||||||||||||||||||||||||||||||
| Dataseries X: | |||||||||||||||||||||||||||||||||||||||
610 544 471.4 696.675 707.9 524.075 471.75 526.625 390.2 451.5 681.875 546.5 488.5 488.5 613.125 439 439 460.625 657.125 570.625 804.575 443 745.775 667.125 590.55 683.125 818.26 679.7 679.7 535.75 579 700.75 567.5 531.25 781.25 572.5 591.5 548.75 744 634.25 634.25 313.25 674.25 769.55 758.25 488.775 690.45 559.5 687.1 796.5 756.65 794.5 0 387.5 683 762.25 742 731.5 643 573.44 574.751 440.025 350.75 562.75 642.251 411 646 558.525 647.15 591 797 642.25 726.275 652.75 678.75 602.25 689.775 393 580.525 462.25 725.65 501 675 691 613.496 688.25 518.8 386.275 491.35 269.5 379 375.25 337.5 296 375 399.525 336 483.5 370.25 625.5 736.75 496.05 740.5 690.525 568.75 341.1 519.75 408.75 278.35 217 266 319.025 454.75 378.3 509.575 453.75 252 187.525 401.5 403.75 | |||||||||||||||||||||||||||||||||||||||
Tables (Output of Computation) | |||||||||||||||||||||||||||||||||||||||
| |||||||||||||||||||||||||||||||||||||||
Figures (Output of Computation) | |||||||||||||||||||||||||||||||||||||||
Input Parameters & R Code | |||||||||||||||||||||||||||||||||||||||
| Parameters (Session): | |||||||||||||||||||||||||||||||||||||||
| Parameters (R input): | |||||||||||||||||||||||||||||||||||||||
| R code (references can be found in the software module): | |||||||||||||||||||||||||||||||||||||||
library(MASS) | |||||||||||||||||||||||||||||||||||||||