Free Statistics

of Irreproducible Research!

Author's title

Author*Unverified author*
R Software ModulePatrick.Wessarwasp_demand_forecasting_croston.wasp
Title produced by softwareCroston Forecasting
Date of computationThu, 15 Apr 2010 11:12:37 +0000
Cite this page as followsStatistical Computations at FreeStatistics.org, Office for Research Development and Education, URL https://freestatistics.org/blog/index.php?v=date/2010/Apr/15/t1271330029z7pjwoxkeoydt1i.htm/, Retrieved Thu, 28 Mar 2024 22:42:57 +0000
Statistical Computations at FreeStatistics.org, Office for Research Development and Education, URL https://freestatistics.org/blog/index.php?pk=74638, Retrieved Thu, 28 Mar 2024 22:42:57 +0000
QR Codes:

Original text written by user:
IsPrivate?No (this computation is public)
User-defined keywordsmisssing,value,B58A
Estimated Impact249
Family? (F = Feedback message, R = changed R code, M = changed R Module, P = changed Parameters, D = changed Data)
-       [Croston Forecasting] [misssing,value,B58A] [2010-04-15 11:12:37] [d41d8cd98f00b204e9800998ecf8427e] [Current]
Feedback Forum

Post a new message
Dataseries X:
610
544
471,4
696,675
707,9
524,075
471,75
526,625
390,2
451,5
681,875
546,5
488,5
488,5
613,125
439
439
460,625
657,125
570,625
804,575
443
745,775
667,125
590,55
683,125
818,26
679,7
679,7
535,75
579
700,75
567,5
531,25
781,25
572,5
591,5
548,75
744
634,25
634,25
313,25
674,25
769,55
758,25
488,775
690,45
559,5
687,1
796,5
756,65
794,5
0
387,5
683
762,25
742
731,5
643
573,44
574,751
440,025
350,75
562,75
642,251
411
646
558,525
647,15
591
797
642,25
726,275
652,75
678,75
602,25
689,775
393
580,525
462,25
725,65
501
675
691


Summary of computational transaction
Raw Inputview raw input (R code)
Raw Outputview raw output of R engine
Computing time4 seconds
R Serverwessa.org @ wessa.org

\begin{tabular}{lllllllll}
\hline
Summary of computational transaction \tabularnewline
Raw Input & view raw input (R code)  \tabularnewline
Raw Output & view raw output of R engine  \tabularnewline
Computing time & 4 seconds \tabularnewline
R Server & wessa.org @ wessa.org \tabularnewline
\hline
\end{tabular}
%Source: https://freestatistics.org/blog/index.php?pk=74638&T=0

[TABLE]
[ROW][C]Summary of computational transaction[/C][/ROW]
[ROW][C]Raw Input[/C][C]view raw input (R code) [/C][/ROW]
[ROW][C]Raw Output[/C][C]view raw output of R engine [/C][/ROW]
[ROW][C]Computing time[/C][C]4 seconds[/C][/ROW]
[ROW][C]R Server[/C][C]wessa.org @ wessa.org[/C][/ROW]
[/TABLE]
Source: https://freestatistics.org/blog/index.php?pk=74638&T=0

Globally Unique Identifier (entire table): ba.freestatistics.org/blog/index.php?pk=74638&T=0

As an alternative you can also use a QR Code:  

The GUIDs for individual cells are displayed in the table below:

Summary of computational transaction
Raw Inputview raw input (R code)
Raw Outputview raw output of R engine
Computing time4 seconds
R Serverwessa.org @ wessa.org


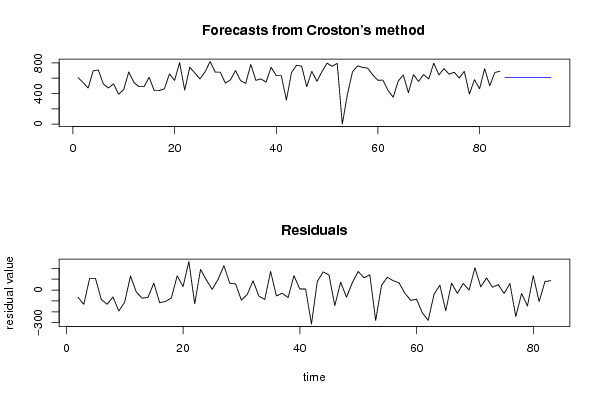
Demand Forecast
PointForecast95% LB80% LB80% UB95% UB
85613.495942208838373.782942747808456.756036698397770.23584771928853.20894166987
86613.495942208838372.587359273920455.974286684221771.017597733456854.404525143756
87613.495942208838371.397680024212455.196397234728771.795487182949855.594204393465
88613.495942208838370.213818381537454.422311714011772.569572703665856.77806603614
89613.495942208838369.035689826108453.651974857552773.339909560124857.956194591569
90613.495942208838367.86321186507452.885332726173774.106551691504859.128672552607
91613.495942208838366.696303965100452.122332661963774.869551755714860.295580452577
92613.495942208838365.534887487847451.362923246069775.628961171607861.45699692983
93613.495942208838364.378885628097450.607054258261776.384830159416862.61299878958
94613.495942208838363.228223354491449.85467663817777.137207779507863.763661063186

\begin{tabular}{lllllllll}
\hline
Demand Forecast \tabularnewline
Point & Forecast & 95% LB & 80% LB & 80% UB & 95% UB \tabularnewline
85 & 613.495942208838 & 373.782942747808 & 456.756036698397 & 770.23584771928 & 853.20894166987 \tabularnewline
86 & 613.495942208838 & 372.587359273920 & 455.974286684221 & 771.017597733456 & 854.404525143756 \tabularnewline
87 & 613.495942208838 & 371.397680024212 & 455.196397234728 & 771.795487182949 & 855.594204393465 \tabularnewline
88 & 613.495942208838 & 370.213818381537 & 454.422311714011 & 772.569572703665 & 856.77806603614 \tabularnewline
89 & 613.495942208838 & 369.035689826108 & 453.651974857552 & 773.339909560124 & 857.956194591569 \tabularnewline
90 & 613.495942208838 & 367.86321186507 & 452.885332726173 & 774.106551691504 & 859.128672552607 \tabularnewline
91 & 613.495942208838 & 366.696303965100 & 452.122332661963 & 774.869551755714 & 860.295580452577 \tabularnewline
92 & 613.495942208838 & 365.534887487847 & 451.362923246069 & 775.628961171607 & 861.45699692983 \tabularnewline
93 & 613.495942208838 & 364.378885628097 & 450.607054258261 & 776.384830159416 & 862.61299878958 \tabularnewline
94 & 613.495942208838 & 363.228223354491 & 449.85467663817 & 777.137207779507 & 863.763661063186 \tabularnewline
\hline
\end{tabular}
%Source: https://freestatistics.org/blog/index.php?pk=74638&T=1

[TABLE]
[ROW][C]Demand Forecast[/C][/ROW]
[ROW][C]Point[/C][C]Forecast[/C][C]95% LB[/C][C]80% LB[/C][C]80% UB[/C][C]95% UB[/C][/ROW]
[ROW][C]85[/C][C]613.495942208838[/C][C]373.782942747808[/C][C]456.756036698397[/C][C]770.23584771928[/C][C]853.20894166987[/C][/ROW]
[ROW][C]86[/C][C]613.495942208838[/C][C]372.587359273920[/C][C]455.974286684221[/C][C]771.017597733456[/C][C]854.404525143756[/C][/ROW]
[ROW][C]87[/C][C]613.495942208838[/C][C]371.397680024212[/C][C]455.196397234728[/C][C]771.795487182949[/C][C]855.594204393465[/C][/ROW]
[ROW][C]88[/C][C]613.495942208838[/C][C]370.213818381537[/C][C]454.422311714011[/C][C]772.569572703665[/C][C]856.77806603614[/C][/ROW]
[ROW][C]89[/C][C]613.495942208838[/C][C]369.035689826108[/C][C]453.651974857552[/C][C]773.339909560124[/C][C]857.956194591569[/C][/ROW]
[ROW][C]90[/C][C]613.495942208838[/C][C]367.86321186507[/C][C]452.885332726173[/C][C]774.106551691504[/C][C]859.128672552607[/C][/ROW]
[ROW][C]91[/C][C]613.495942208838[/C][C]366.696303965100[/C][C]452.122332661963[/C][C]774.869551755714[/C][C]860.295580452577[/C][/ROW]
[ROW][C]92[/C][C]613.495942208838[/C][C]365.534887487847[/C][C]451.362923246069[/C][C]775.628961171607[/C][C]861.45699692983[/C][/ROW]
[ROW][C]93[/C][C]613.495942208838[/C][C]364.378885628097[/C][C]450.607054258261[/C][C]776.384830159416[/C][C]862.61299878958[/C][/ROW]
[ROW][C]94[/C][C]613.495942208838[/C][C]363.228223354491[/C][C]449.85467663817[/C][C]777.137207779507[/C][C]863.763661063186[/C][/ROW]
[/TABLE]
Source: https://freestatistics.org/blog/index.php?pk=74638&T=1

Globally Unique Identifier (entire table): ba.freestatistics.org/blog/index.php?pk=74638&T=1

As an alternative you can also use a QR Code:  

The GUIDs for individual cells are displayed in the table below:

Demand Forecast
PointForecast95% LB80% LB80% UB95% UB
85613.495942208838373.782942747808456.756036698397770.23584771928853.20894166987
86613.495942208838372.587359273920455.974286684221771.017597733456854.404525143756
87613.495942208838371.397680024212455.196397234728771.795487182949855.594204393465
88613.495942208838370.213818381537454.422311714011772.569572703665856.77806603614
89613.495942208838369.035689826108453.651974857552773.339909560124857.956194591569
90613.495942208838367.86321186507452.885332726173774.106551691504859.128672552607
91613.495942208838366.696303965100452.122332661963774.869551755714860.295580452577
92613.495942208838365.534887487847451.362923246069775.628961171607861.45699692983
93613.495942208838364.378885628097450.607054258261776.384830159416862.61299878958
94613.495942208838363.228223354491449.85467663817777.137207779507863.763661063186


\begin{tabular}{lllllllll}
\hline
What is next? \tabularnewline
Simulate Time Series \tabularnewline
Generate Forecasts \tabularnewline
Forecast Analysis \tabularnewline
\hline
\end{tabular}
%Source: https://freestatistics.org/blog/index.php?pk=74638&T=2

[TABLE]
[ROW][C]What is next?[/C][/ROW]
[ROW][C]Simulate Time Series[/C][/ROW]
[ROW][C]Generate Forecasts[/C][/ROW]
[ROW][C]Forecast Analysis[/C][/ROW]
[/TABLE]
Source: https://freestatistics.org/blog/index.php?pk=74638&T=2

Globally Unique Identifier (entire table): ba.freestatistics.org/blog/index.php?pk=74638&T=2

As an alternative you can also use a QR Code:  

The GUIDs for individual cells are displayed in the table below:

What is next?
Simulate Time Series
Generate Forecasts
Forecast Analysis


Parameters (Session):
par1 = Input box ; par2 = Croston ; par3 = NA ; par4 = NA ; par5 = ZZZ ; par6 = 12 ; par9 = 1 ; par10 = 0.1 ;
Parameters (R input):
par1 = Input box ; par2 = Croston ; par3 = NA ; par4 = NA ; par5 = ZZZ ; par6 = 12 ; par7 = ; par8 = ; par9 = 1 ; par10 = 0.1 ;
R code (references can be found in the software module):
if(par3!='NA') par3 <- as.numeric(par3) else par3 <- NA
if(par4!='NA') par4 <- as.numeric(par4) else par4 <- NA
par6 <- as.numeric(par6) #Seasonal Period
par9 <- as.numeric(par9) #Forecast Horizon
par10 <- as.numeric(par10) #Alpha
library(forecast)
if (par1 == 'CSV') {
xarr <- read.csv(file=paste('tmp/',par7,'.csv',sep=''),header=T)
numseries <- length(xarr[1,])-1
n <- length(xarr[,1])
nmh <- n - par9
nmhp1 <- nmh + 1
rarr <- array(NA,dim=c(n,numseries))
farr <- array(NA,dim=c(n,numseries))
parr <- array(NA,dim=c(numseries,8))
colnames(parr) = list('ME','RMSE','MAE','MPE','MAPE','MASE','ACF1','TheilU')
for(i in 1:numseries) {
sindex <- i+1
x <- xarr[,sindex]
if(par2=='Croston') {
if (i==1) m <- croston(x,alpha=par10)
if (i==1) mydemand <- m$model$demand[]
fit <- croston(x[1:nmh],h=par9,alpha=par10)
}
if(par2=='ARIMA') {
m <- auto.arima(ts(x,freq=par6),d=par3,D=par4)
mydemand <- forecast(m)
fit <- auto.arima(ts(x[1:nmh],freq=par6),d=par3,D=par4)
}
if(par2=='ETS') {
m <- ets(ts(x,freq=par6),model=par5)
mydemand <- forecast(m)
fit <- ets(ts(x[1:nmh],freq=par6),model=par5)
}
try(rarr[,i] <- mydemand$resid,silent=T)
try(farr[,i] <- mydemand$mean,silent=T)
if (par2!='Croston') parr[i,] <- accuracy(forecast(fit,par9),x[nmhp1:n])
if (par2=='Croston') parr[i,] <- accuracy(fit,x[nmhp1:n])
}
write.csv(farr,file=paste('tmp/',par8,'_f.csv',sep=''))
write.csv(rarr,file=paste('tmp/',par8,'_r.csv',sep=''))
write.csv(parr,file=paste('tmp/',par8,'_p.csv',sep=''))
}
if (par1 == 'Input box') {
numseries <- 1
n <- length(x)
if(par2=='Croston') {
m <- croston(x)
mydemand <- m$model$demand[]
}
if(par2=='ARIMA') {
m <- auto.arima(ts(x,freq=par6),d=par3,D=par4)
mydemand <- forecast(m)
}
if(par2=='ETS') {
m <- ets(ts(x,freq=par6),model=par5)
mydemand <- forecast(m)
}
summary(m)
}
bitmap(file='test1.png')
op <- par(mfrow=c(2,1))
if (par2=='Croston') plot(m)
if ((par2=='ARIMA') | par2=='ETS') plot(forecast(m))
plot(mydemand$resid,type='l',main='Residuals', ylab='residual value', xlab='time')
par(op)
dev.off()
bitmap(file='pic2.png')
op <- par(mfrow=c(2,2))
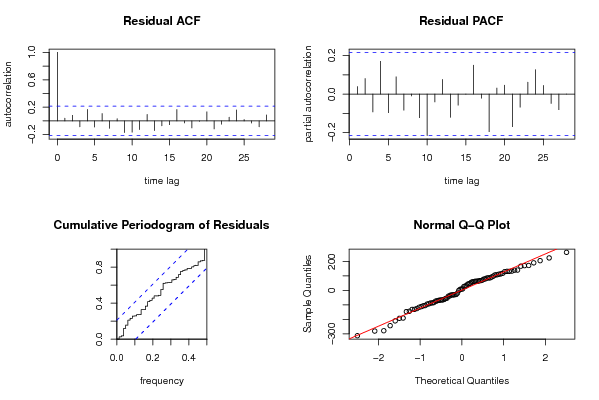
acf(mydemand$resid, lag.max=n/3, main='Residual ACF', ylab='autocorrelation', xlab='time lag')
pacf(mydemand$resid,lag.max=n/3, main='Residual PACF', ylab='partial autocorrelation', xlab='time lag')
cpgram(mydemand$resid, main='Cumulative Periodogram of Residuals')
qqnorm(mydemand$resid); qqline(mydemand$resid, col=2)
par(op)
dev.off()
load(file='createtable')
a<-table.start()
a<-table.row.start(a)
a<-table.element(a,'Demand Forecast',6,TRUE)
a<-table.row.end(a)
a<-table.row.start(a)
a<-table.element(a,'Point',header=TRUE)
a<-table.element(a,'Forecast',header=TRUE)
a<-table.element(a,'95% LB',header=TRUE)
a<-table.element(a,'80% LB',header=TRUE)
a<-table.element(a,'80% UB',header=TRUE)
a<-table.element(a,'95% UB',header=TRUE)
a<-table.row.end(a)
for (i in 1:length(mydemand$mean)) {
a<-table.row.start(a)
a<-table.element(a,i+n,header=TRUE)
a<-table.element(a,as.numeric(mydemand$mean[i]))
a<-table.element(a,as.numeric(mydemand$lower[i,2]))
a<-table.element(a,as.numeric(mydemand$lower[i,1]))
a<-table.element(a,as.numeric(mydemand$upper[i,1]))
a<-table.element(a,as.numeric(mydemand$upper[i,2]))
a<-table.row.end(a)
}
a<-table.end(a)
table.save(a,file='mytable.tab')
a<-table.start()
a<-table.row.start(a)
a<-table.element(a,'What is next?',1,TRUE)
a<-table.row.end(a)
a<-table.row.start(a)
a<-table.element(a,hyperlink(paste('https://automated.biganalytics.eu/Patrick.Wessa/rwasp_demand_forecasting_simulate.wasp',sep=''),'Simulate Time Series','',target=''))
a<-table.row.end(a)
a<-table.row.start(a)
a<-table.element(a,hyperlink(paste('https://automated.biganalytics.eu/Patrick.Wessa/rwasp_demand_forecasting_croston.wasp#output',sep=''),'Generate Forecasts','',target=''))
a<-table.row.end(a)
a<-table.row.start(a)
a<-table.element(a,hyperlink(paste('https://automated.biganalytics.eu/Patrick.Wessa/rwasp_demand_forecasting_analysis.wasp',sep=''),'Forecast Analysis','',target=''))
a<-table.row.end(a)
a<-table.end(a)
table.save(a,file='mytable0.tab')
-SERVER-wessa.org