Free Statistics

of Irreproducible Research!

Author's title

Author*Unverified author*
R Software ModulePatrick.Wessarwasp_demand_forecasting_simulate.wasp
Title produced by softwareDemand Simulation
Date of computationWed, 14 Apr 2010 23:56:06 +0000
Cite this page as followsStatistical Computations at FreeStatistics.org, Office for Research Development and Education, URL https://freestatistics.org/blog/index.php?v=date/2010/Apr/15/t1271289881zbkddnmtvozbef7.htm/, Retrieved Thu, 25 Apr 2024 12:14:25 +0000
Statistical Computations at FreeStatistics.org, Office for Research Development and Education, URL https://freestatistics.org/blog/index.php?pk=74632, Retrieved Thu, 25 Apr 2024 12:14:25 +0000
QR Codes:

Original text written by user:
IsPrivate?No (this computation is public)
User-defined keywords
Estimated Impact246
Family? (F = Feedback message, R = changed R code, M = changed R Module, P = changed Parameters, D = changed Data)
-       [Demand Simulation] [Voorbeeld Stap 1] [2010-04-14 23:56:06] [d41d8cd98f00b204e9800998ecf8427e] [Current]
Feedback Forum

Post a new message


Summary of computational transaction
Raw Inputview raw input (R code)
Raw Outputview raw output of R engine
Computing time4 seconds
R Serverwessa.org @ wessa.org

\begin{tabular}{lllllllll}
\hline
Summary of computational transaction \tabularnewline
Raw Input & view raw input (R code)  \tabularnewline
Raw Output & view raw output of R engine  \tabularnewline
Computing time & 4 seconds \tabularnewline
R Server & wessa.org @ wessa.org \tabularnewline
\hline
\end{tabular}
%Source: https://freestatistics.org/blog/index.php?pk=74632&T=0

[TABLE]
[ROW][C]Summary of computational transaction[/C][/ROW]
[ROW][C]Raw Input[/C][C]view raw input (R code) [/C][/ROW]
[ROW][C]Raw Output[/C][C]view raw output of R engine [/C][/ROW]
[ROW][C]Computing time[/C][C]4 seconds[/C][/ROW]
[ROW][C]R Server[/C][C]wessa.org @ wessa.org[/C][/ROW]
[/TABLE]
Source: https://freestatistics.org/blog/index.php?pk=74632&T=0

Globally Unique Identifier (entire table): ba.freestatistics.org/blog/index.php?pk=74632&T=0

As an alternative you can also use a QR Code:  

The GUIDs for individual cells are displayed in the table below:

Summary of computational transaction
Raw Inputview raw input (R code)
Raw Outputview raw output of R engine
Computing time4 seconds
R Serverwessa.org @ wessa.org


\begin{tabular}{lllllllll}
\hline
What is next? \tabularnewline
Simulate Time Series \tabularnewline
Generate Forecasts \tabularnewline
Forecast Analysis \tabularnewline
\hline
\end{tabular}
%Source: https://freestatistics.org/blog/index.php?pk=74632&T=1

[TABLE]
[ROW][C]What is next?[/C][/ROW]
[ROW][C]Simulate Time Series[/C][/ROW]
[ROW][C]Generate Forecasts[/C][/ROW]
[ROW][C]Forecast Analysis[/C][/ROW]
[/TABLE]
Source: https://freestatistics.org/blog/index.php?pk=74632&T=1

Globally Unique Identifier (entire table): ba.freestatistics.org/blog/index.php?pk=74632&T=1

As an alternative you can also use a QR Code:  

The GUIDs for individual cells are displayed in the table below:

What is next?
Simulate Time Series
Generate Forecasts
Forecast Analysis


Parameters (Session):
par1 = Poisson (lambda) ; par2 = 150 ; par3 = 1 ; par8 = 20 ; par9 = voorbeeld ;
Parameters (R input):
par1 = Poisson (lambda) ; par2 = 150 ; par3 = 1 ; par4 = ; par5 = ; par6 = ; par7 = ; par8 = 20 ; par9 = voorbeeld ;
R code (references can be found in the software module):
library(MASS)
library(gamlss.dist)
par2 <- as.numeric(par2) #length
par8 <- as.numeric(par8) #instances
xarr <- array(NA,dim=c(par2,par8))
if (par1 == 'Poisson (lambda)') {
if (par3=='') par3 <- '0.3'
par3 <- as.numeric(par3)
for(i in 1:par8) {
xarr[,i] <- rpois(par2, lambda=par3)
}
x <- xarr[,1]
}
if (par1 == 'Normal (mu; sigma)') {
if (par3=='') par3 <- '0'
if (par4=='') par4 <- '1'
par3 <- as.numeric(par3)
par4 <- as.numeric(par4)
for(i in 1:par8) {
xarr[,i] <- rnorm(par2, mean=par3, sd=par4)
}
x <- xarr[,1]
}
if (par1 == 'Lognormal (mu; sigma)') {
if (par3=='') par3 <- '0'
if (par4=='') par4 <- '1'
par3 <- as.numeric(par3)
par4 <- as.numeric(par4)
for(i in 1:par8) {
xarr[,i] <- rlnorm(par2, mean=par3, sd=par4)
}
x <- xarr[,1]
}
if (par1 == 'Negative Binomial (mu; theta)') {
if (par3=='') par3 <- '1'
if (par4=='') par4 <- '4'
par3 <- as.numeric(par3)
par4 <- as.numeric(par4)
for(i in 1:par8) {
xarr[,i] <- rnegbin(par2, mu=par3, theta=par4)
}
x <- xarr[,1]
}
if (par1 == 'Zero-Inflated Poisson (mu; sigma)') {
if (par3=='') par3 <- '5'
if (par4=='') par4 <- '0.1'
par3 <- as.numeric(par3)
par4 <- as.numeric(par4)
for(i in 1:par8) {
xarr[,i] <- rZIP(par2, mu=par3, sigma=par4)
}
x <- xarr[,1]
}
if (par1 == 'Sichel - Generalized Inverse Gaussian (mu; sigma; nu)') {
if (par3=='') par3 <- '0.5'
if (par4=='') par4 <- '0.02'
if (par5=='') par5 <- '-0.5'
par3 <- as.numeric(par3)
par4 <- as.numeric(par4)
par5 <- as.numeric(par5)
for(i in 1:par8) {
xarr[,i] <- rSI(par2, mu=par3, sigma=par4, nu=par5)
}
x <- xarr[,1]
}
if (par1 == 'Sichel2 - Generalized Inverse Gaussian (mu; sigma; nu; max.value)') {
if (par3=='') par3 <- '0.5'
if (par4=='') par4 <- '0.02'
if (par5=='') par5 <- '-0.5'
if (par6=='') par6 <- '10000'
par3 <- as.numeric(par3)
par4 <- as.numeric(par4)
par5 <- as.numeric(par5)
par6 <- as.numeric(par6)
for(i in 1:par8) {
xarr[,i] <- rSICHEL(par2, mu=par3, sigma=par4, nu=par5, max.value=par6)
}
x <- xarr[,1]
}
x
write.csv(xarr,file=paste('tmp/',par9,'.csv',sep=''))
bitmap(file='test0.png')
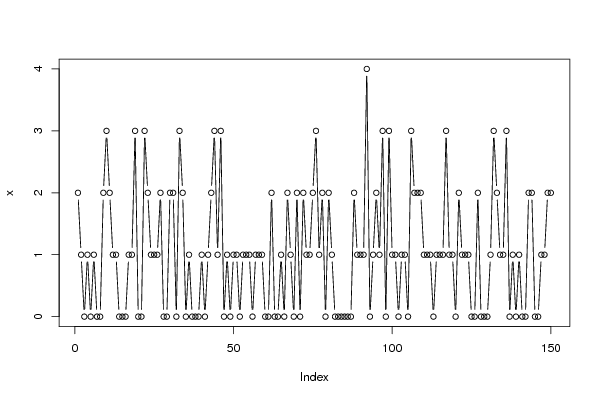
plot(x,type='b')
dev.off()
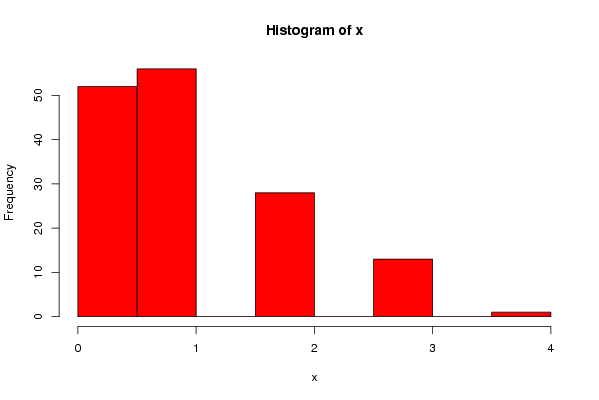
bitmap(file='test1.png')
myhist<-hist(x,col=2)
dev.off()
load(file='createtable')
a<-table.start()
a<-table.row.start(a)
a<-table.element(a,'What is next?',1,TRUE)
a<-table.row.end(a)
a<-table.row.start(a)
a<-table.element(a,hyperlink(paste('https://automated.biganalytics.eu/Patrick.Wessa/rwasp_demand_forecasting_simulate.wasp#output',sep=''),'Simulate Time Series','',target=''))
a<-table.row.end(a)
a<-table.row.start(a)
a<-table.element(a,hyperlink(paste('https://automated.biganalytics.eu/Patrick.Wessa/rwasp_demand_forecasting_croston.wasp',sep=''),'Generate Forecasts','',target=''))
a<-table.row.end(a)
a<-table.row.start(a)
a<-table.element(a,hyperlink(paste('https://automated.biganalytics.eu/Patrick.Wessa/rwasp_demand_forecasting_analysis.wasp',sep=''),'Forecast Analysis','',target=''))
a<-table.row.end(a)
a<-table.end(a)
table.save(a,file='mytable.tab')
-SERVER-wessa.org