Free Statistics
of Irreproducible Research!
Description of Statistical Computation | |||||||||||||||||||||||||||||||||||||||
|---|---|---|---|---|---|---|---|---|---|---|---|---|---|---|---|---|---|---|---|---|---|---|---|---|---|---|---|---|---|---|---|---|---|---|---|---|---|---|---|
| Author's title | |||||||||||||||||||||||||||||||||||||||
| Author | *Unverified author* | ||||||||||||||||||||||||||||||||||||||
| R Software Module | rwasp_fitdistrnorm.wasp | ||||||||||||||||||||||||||||||||||||||
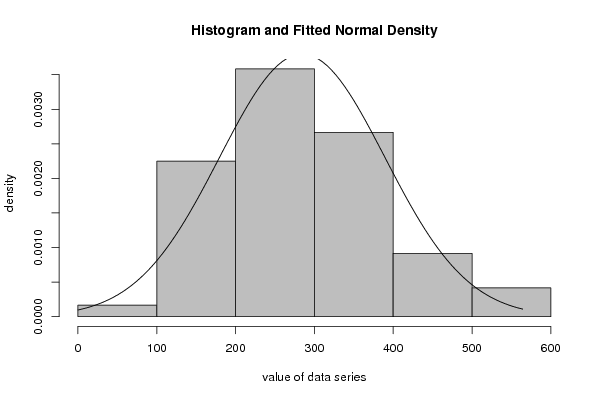
| Title produced by software | Maximum-likelihood Fitting - Normal Distribution | ||||||||||||||||||||||||||||||||||||||
| Date of computation | Fri, 09 Apr 2010 13:02:58 +0000 | ||||||||||||||||||||||||||||||||||||||
| Cite this page as follows | Statistical Computations at FreeStatistics.org, Office for Research Development and Education, URL https://freestatistics.org/blog/index.php?v=date/2010/Apr/09/t1270818262ovj3gb3xnmewmcg.htm/, Retrieved Wed, 09 Jul 2025 11:49:11 +0000 | ||||||||||||||||||||||||||||||||||||||
| Statistical Computations at FreeStatistics.org, Office for Research Development and Education, URL https://freestatistics.org/blog/index.php?pk=74624, Retrieved Wed, 09 Jul 2025 11:49:11 +0000 | |||||||||||||||||||||||||||||||||||||||
| QR Codes: | |||||||||||||||||||||||||||||||||||||||
|
| |||||||||||||||||||||||||||||||||||||||
| Original text written by user: | |||||||||||||||||||||||||||||||||||||||
| IsPrivate? | No (this computation is public) | ||||||||||||||||||||||||||||||||||||||
| User-defined keywords | B521, steven, coomans, normaal, thesis | ||||||||||||||||||||||||||||||||||||||
| Estimated Impact | 323 | ||||||||||||||||||||||||||||||||||||||
Tree of Dependent Computations | |||||||||||||||||||||||||||||||||||||||
| Family? (F = Feedback message, R = changed R code, M = changed R Module, P = changed Parameters, D = changed Data) | |||||||||||||||||||||||||||||||||||||||
| - [Maximum-likelihood Fitting - Normal Distribution] [b382, normaal ver...] [2010-04-06 10:35:09] [74be16979710d4c4e7c6647856088456] - PD [Maximum-likelihood Fitting - Normal Distribution] [B521, steven, coo...] [2010-04-09 13:02:58] [d41d8cd98f00b204e9800998ecf8427e] [Current] | |||||||||||||||||||||||||||||||||||||||
| Feedback Forum | |||||||||||||||||||||||||||||||||||||||
Post a new message | |||||||||||||||||||||||||||||||||||||||
Dataset | |||||||||||||||||||||||||||||||||||||||
| Dataseries X: | |||||||||||||||||||||||||||||||||||||||
202,5 77,625 217,725 146,625 177,375 136,6 156,5 206,125 173,5 255,15 147,375 222,45 212,5 212,5 220,625 160 160 141,125 196,25 149,375 298,75 154,25 249,5 240,05 271,75 171 278,5 331,5 331,5 333,75 169,15 196,75 268,5 247 250,25 196,5 200,85 192,75 161 270,55 270,55 308 286,2 301,95 364,825 279 261,246 306 268,075 402,05 225,525 359,25 0 250 400,3 432,5 347,2 422,5 330,5 339,175 205,8 377,535 320 356,55 314,9 282,125 440,5 378,1 391,85 292,775 387 295,5 343,35 264,025 322,5 392,5 315,75 274,4 361,875 411,276 518,775 392,55 467 382,852 372,343 564,252 417 450,8 538,675 394 532 461,4 523 405,9 386,25 384,5 382 381,75 151,5 287,775 247,6 290,35 266,55 318,025 213,3 148,75 273 282,25 191,25 142,25 259,25 272,75 173,75 204,75 185,525 267,175 190,25 127,25 183,5 254,125 | |||||||||||||||||||||||||||||||||||||||
Tables (Output of Computation) | |||||||||||||||||||||||||||||||||||||||
| |||||||||||||||||||||||||||||||||||||||
Figures (Output of Computation) | |||||||||||||||||||||||||||||||||||||||
Input Parameters & R Code | |||||||||||||||||||||||||||||||||||||||
| Parameters (Session): | |||||||||||||||||||||||||||||||||||||||
| Parameters (R input): | |||||||||||||||||||||||||||||||||||||||
| par1 = 8 ; par2 = 0 ; | |||||||||||||||||||||||||||||||||||||||
| R code (references can be found in the software module): | |||||||||||||||||||||||||||||||||||||||
library(MASS) | |||||||||||||||||||||||||||||||||||||||