Free Statistics

of Irreproducible Research!

Author's title

Author*Unverified author*
R Software ModulePatrick.Wessarwasp_demand_forecasting_croston.wasp
Title produced by softwareCroston Forecasting
Date of computationFri, 09 Apr 2010 12:58:44 +0000
Cite this page as followsStatistical Computations at FreeStatistics.org, Office for Research Development and Education, URL https://freestatistics.org/blog/index.php?v=date/2010/Apr/09/t127081807947jcxo28rlvj8n5.htm/, Retrieved Fri, 26 Apr 2024 07:46:50 +0000
Statistical Computations at FreeStatistics.org, Office for Research Development and Education, URL https://freestatistics.org/blog/index.php?pk=74623, Retrieved Fri, 26 Apr 2024 07:46:50 +0000
QR Codes:

Original text written by user:
IsPrivate?No (this computation is public)
User-defined keywordsmissing value, B521, steven, coomans, thesis
Estimated Impact239
Family? (F = Feedback message, R = changed R code, M = changed R Module, P = changed Parameters, D = changed Data)
-     [Maximum-likelihood Fitting - Normal Distribution] [b382, normaal ver...] [2010-04-06 10:35:09] [74be16979710d4c4e7c6647856088456]
- RMPD    [Croston Forecasting] [missing value, B5...] [2010-04-09 12:58:44] [d41d8cd98f00b204e9800998ecf8427e] [Current]
Feedback Forum

Post a new message
Dataseries X:
202,5
77,625
217,725
146,625
177,375
136,6
156,5
206,125
173,5
255,15
147,375
222,45
212,5
212,5
220,625
160
160
141,125
196,25
149,375
298,75
154,25
249,5
240,05
271,75
171
278,5
331,5
331,5
333,75
169,15
196,75
268,5
247
250,25
196,5
200,85
192,75
161
270,55
270,55
308
286,2
301,95
364,825
279
261,246
306
268,075
402,05
225,525
359,25
0
250
400,3
432,5
347,2
422,5
330,5
339,175
205,8
377,535
320
356,55
314,9
282,125
440,5
378,1
391,85
292,775
387
295,5
343,35
264,025
322,5
392,5
315,75
274,4
361,875
411,276
518,775
392,55
467
382,852


Summary of computational transaction
Raw Inputview raw input (R code)
Raw Outputview raw output of R engine
Computing time5 seconds
R Serverwessa.org @ wessa.org

\begin{tabular}{lllllllll}
\hline
Summary of computational transaction \tabularnewline
Raw Input & view raw input (R code)  \tabularnewline
Raw Output & view raw output of R engine  \tabularnewline
Computing time & 5 seconds \tabularnewline
R Server & wessa.org @ wessa.org \tabularnewline
\hline
\end{tabular}
%Source: https://freestatistics.org/blog/index.php?pk=74623&T=0

[TABLE]
[ROW][C]Summary of computational transaction[/C][/ROW]
[ROW][C]Raw Input[/C][C]view raw input (R code) [/C][/ROW]
[ROW][C]Raw Output[/C][C]view raw output of R engine [/C][/ROW]
[ROW][C]Computing time[/C][C]5 seconds[/C][/ROW]
[ROW][C]R Server[/C][C]wessa.org @ wessa.org[/C][/ROW]
[/TABLE]
Source: https://freestatistics.org/blog/index.php?pk=74623&T=0

Globally Unique Identifier (entire table): ba.freestatistics.org/blog/index.php?pk=74623&T=0

As an alternative you can also use a QR Code:  

The GUIDs for individual cells are displayed in the table below:

Summary of computational transaction
Raw Inputview raw input (R code)
Raw Outputview raw output of R engine
Computing time5 seconds
R Serverwessa.org @ wessa.org


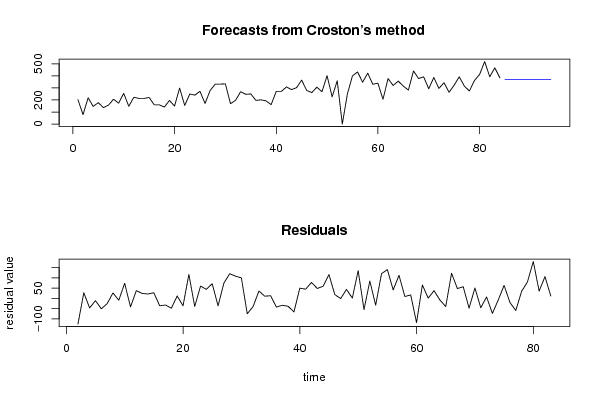
Demand Forecast
PointForecast95% LB80% LB80% UB95% UB
85372.342883537758249.880670861636292.269146666532452.416620408983494.805096213879
86372.342883537758249.269882969530291.86977393034452.815993145175495.415884105985
87372.342883537758248.662111369234291.472373441353453.213393634162496.023655706281
88372.342883537758248.057311810636291.076916265978453.608850809537496.628455264879
89372.342883537758247.455441115099290.683374171223454.002392904292497.230325960416
90372.342883537758246.856457139489290.291719601172454.394047474343497.829309936026
91372.342883537758246.260318741734289.901925654472454.783841421043498.425448333781
92372.342883537758245.666985747851289.513966062767455.171801012748499.018781327664
93372.342883537758245.076418920349289.127815170039455.557951905476499.609348155166
94372.342883537758244.488579927948288.743447912813455.942319162702500.197187147567

\begin{tabular}{lllllllll}
\hline
Demand Forecast \tabularnewline
Point & Forecast & 95% LB & 80% LB & 80% UB & 95% UB \tabularnewline
85 & 372.342883537758 & 249.880670861636 & 292.269146666532 & 452.416620408983 & 494.805096213879 \tabularnewline
86 & 372.342883537758 & 249.269882969530 & 291.86977393034 & 452.815993145175 & 495.415884105985 \tabularnewline
87 & 372.342883537758 & 248.662111369234 & 291.472373441353 & 453.213393634162 & 496.023655706281 \tabularnewline
88 & 372.342883537758 & 248.057311810636 & 291.076916265978 & 453.608850809537 & 496.628455264879 \tabularnewline
89 & 372.342883537758 & 247.455441115099 & 290.683374171223 & 454.002392904292 & 497.230325960416 \tabularnewline
90 & 372.342883537758 & 246.856457139489 & 290.291719601172 & 454.394047474343 & 497.829309936026 \tabularnewline
91 & 372.342883537758 & 246.260318741734 & 289.901925654472 & 454.783841421043 & 498.425448333781 \tabularnewline
92 & 372.342883537758 & 245.666985747851 & 289.513966062767 & 455.171801012748 & 499.018781327664 \tabularnewline
93 & 372.342883537758 & 245.076418920349 & 289.127815170039 & 455.557951905476 & 499.609348155166 \tabularnewline
94 & 372.342883537758 & 244.488579927948 & 288.743447912813 & 455.942319162702 & 500.197187147567 \tabularnewline
\hline
\end{tabular}
%Source: https://freestatistics.org/blog/index.php?pk=74623&T=1

[TABLE]
[ROW][C]Demand Forecast[/C][/ROW]
[ROW][C]Point[/C][C]Forecast[/C][C]95% LB[/C][C]80% LB[/C][C]80% UB[/C][C]95% UB[/C][/ROW]
[ROW][C]85[/C][C]372.342883537758[/C][C]249.880670861636[/C][C]292.269146666532[/C][C]452.416620408983[/C][C]494.805096213879[/C][/ROW]
[ROW][C]86[/C][C]372.342883537758[/C][C]249.269882969530[/C][C]291.86977393034[/C][C]452.815993145175[/C][C]495.415884105985[/C][/ROW]
[ROW][C]87[/C][C]372.342883537758[/C][C]248.662111369234[/C][C]291.472373441353[/C][C]453.213393634162[/C][C]496.023655706281[/C][/ROW]
[ROW][C]88[/C][C]372.342883537758[/C][C]248.057311810636[/C][C]291.076916265978[/C][C]453.608850809537[/C][C]496.628455264879[/C][/ROW]
[ROW][C]89[/C][C]372.342883537758[/C][C]247.455441115099[/C][C]290.683374171223[/C][C]454.002392904292[/C][C]497.230325960416[/C][/ROW]
[ROW][C]90[/C][C]372.342883537758[/C][C]246.856457139489[/C][C]290.291719601172[/C][C]454.394047474343[/C][C]497.829309936026[/C][/ROW]
[ROW][C]91[/C][C]372.342883537758[/C][C]246.260318741734[/C][C]289.901925654472[/C][C]454.783841421043[/C][C]498.425448333781[/C][/ROW]
[ROW][C]92[/C][C]372.342883537758[/C][C]245.666985747851[/C][C]289.513966062767[/C][C]455.171801012748[/C][C]499.018781327664[/C][/ROW]
[ROW][C]93[/C][C]372.342883537758[/C][C]245.076418920349[/C][C]289.127815170039[/C][C]455.557951905476[/C][C]499.609348155166[/C][/ROW]
[ROW][C]94[/C][C]372.342883537758[/C][C]244.488579927948[/C][C]288.743447912813[/C][C]455.942319162702[/C][C]500.197187147567[/C][/ROW]
[/TABLE]
Source: https://freestatistics.org/blog/index.php?pk=74623&T=1

Globally Unique Identifier (entire table): ba.freestatistics.org/blog/index.php?pk=74623&T=1

As an alternative you can also use a QR Code:  

The GUIDs for individual cells are displayed in the table below:

Demand Forecast
PointForecast95% LB80% LB80% UB95% UB
85372.342883537758249.880670861636292.269146666532452.416620408983494.805096213879
86372.342883537758249.269882969530291.86977393034452.815993145175495.415884105985
87372.342883537758248.662111369234291.472373441353453.213393634162496.023655706281
88372.342883537758248.057311810636291.076916265978453.608850809537496.628455264879
89372.342883537758247.455441115099290.683374171223454.002392904292497.230325960416
90372.342883537758246.856457139489290.291719601172454.394047474343497.829309936026
91372.342883537758246.260318741734289.901925654472454.783841421043498.425448333781
92372.342883537758245.666985747851289.513966062767455.171801012748499.018781327664
93372.342883537758245.076418920349289.127815170039455.557951905476499.609348155166
94372.342883537758244.488579927948288.743447912813455.942319162702500.197187147567


\begin{tabular}{lllllllll}
\hline
What is next? \tabularnewline
Simulate Time Series \tabularnewline
Generate Forecasts \tabularnewline
Forecast Analysis \tabularnewline
\hline
\end{tabular}
%Source: https://freestatistics.org/blog/index.php?pk=74623&T=2

[TABLE]
[ROW][C]What is next?[/C][/ROW]
[ROW][C]Simulate Time Series[/C][/ROW]
[ROW][C]Generate Forecasts[/C][/ROW]
[ROW][C]Forecast Analysis[/C][/ROW]
[/TABLE]
Source: https://freestatistics.org/blog/index.php?pk=74623&T=2

Globally Unique Identifier (entire table): ba.freestatistics.org/blog/index.php?pk=74623&T=2

As an alternative you can also use a QR Code:  

The GUIDs for individual cells are displayed in the table below:

What is next?
Simulate Time Series
Generate Forecasts
Forecast Analysis


Parameters (Session):
Parameters (R input):
par1 = Input box ; par2 = Croston ; par3 = NA ; par4 = NA ; par5 = ZZZ ; par6 = 12 ; par7 = dum ; par8 = dumresult ; par9 = 1 ; par10 = 0.1 ;
R code (references can be found in the software module):
if(par3!='NA') par3 <- as.numeric(par3) else par3 <- NA
if(par4!='NA') par4 <- as.numeric(par4) else par4 <- NA
par6 <- as.numeric(par6) #Seasonal Period
par9 <- as.numeric(par9) #Forecast Horizon
par10 <- as.numeric(par10) #Alpha
library(forecast)
if (par1 == 'CSV') {
xarr <- read.csv(file=paste('tmp/',par7,'.csv',sep=''),header=T)
numseries <- length(xarr[1,])-1
n <- length(xarr[,1])
nmh <- n - par9
nmhp1 <- nmh + 1
rarr <- array(NA,dim=c(n,numseries))
farr <- array(NA,dim=c(n,numseries))
parr <- array(NA,dim=c(numseries,8))
colnames(parr) = list('ME','RMSE','MAE','MPE','MAPE','MASE','ACF1','TheilU')
for(i in 1:numseries) {
sindex <- i+1
x <- xarr[,sindex]
if(par2=='Croston') {
if (i==1) m <- croston(x,alpha=par10)
if (i==1) mydemand <- m$model$demand[]
fit <- croston(x[1:nmh],h=par9,alpha=par10)
}
if(par2=='ARIMA') {
m <- auto.arima(ts(x,freq=par6),d=par3,D=par4)
mydemand <- forecast(m)
fit <- auto.arima(ts(x[1:nmh],freq=par6),d=par3,D=par4)
}
if(par2=='ETS') {
m <- ets(ts(x,freq=par6),model=par5)
mydemand <- forecast(m)
fit <- ets(ts(x[1:nmh],freq=par6),model=par5)
}
try(rarr[,i] <- mydemand$resid,silent=T)
try(farr[,i] <- mydemand$mean,silent=T)
if (par2!='Croston') parr[i,] <- accuracy(forecast(fit,par9),x[nmhp1:n])
if (par2=='Croston') parr[i,] <- accuracy(fit,x[nmhp1:n])
}
write.csv(farr,file=paste('tmp/',par8,'_f.csv',sep=''))
write.csv(rarr,file=paste('tmp/',par8,'_r.csv',sep=''))
write.csv(parr,file=paste('tmp/',par8,'_p.csv',sep=''))
}
if (par1 == 'Input box') {
numseries <- 1
n <- length(x)
if(par2=='Croston') {
m <- croston(x)
mydemand <- m$model$demand[]
}
if(par2=='ARIMA') {
m <- auto.arima(ts(x,freq=par6),d=par3,D=par4)
mydemand <- forecast(m)
}
if(par2=='ETS') {
m <- ets(ts(x,freq=par6),model=par5)
mydemand <- forecast(m)
}
summary(m)
}
bitmap(file='test1.png')
op <- par(mfrow=c(2,1))
if (par2=='Croston') plot(m)
if ((par2=='ARIMA') | par2=='ETS') plot(forecast(m))
plot(mydemand$resid,type='l',main='Residuals', ylab='residual value', xlab='time')
par(op)
dev.off()
bitmap(file='pic2.png')
op <- par(mfrow=c(2,2))
acf(mydemand$resid, lag.max=n/3, main='Residual ACF', ylab='autocorrelation', xlab='time lag')
pacf(mydemand$resid,lag.max=n/3, main='Residual PACF', ylab='partial autocorrelation', xlab='time lag')
cpgram(mydemand$resid, main='Cumulative Periodogram of Residuals')
qqnorm(mydemand$resid); qqline(mydemand$resid, col=2)
par(op)
dev.off()
load(file='createtable')
a<-table.start()
a<-table.row.start(a)
a<-table.element(a,'Demand Forecast',6,TRUE)
a<-table.row.end(a)
a<-table.row.start(a)
a<-table.element(a,'Point',header=TRUE)
a<-table.element(a,'Forecast',header=TRUE)
a<-table.element(a,'95% LB',header=TRUE)
a<-table.element(a,'80% LB',header=TRUE)
a<-table.element(a,'80% UB',header=TRUE)
a<-table.element(a,'95% UB',header=TRUE)
a<-table.row.end(a)
for (i in 1:length(mydemand$mean)) {
a<-table.row.start(a)
a<-table.element(a,i+n,header=TRUE)
a<-table.element(a,as.numeric(mydemand$mean[i]))
a<-table.element(a,as.numeric(mydemand$lower[i,2]))
a<-table.element(a,as.numeric(mydemand$lower[i,1]))
a<-table.element(a,as.numeric(mydemand$upper[i,1]))
a<-table.element(a,as.numeric(mydemand$upper[i,2]))
a<-table.row.end(a)
}
a<-table.end(a)
table.save(a,file='mytable.tab')
a<-table.start()
a<-table.row.start(a)
a<-table.element(a,'What is next?',1,TRUE)
a<-table.row.end(a)
a<-table.row.start(a)
a<-table.element(a,hyperlink(paste('https://automated.biganalytics.eu/Patrick.Wessa/rwasp_demand_forecasting_simulate.wasp',sep=''),'Simulate Time Series','',target=''))
a<-table.row.end(a)
a<-table.row.start(a)
a<-table.element(a,hyperlink(paste('https://automated.biganalytics.eu/Patrick.Wessa/rwasp_demand_forecasting_croston.wasp#output',sep=''),'Generate Forecasts','',target=''))
a<-table.row.end(a)
a<-table.row.start(a)
a<-table.element(a,hyperlink(paste('https://automated.biganalytics.eu/Patrick.Wessa/rwasp_demand_forecasting_analysis.wasp',sep=''),'Forecast Analysis','',target=''))
a<-table.row.end(a)
a<-table.end(a)
table.save(a,file='mytable0.tab')
-SERVER-wessa.org