\begin{tabular}{lllllllll}
\hline
Summary of computational transaction \tabularnewline
Raw Input & view raw input (R code)  \tabularnewline
Raw Output & view raw output of R engine  \tabularnewline
Computing time & 3 seconds \tabularnewline
R Server & 'Herman Ole Andreas Wold' @ 193.190.124.10:1001 \tabularnewline
\hline
\end{tabular}
%Source: https://freestatistics.org/blog/index.php?pk=74613&T=0
[TABLE]
[ROW][C]Summary of computational transaction[/C][/ROW]
[ROW][C]Raw Input[/C][C]view raw input (R code) [/C][/ROW]
[ROW][C]Raw Output[/C][C]view raw output of R engine [/C][/ROW]
[ROW][C]Computing time[/C][C]3 seconds[/C][/ROW]
[ROW][C]R Server[/C][C]'Herman Ole Andreas Wold' @ 193.190.124.10:1001[/C][/ROW]
[/TABLE]
Source: https://freestatistics.org/blog/index.php?pk=74613&T=0
If you paste this QR Code into your document, anyone with a smartphone or tablet will be able to scan it and view this table in a browser.
If you paste this QR Code into your document, anyone with a smartphone or tablet will be able to scan it and view this table in a browser.
If you paste this QR Code into your document, anyone with a smartphone or tablet will be able to scan it and view this table in a browser.
If you paste this QR Code into your document, anyone with a smartphone or tablet will be able to scan it and view this table in a browser.
If you paste this QR Code into your document, anyone with a smartphone or tablet will be able to scan it and view this table in a browser.
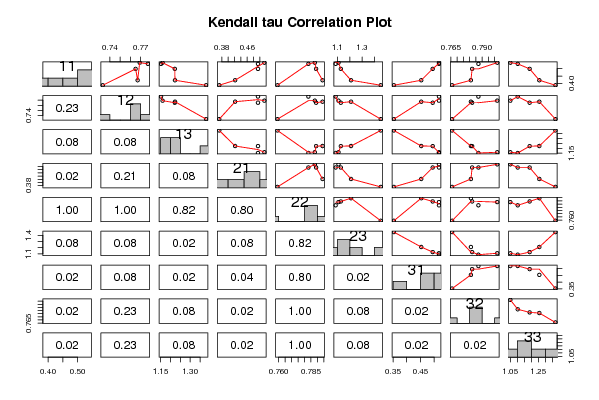
| Kendall tau rank correlations for all pairs of data series | | pair | tau | p-value | | tau( 11 , 12 ) | 0.6 | 0.233333333333333 | | tau( 11 , 13 ) | -0.8 | 0.0833333333333333 | | tau( 11 , 21 ) | 0.948683298050514 | 0.022977401503206 | | tau( 11 , 22 ) | 0 | 1 | | tau( 11 , 23 ) | -0.8 | 0.0833333333333333 | | tau( 11 , 31 ) | 0.948683298050514 | 0.022977401503206 | | tau( 11 , 32 ) | 1 | 0.0166666666666666 | | tau( 11 , 33 ) | -1 | 0.0166666666666667 | | tau( 12 , 13 ) | -0.8 | 0.0833333333333333 | | tau( 12 , 21 ) | 0.52704627669473 | 0.206507295485425 | | tau( 12 , 22 ) | 0 | 1 | | tau( 12 , 23 ) | -0.8 | 0.0833333333333333 | | tau( 12 , 31 ) | 0.737864787372622 | 0.0769741729812667 | | tau( 12 , 32 ) | 0.6 | 0.233333333333333 | | tau( 12 , 33 ) | -0.6 | 0.233333333333333 | | tau( 13 , 21 ) | -0.737864787372622 | 0.0769741729812668 | | tau( 13 , 22 ) | 0.2 | 0.816666666666667 | | tau( 13 , 23 ) | 1 | 0.0166666666666666 | | tau( 13 , 31 ) | -0.948683298050514 | 0.0229774015032061 | | tau( 13 , 32 ) | -0.8 | 0.0833333333333333 | | tau( 13 , 33 ) | 0.8 | 0.0833333333333333 | | tau( 21 , 22 ) | 0.105409255338946 | 0.800542107423126 | | tau( 21 , 23 ) | -0.737864787372622 | 0.0769741729812668 | | tau( 21 , 31 ) | 0.888888888888889 | 0.0373564724455817 | | tau( 21 , 32 ) | 0.948683298050514 | 0.022977401503206 | | tau( 21 , 33 ) | -0.948683298050514 | 0.0229774015032061 | | tau( 22 , 23 ) | 0.2 | 0.816666666666667 | | tau( 22 , 31 ) | -0.105409255338946 | 0.800542107423126 | | tau( 22 , 32 ) | 0 | 1 | | tau( 22 , 33 ) | 0 | 1 | | tau( 23 , 31 ) | -0.948683298050514 | 0.0229774015032061 | | tau( 23 , 32 ) | -0.8 | 0.0833333333333333 | | tau( 23 , 33 ) | 0.8 | 0.0833333333333333 | | tau( 31 , 32 ) | 0.948683298050514 | 0.022977401503206 | | tau( 31 , 33 ) | -0.948683298050514 | 0.0229774015032061 | | tau( 32 , 33 ) | -1 | 0.0166666666666667 |
\begin{tabular}{lllllllll}
\hline
Kendall tau rank correlations for all pairs of data series \tabularnewline
pair & tau & p-value \tabularnewline
tau( 11 , 12 ) & 0.6 & 0.233333333333333 \tabularnewline
tau( 11 , 13 ) & -0.8 & 0.0833333333333333 \tabularnewline
tau( 11 , 21 ) & 0.948683298050514 & 0.022977401503206 \tabularnewline
tau( 11 , 22 ) & 0 & 1 \tabularnewline
tau( 11 , 23 ) & -0.8 & 0.0833333333333333 \tabularnewline
tau( 11 , 31 ) & 0.948683298050514 & 0.022977401503206 \tabularnewline
tau( 11 , 32 ) & 1 & 0.0166666666666666 \tabularnewline
tau( 11 , 33 ) & -1 & 0.0166666666666667 \tabularnewline
tau( 12 , 13 ) & -0.8 & 0.0833333333333333 \tabularnewline
tau( 12 , 21 ) & 0.52704627669473 & 0.206507295485425 \tabularnewline
tau( 12 , 22 ) & 0 & 1 \tabularnewline
tau( 12 , 23 ) & -0.8 & 0.0833333333333333 \tabularnewline
tau( 12 , 31 ) & 0.737864787372622 & 0.0769741729812667 \tabularnewline
tau( 12 , 32 ) & 0.6 & 0.233333333333333 \tabularnewline
tau( 12 , 33 ) & -0.6 & 0.233333333333333 \tabularnewline
tau( 13 , 21 ) & -0.737864787372622 & 0.0769741729812668 \tabularnewline
tau( 13 , 22 ) & 0.2 & 0.816666666666667 \tabularnewline
tau( 13 , 23 ) & 1 & 0.0166666666666666 \tabularnewline
tau( 13 , 31 ) & -0.948683298050514 & 0.0229774015032061 \tabularnewline
tau( 13 , 32 ) & -0.8 & 0.0833333333333333 \tabularnewline
tau( 13 , 33 ) & 0.8 & 0.0833333333333333 \tabularnewline
tau( 21 , 22 ) & 0.105409255338946 & 0.800542107423126 \tabularnewline
tau( 21 , 23 ) & -0.737864787372622 & 0.0769741729812668 \tabularnewline
tau( 21 , 31 ) & 0.888888888888889 & 0.0373564724455817 \tabularnewline
tau( 21 , 32 ) & 0.948683298050514 & 0.022977401503206 \tabularnewline
tau( 21 , 33 ) & -0.948683298050514 & 0.0229774015032061 \tabularnewline
tau( 22 , 23 ) & 0.2 & 0.816666666666667 \tabularnewline
tau( 22 , 31 ) & -0.105409255338946 & 0.800542107423126 \tabularnewline
tau( 22 , 32 ) & 0 & 1 \tabularnewline
tau( 22 , 33 ) & 0 & 1 \tabularnewline
tau( 23 , 31 ) & -0.948683298050514 & 0.0229774015032061 \tabularnewline
tau( 23 , 32 ) & -0.8 & 0.0833333333333333 \tabularnewline
tau( 23 , 33 ) & 0.8 & 0.0833333333333333 \tabularnewline
tau( 31 , 32 ) & 0.948683298050514 & 0.022977401503206 \tabularnewline
tau( 31 , 33 ) & -0.948683298050514 & 0.0229774015032061 \tabularnewline
tau( 32 , 33 ) & -1 & 0.0166666666666667 \tabularnewline
\hline
\end{tabular}
%Source: https://freestatistics.org/blog/index.php?pk=74613&T=1
[TABLE]
[ROW][C]Kendall tau rank correlations for all pairs of data series[/C][/ROW]
[ROW][C]pair[/C][C]tau[/C][C]p-value[/C][/ROW]
[ROW][C]tau( 11 , 12 )[/C][C]0.6[/C][C]0.233333333333333[/C][/ROW]
[ROW][C]tau( 11 , 13 )[/C][C]-0.8[/C][C]0.0833333333333333[/C][/ROW]
[ROW][C]tau( 11 , 21 )[/C][C]0.948683298050514[/C][C]0.022977401503206[/C][/ROW]
[ROW][C]tau( 11 , 22 )[/C][C]0[/C][C]1[/C][/ROW]
[ROW][C]tau( 11 , 23 )[/C][C]-0.8[/C][C]0.0833333333333333[/C][/ROW]
[ROW][C]tau( 11 , 31 )[/C][C]0.948683298050514[/C][C]0.022977401503206[/C][/ROW]
[ROW][C]tau( 11 , 32 )[/C][C]1[/C][C]0.0166666666666666[/C][/ROW]
[ROW][C]tau( 11 , 33 )[/C][C]-1[/C][C]0.0166666666666667[/C][/ROW]
[ROW][C]tau( 12 , 13 )[/C][C]-0.8[/C][C]0.0833333333333333[/C][/ROW]
[ROW][C]tau( 12 , 21 )[/C][C]0.52704627669473[/C][C]0.206507295485425[/C][/ROW]
[ROW][C]tau( 12 , 22 )[/C][C]0[/C][C]1[/C][/ROW]
[ROW][C]tau( 12 , 23 )[/C][C]-0.8[/C][C]0.0833333333333333[/C][/ROW]
[ROW][C]tau( 12 , 31 )[/C][C]0.737864787372622[/C][C]0.0769741729812667[/C][/ROW]
[ROW][C]tau( 12 , 32 )[/C][C]0.6[/C][C]0.233333333333333[/C][/ROW]
[ROW][C]tau( 12 , 33 )[/C][C]-0.6[/C][C]0.233333333333333[/C][/ROW]
[ROW][C]tau( 13 , 21 )[/C][C]-0.737864787372622[/C][C]0.0769741729812668[/C][/ROW]
[ROW][C]tau( 13 , 22 )[/C][C]0.2[/C][C]0.816666666666667[/C][/ROW]
[ROW][C]tau( 13 , 23 )[/C][C]1[/C][C]0.0166666666666666[/C][/ROW]
[ROW][C]tau( 13 , 31 )[/C][C]-0.948683298050514[/C][C]0.0229774015032061[/C][/ROW]
[ROW][C]tau( 13 , 32 )[/C][C]-0.8[/C][C]0.0833333333333333[/C][/ROW]
[ROW][C]tau( 13 , 33 )[/C][C]0.8[/C][C]0.0833333333333333[/C][/ROW]
[ROW][C]tau( 21 , 22 )[/C][C]0.105409255338946[/C][C]0.800542107423126[/C][/ROW]
[ROW][C]tau( 21 , 23 )[/C][C]-0.737864787372622[/C][C]0.0769741729812668[/C][/ROW]
[ROW][C]tau( 21 , 31 )[/C][C]0.888888888888889[/C][C]0.0373564724455817[/C][/ROW]
[ROW][C]tau( 21 , 32 )[/C][C]0.948683298050514[/C][C]0.022977401503206[/C][/ROW]
[ROW][C]tau( 21 , 33 )[/C][C]-0.948683298050514[/C][C]0.0229774015032061[/C][/ROW]
[ROW][C]tau( 22 , 23 )[/C][C]0.2[/C][C]0.816666666666667[/C][/ROW]
[ROW][C]tau( 22 , 31 )[/C][C]-0.105409255338946[/C][C]0.800542107423126[/C][/ROW]
[ROW][C]tau( 22 , 32 )[/C][C]0[/C][C]1[/C][/ROW]
[ROW][C]tau( 22 , 33 )[/C][C]0[/C][C]1[/C][/ROW]
[ROW][C]tau( 23 , 31 )[/C][C]-0.948683298050514[/C][C]0.0229774015032061[/C][/ROW]
[ROW][C]tau( 23 , 32 )[/C][C]-0.8[/C][C]0.0833333333333333[/C][/ROW]
[ROW][C]tau( 23 , 33 )[/C][C]0.8[/C][C]0.0833333333333333[/C][/ROW]
[ROW][C]tau( 31 , 32 )[/C][C]0.948683298050514[/C][C]0.022977401503206[/C][/ROW]
[ROW][C]tau( 31 , 33 )[/C][C]-0.948683298050514[/C][C]0.0229774015032061[/C][/ROW]
[ROW][C]tau( 32 , 33 )[/C][C]-1[/C][C]0.0166666666666667[/C][/ROW]
[/TABLE]
Source: https://freestatistics.org/blog/index.php?pk=74613&T=1
Globally Unique Identifier (entire table): ba.freestatistics.org/blog/index.php?pk=74613&T=1
As an alternative you can also use a QR Code:
The GUIDs for individual cells are displayed in the table below:
| Kendall tau rank correlations for all pairs of data series | | pair | tau | p-value | | tau( 11 , 12 ) | 0.6 | 0.233333333333333 | | tau( 11 , 13 ) | -0.8 | 0.0833333333333333 | | tau( 11 , 21 ) | 0.948683298050514 | 0.022977401503206 | | tau( 11 , 22 ) | 0 | 1 | | tau( 11 , 23 ) | -0.8 | 0.0833333333333333 | | tau( 11 , 31 ) | 0.948683298050514 | 0.022977401503206 | | tau( 11 , 32 ) | 1 | 0.0166666666666666 | | tau( 11 , 33 ) | -1 | 0.0166666666666667 | | tau( 12 , 13 ) | -0.8 | 0.0833333333333333 | | tau( 12 , 21 ) | 0.52704627669473 | 0.206507295485425 | | tau( 12 , 22 ) | 0 | 1 | | tau( 12 , 23 ) | -0.8 | 0.0833333333333333 | | tau( 12 , 31 ) | 0.737864787372622 | 0.0769741729812667 | | tau( 12 , 32 ) | 0.6 | 0.233333333333333 | | tau( 12 , 33 ) | -0.6 | 0.233333333333333 | | tau( 13 , 21 ) | -0.737864787372622 | 0.0769741729812668 | | tau( 13 , 22 ) | 0.2 | 0.816666666666667 | | tau( 13 , 23 ) | 1 | 0.0166666666666666 | | tau( 13 , 31 ) | -0.948683298050514 | 0.0229774015032061 | | tau( 13 , 32 ) | -0.8 | 0.0833333333333333 | | tau( 13 , 33 ) | 0.8 | 0.0833333333333333 | | tau( 21 , 22 ) | 0.105409255338946 | 0.800542107423126 | | tau( 21 , 23 ) | -0.737864787372622 | 0.0769741729812668 | | tau( 21 , 31 ) | 0.888888888888889 | 0.0373564724455817 | | tau( 21 , 32 ) | 0.948683298050514 | 0.022977401503206 | | tau( 21 , 33 ) | -0.948683298050514 | 0.0229774015032061 | | tau( 22 , 23 ) | 0.2 | 0.816666666666667 | | tau( 22 , 31 ) | -0.105409255338946 | 0.800542107423126 | | tau( 22 , 32 ) | 0 | 1 | | tau( 22 , 33 ) | 0 | 1 | | tau( 23 , 31 ) | -0.948683298050514 | 0.0229774015032061 | | tau( 23 , 32 ) | -0.8 | 0.0833333333333333 | | tau( 23 , 33 ) | 0.8 | 0.0833333333333333 | | tau( 31 , 32 ) | 0.948683298050514 | 0.022977401503206 | | tau( 31 , 33 ) | -0.948683298050514 | 0.0229774015032061 | | tau( 32 , 33 ) | -1 | 0.0166666666666667 |
If you paste this QR Code into your document, anyone with a smartphone or tablet will be able to scan it and view this table in a browser.
If you paste this QR Code into your document, anyone with a smartphone or tablet will be able to scan it and view this table in a browser.
If you paste this QR Code into your document, anyone with a smartphone or tablet will be able to scan it and view this table in a browser.
If you paste this QR Code into your document, anyone with a smartphone or tablet will be able to scan it and view this table in a browser.
If you paste this QR Code into your document, anyone with a smartphone or tablet will be able to scan it and view this table in a browser.
|